Basic Config of Predbat (after staring from scratch)

239 comments started 2024-09-19 last 2024-12-17
Home Automation
D
#1 Daveb01

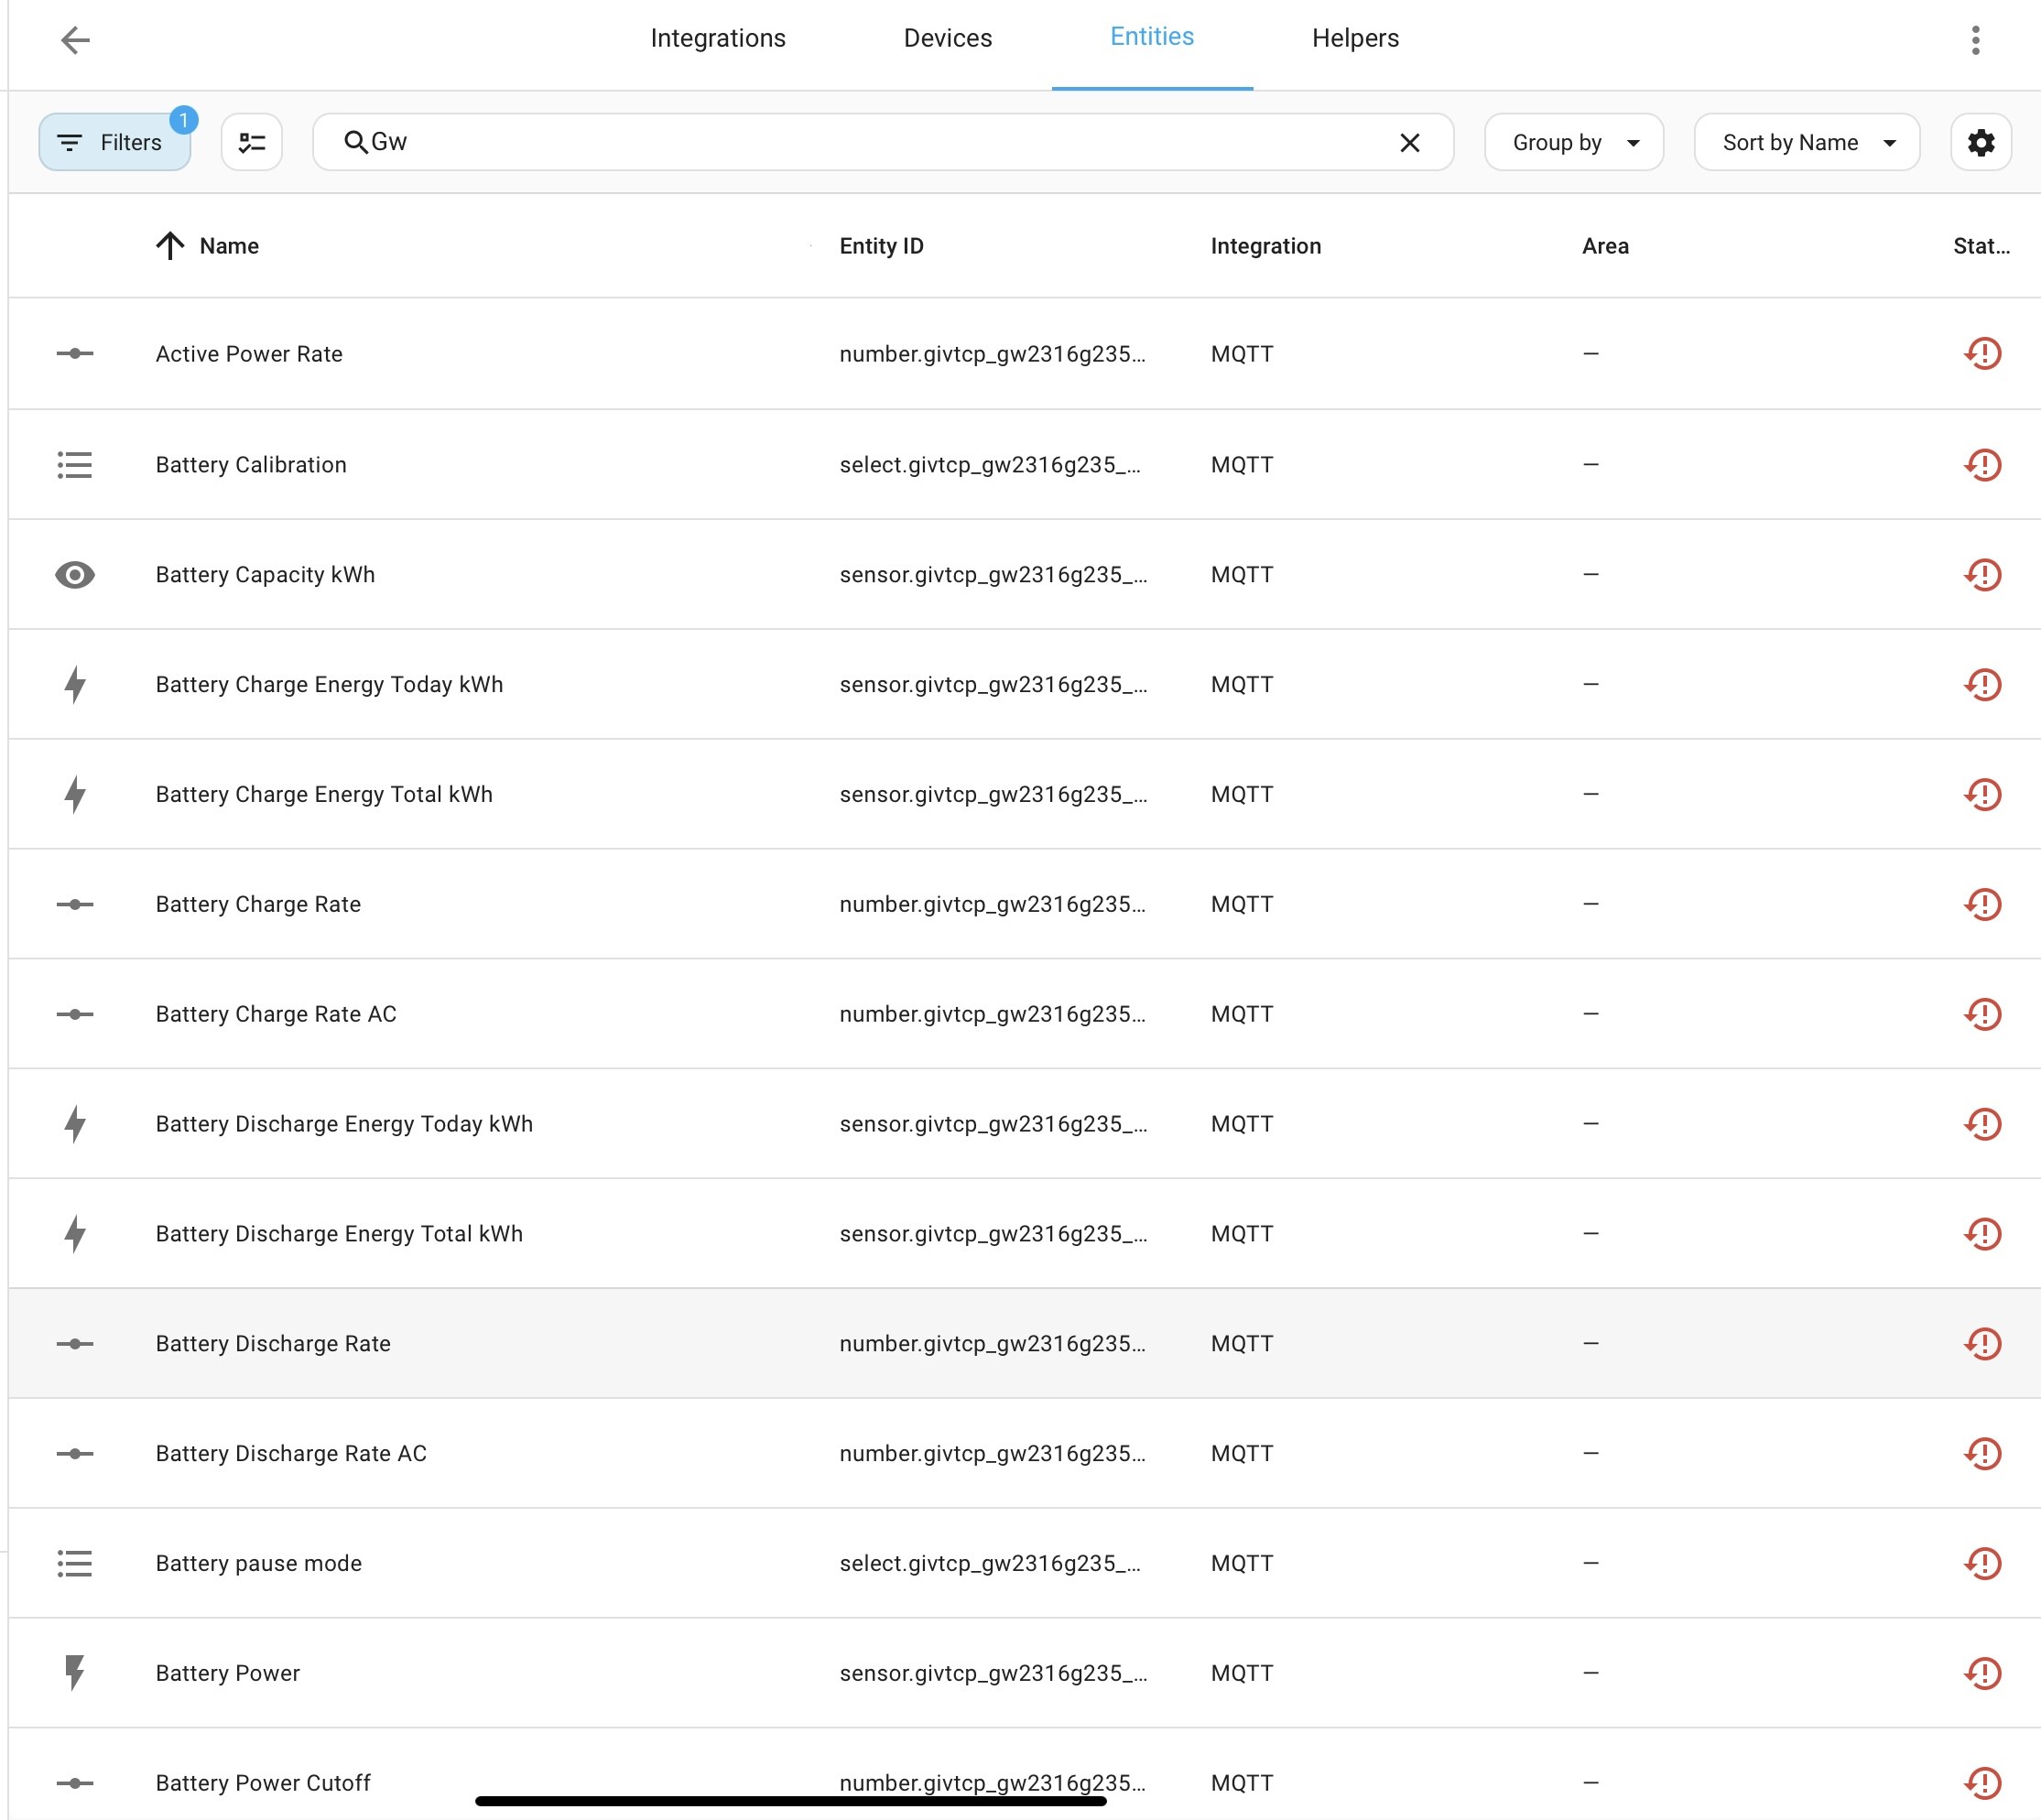
Hi all, I have started this post to continue my journey from scratch (Hardware, HA install, HA configuration, Add-ons, GivTCP and finally Predbat install only.

Here is the link to that post

https://community.givenergy.cloud/d/4954-how-to-use-predbat-from-scratch/111

This part of the journey will just be to help newbies with no knowledge of Predbat, editing Yaml’s, setting up a Dashboards etc. Once that is done I will put a link in the last comment to “First night on Predbat”. Where all the experience geeks chat and sort out issues.

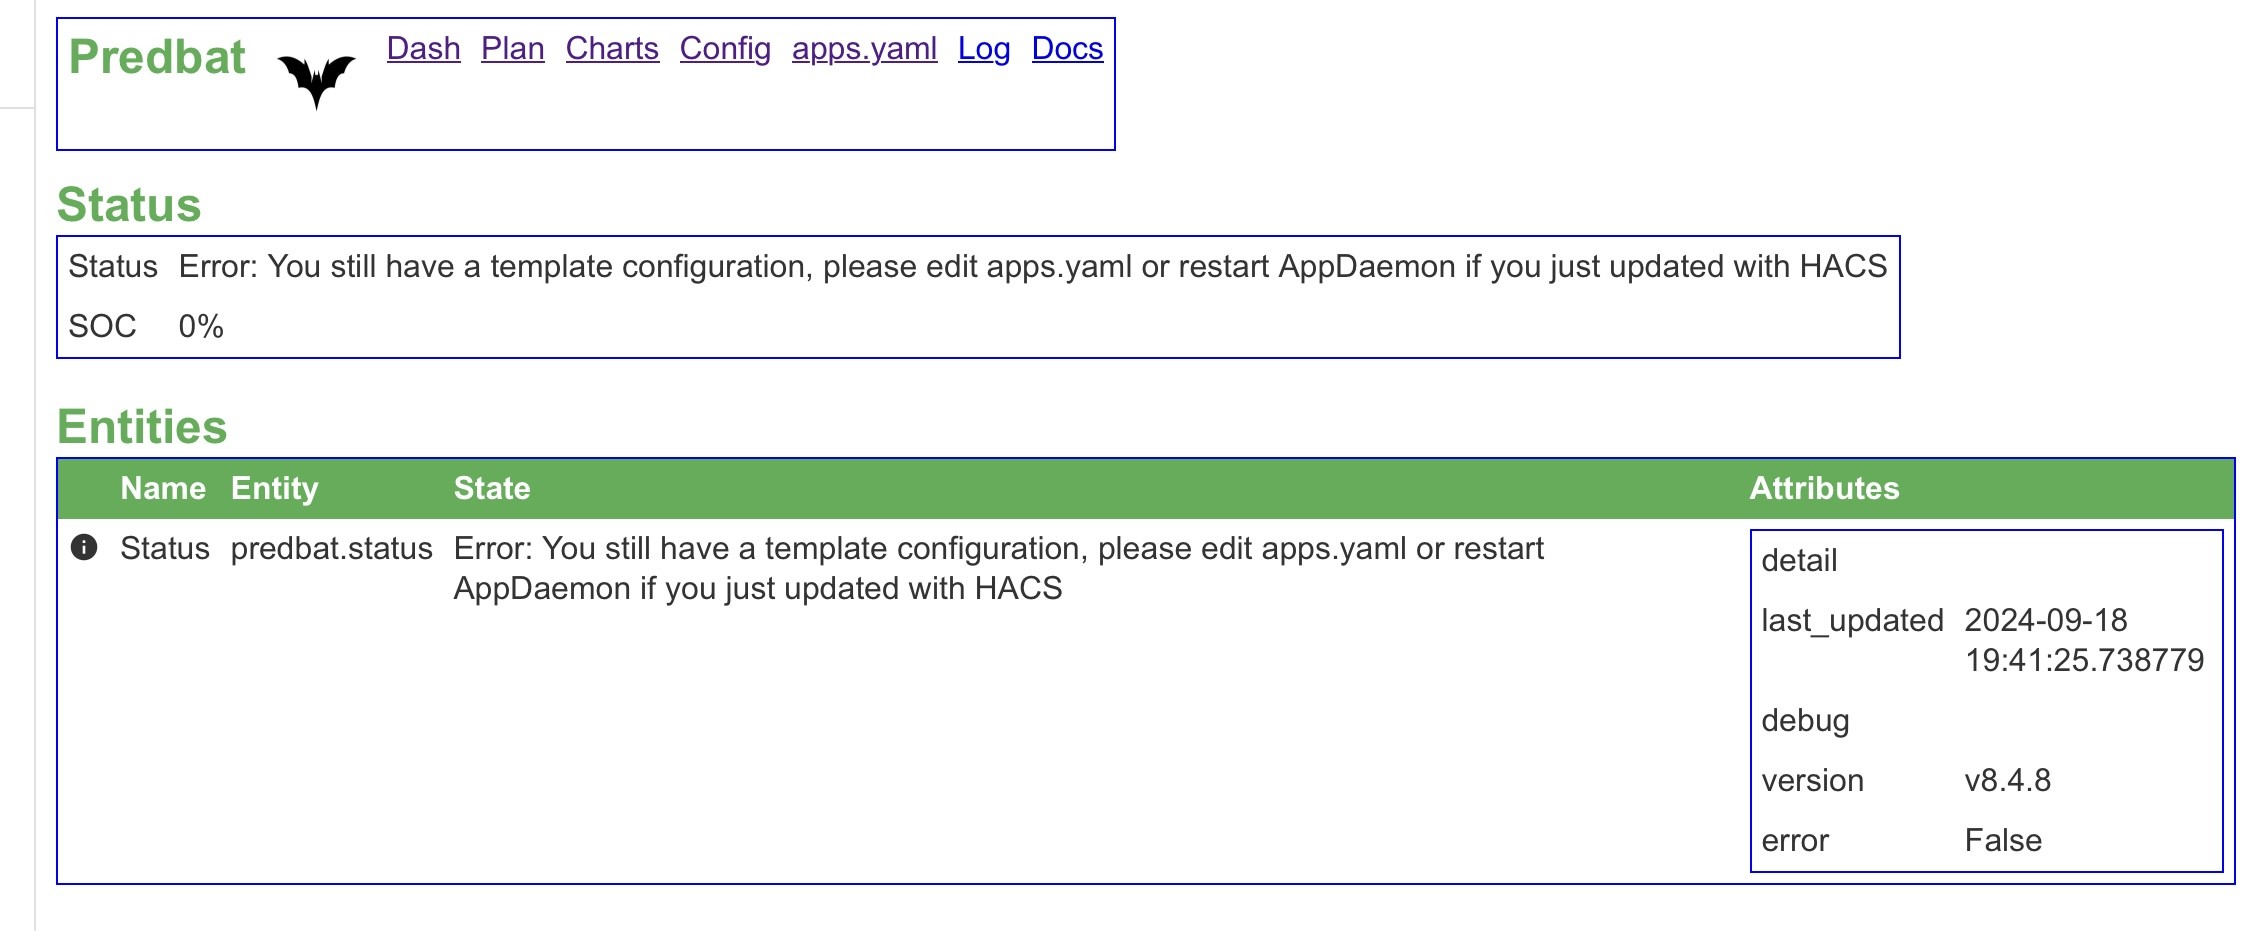
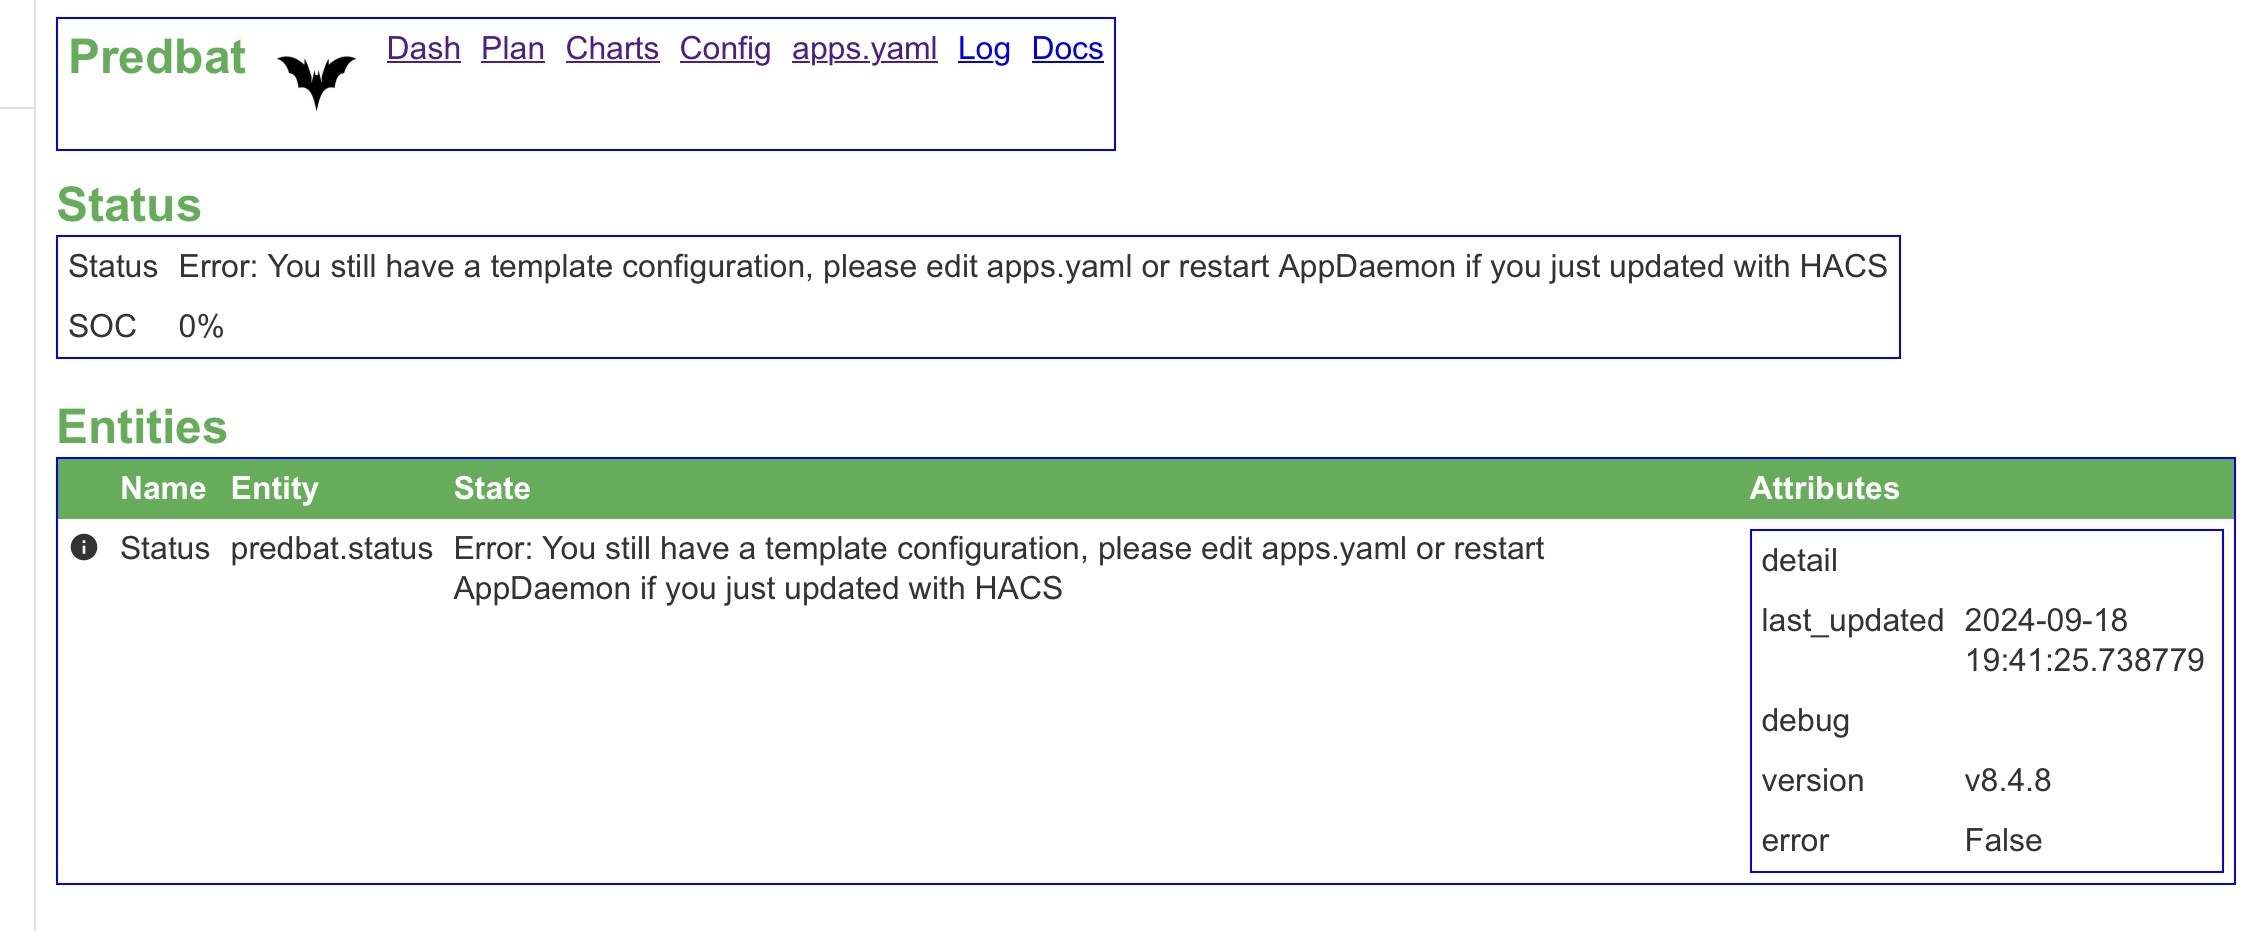
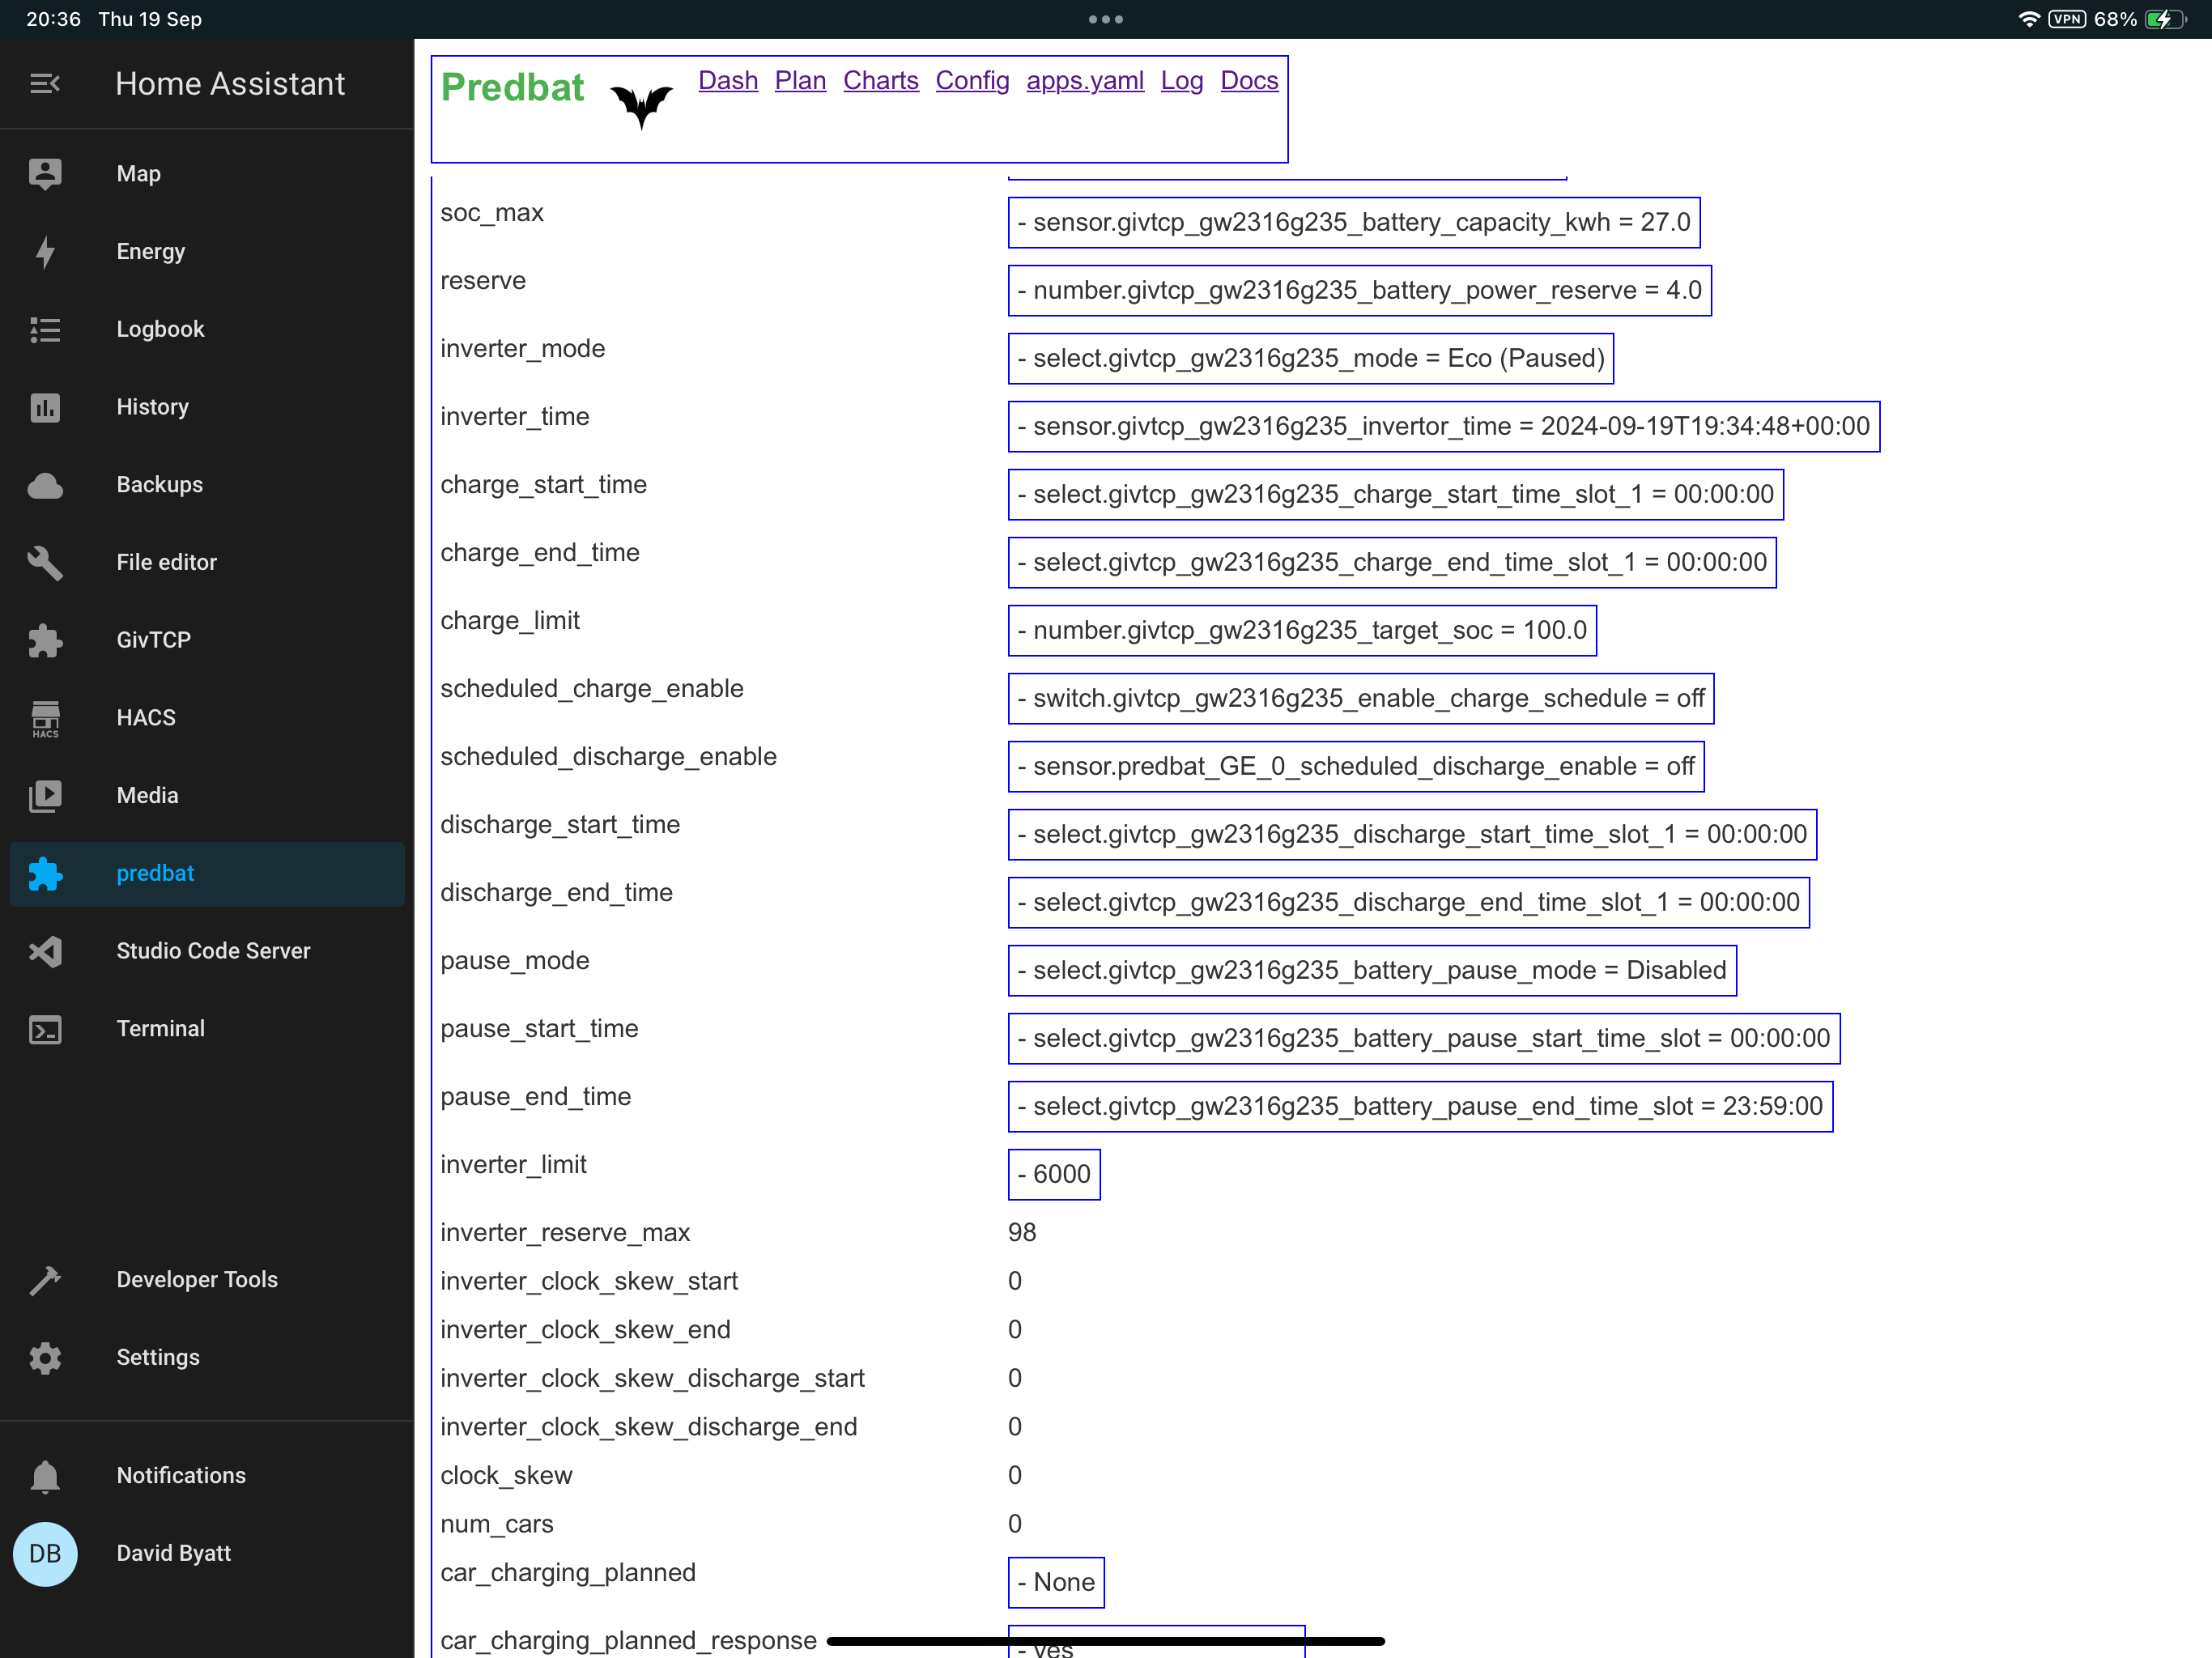
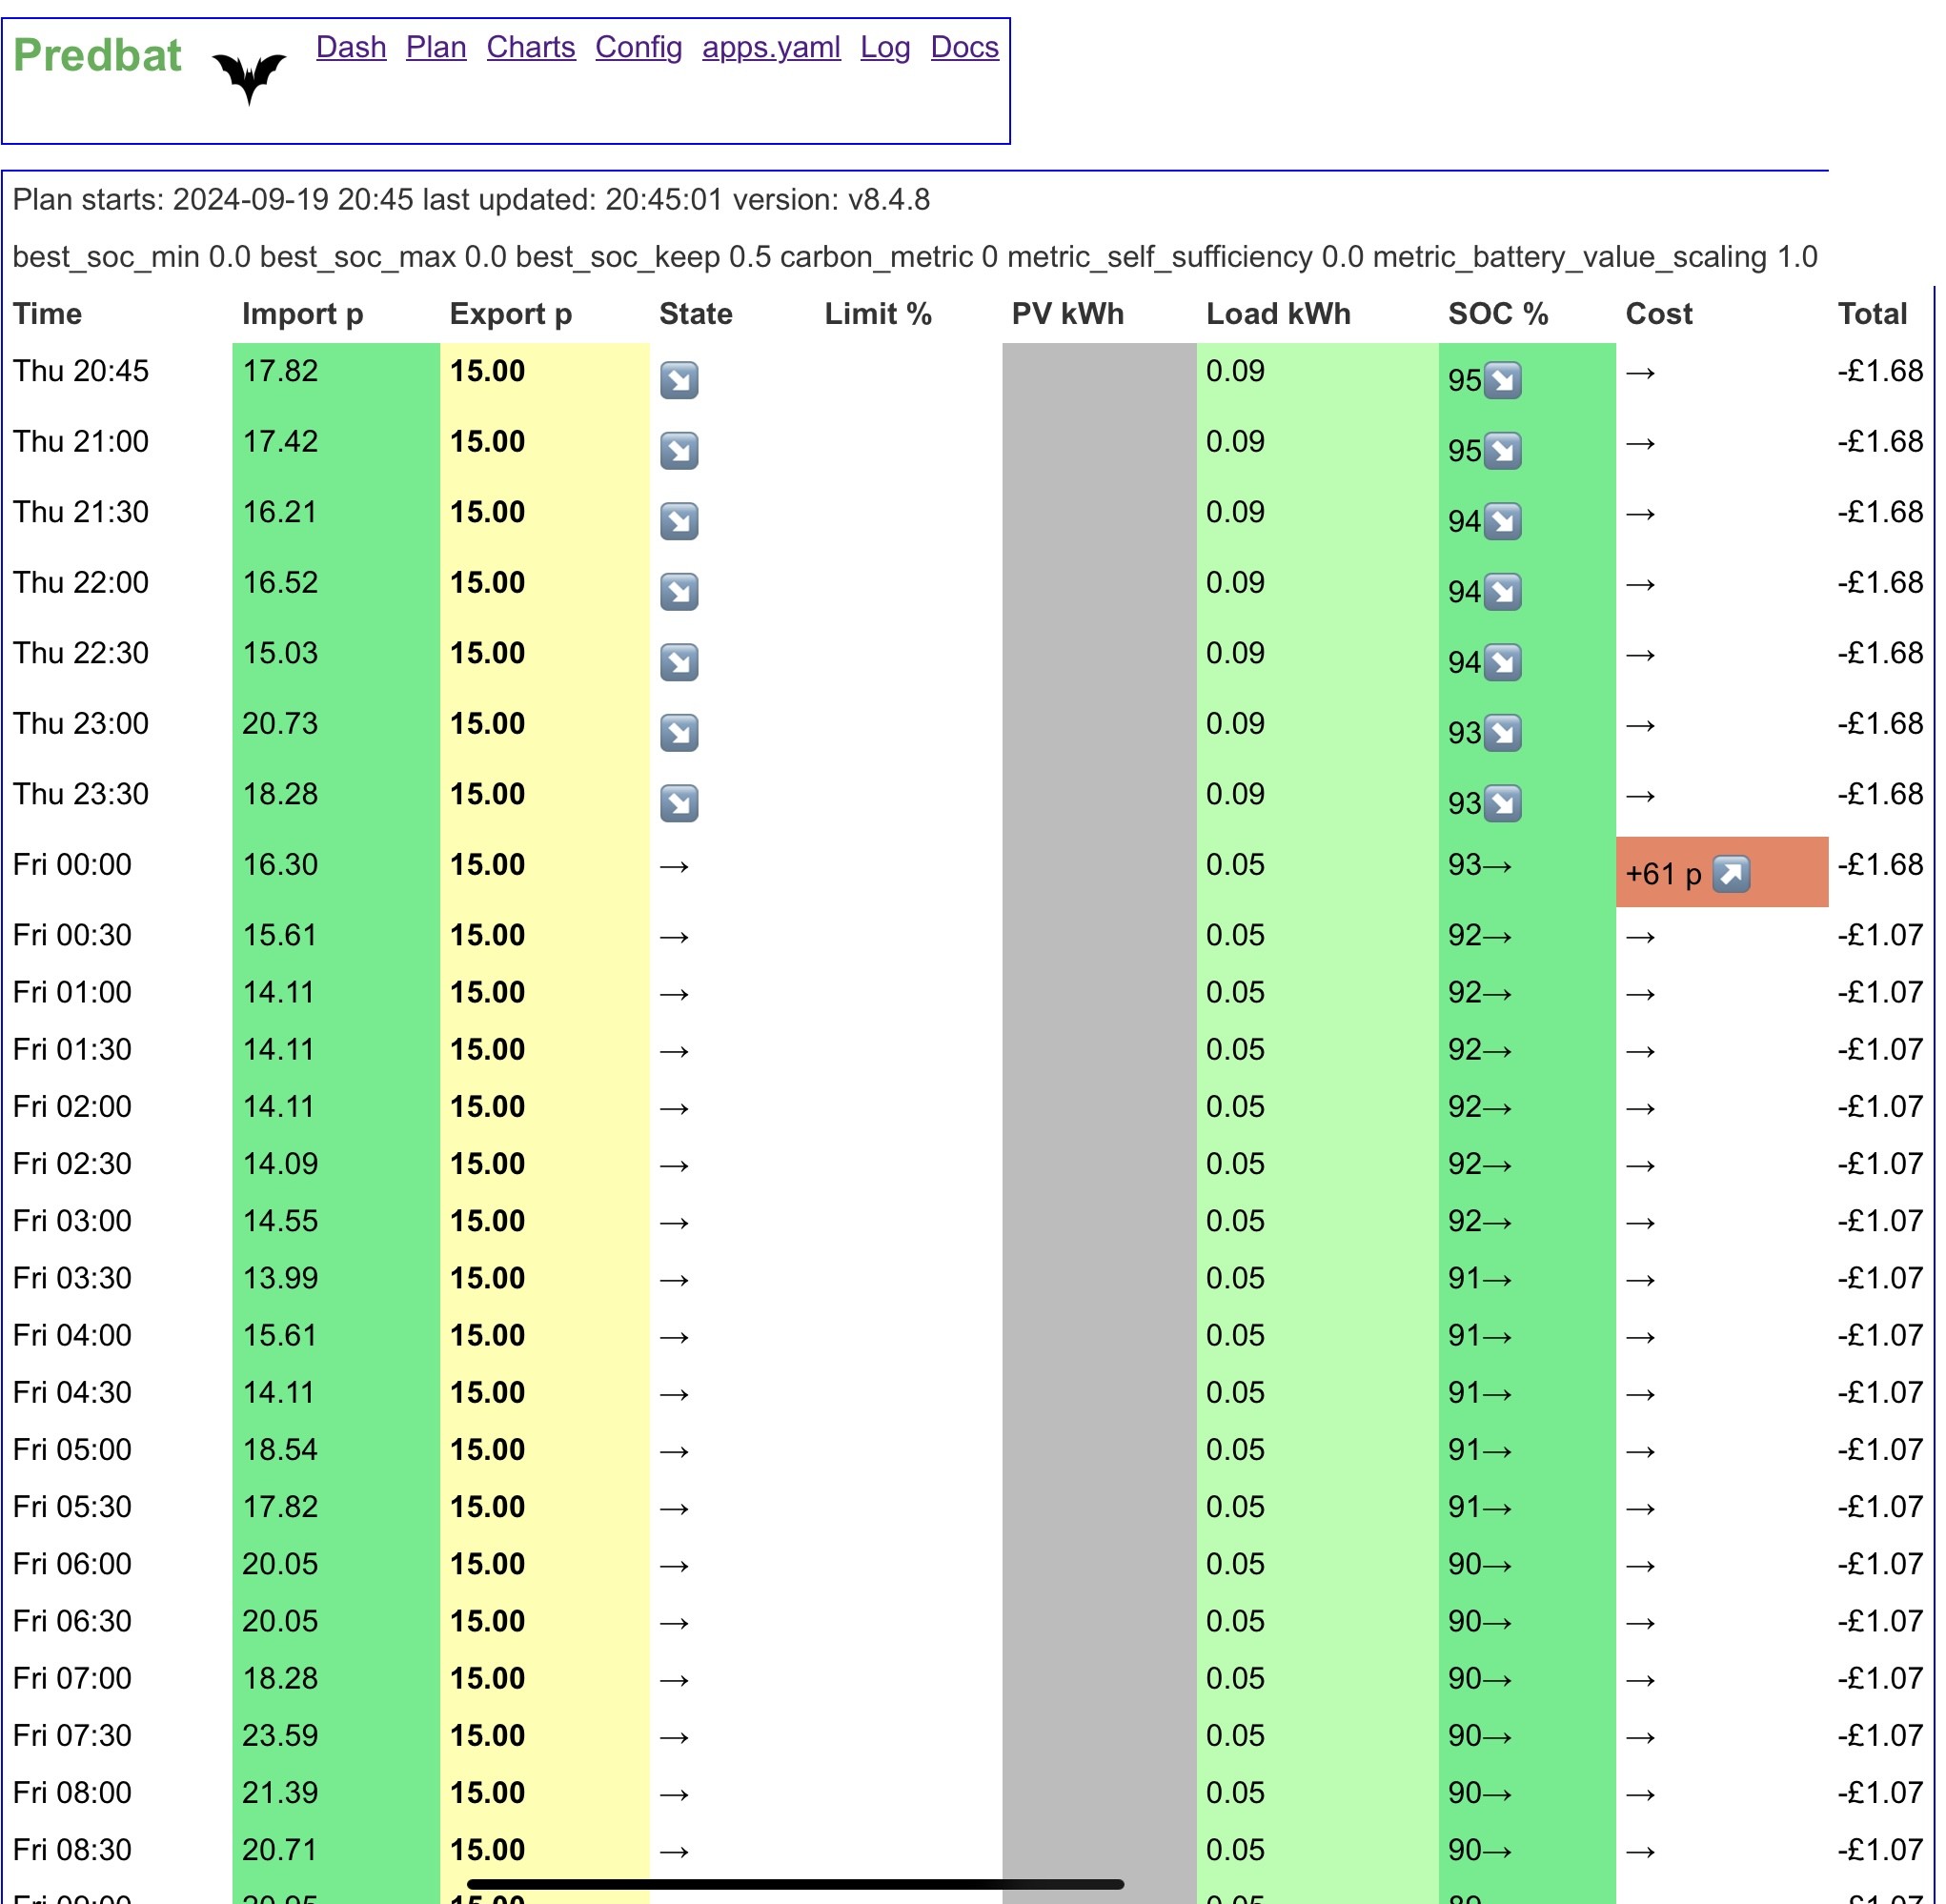
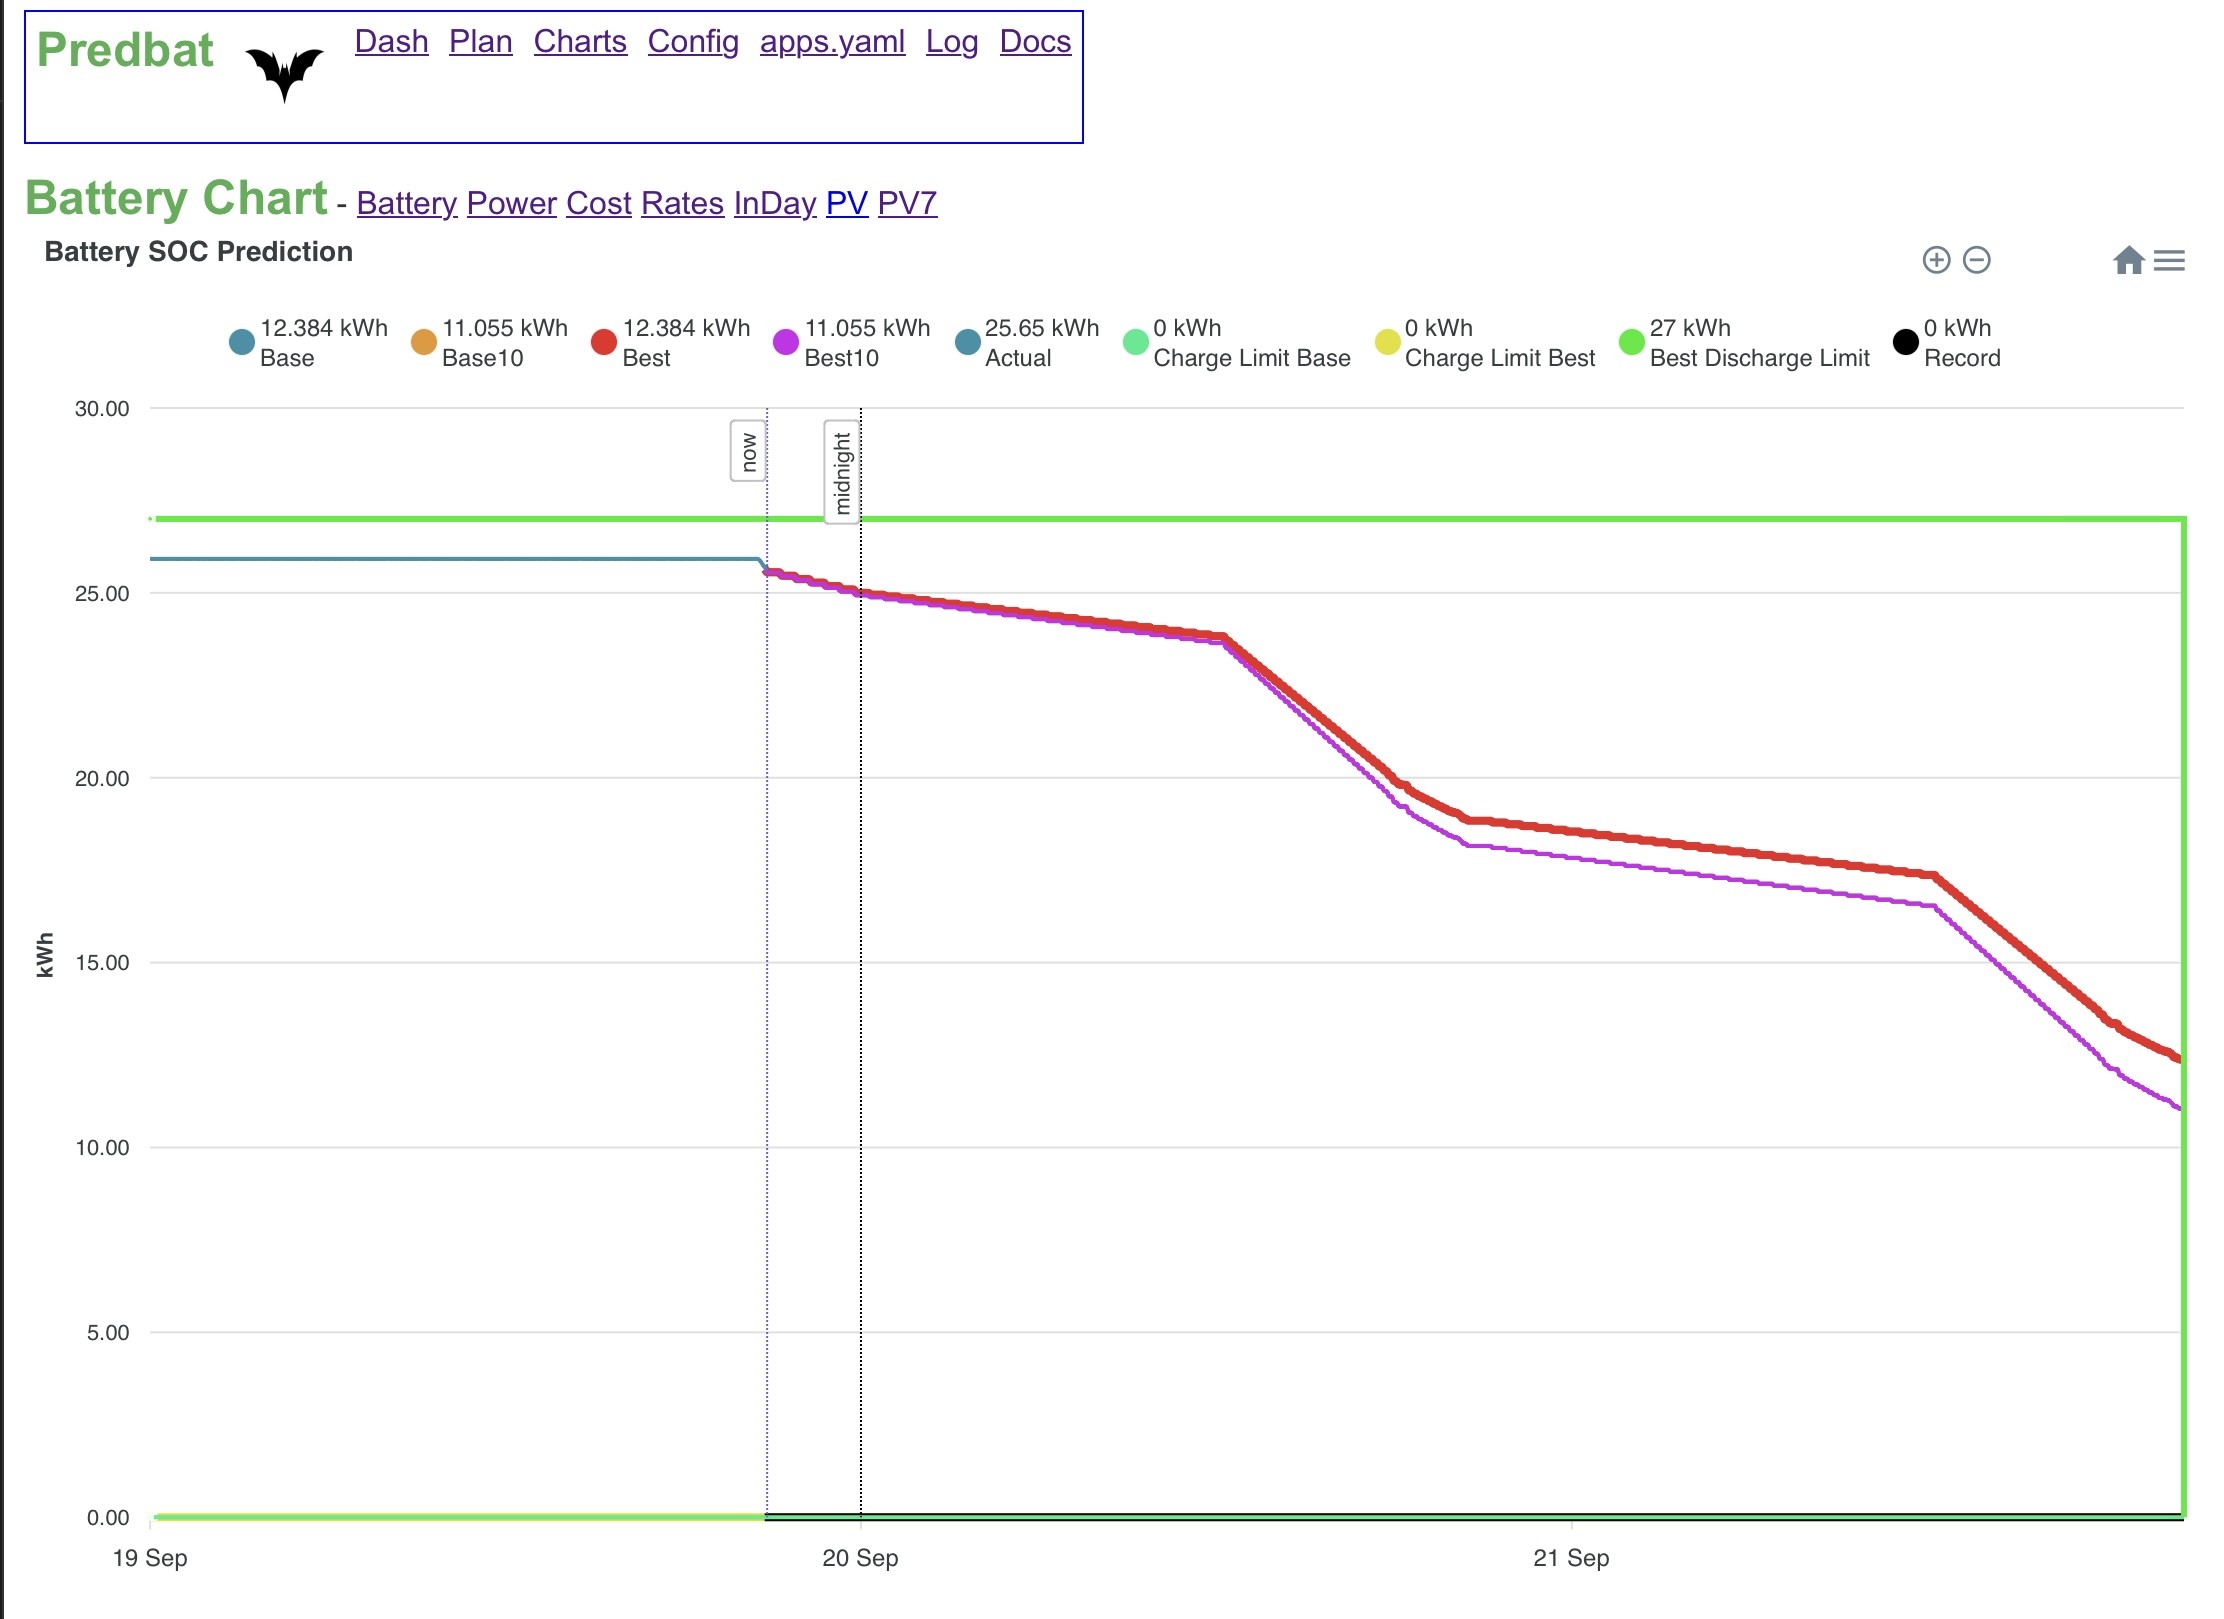
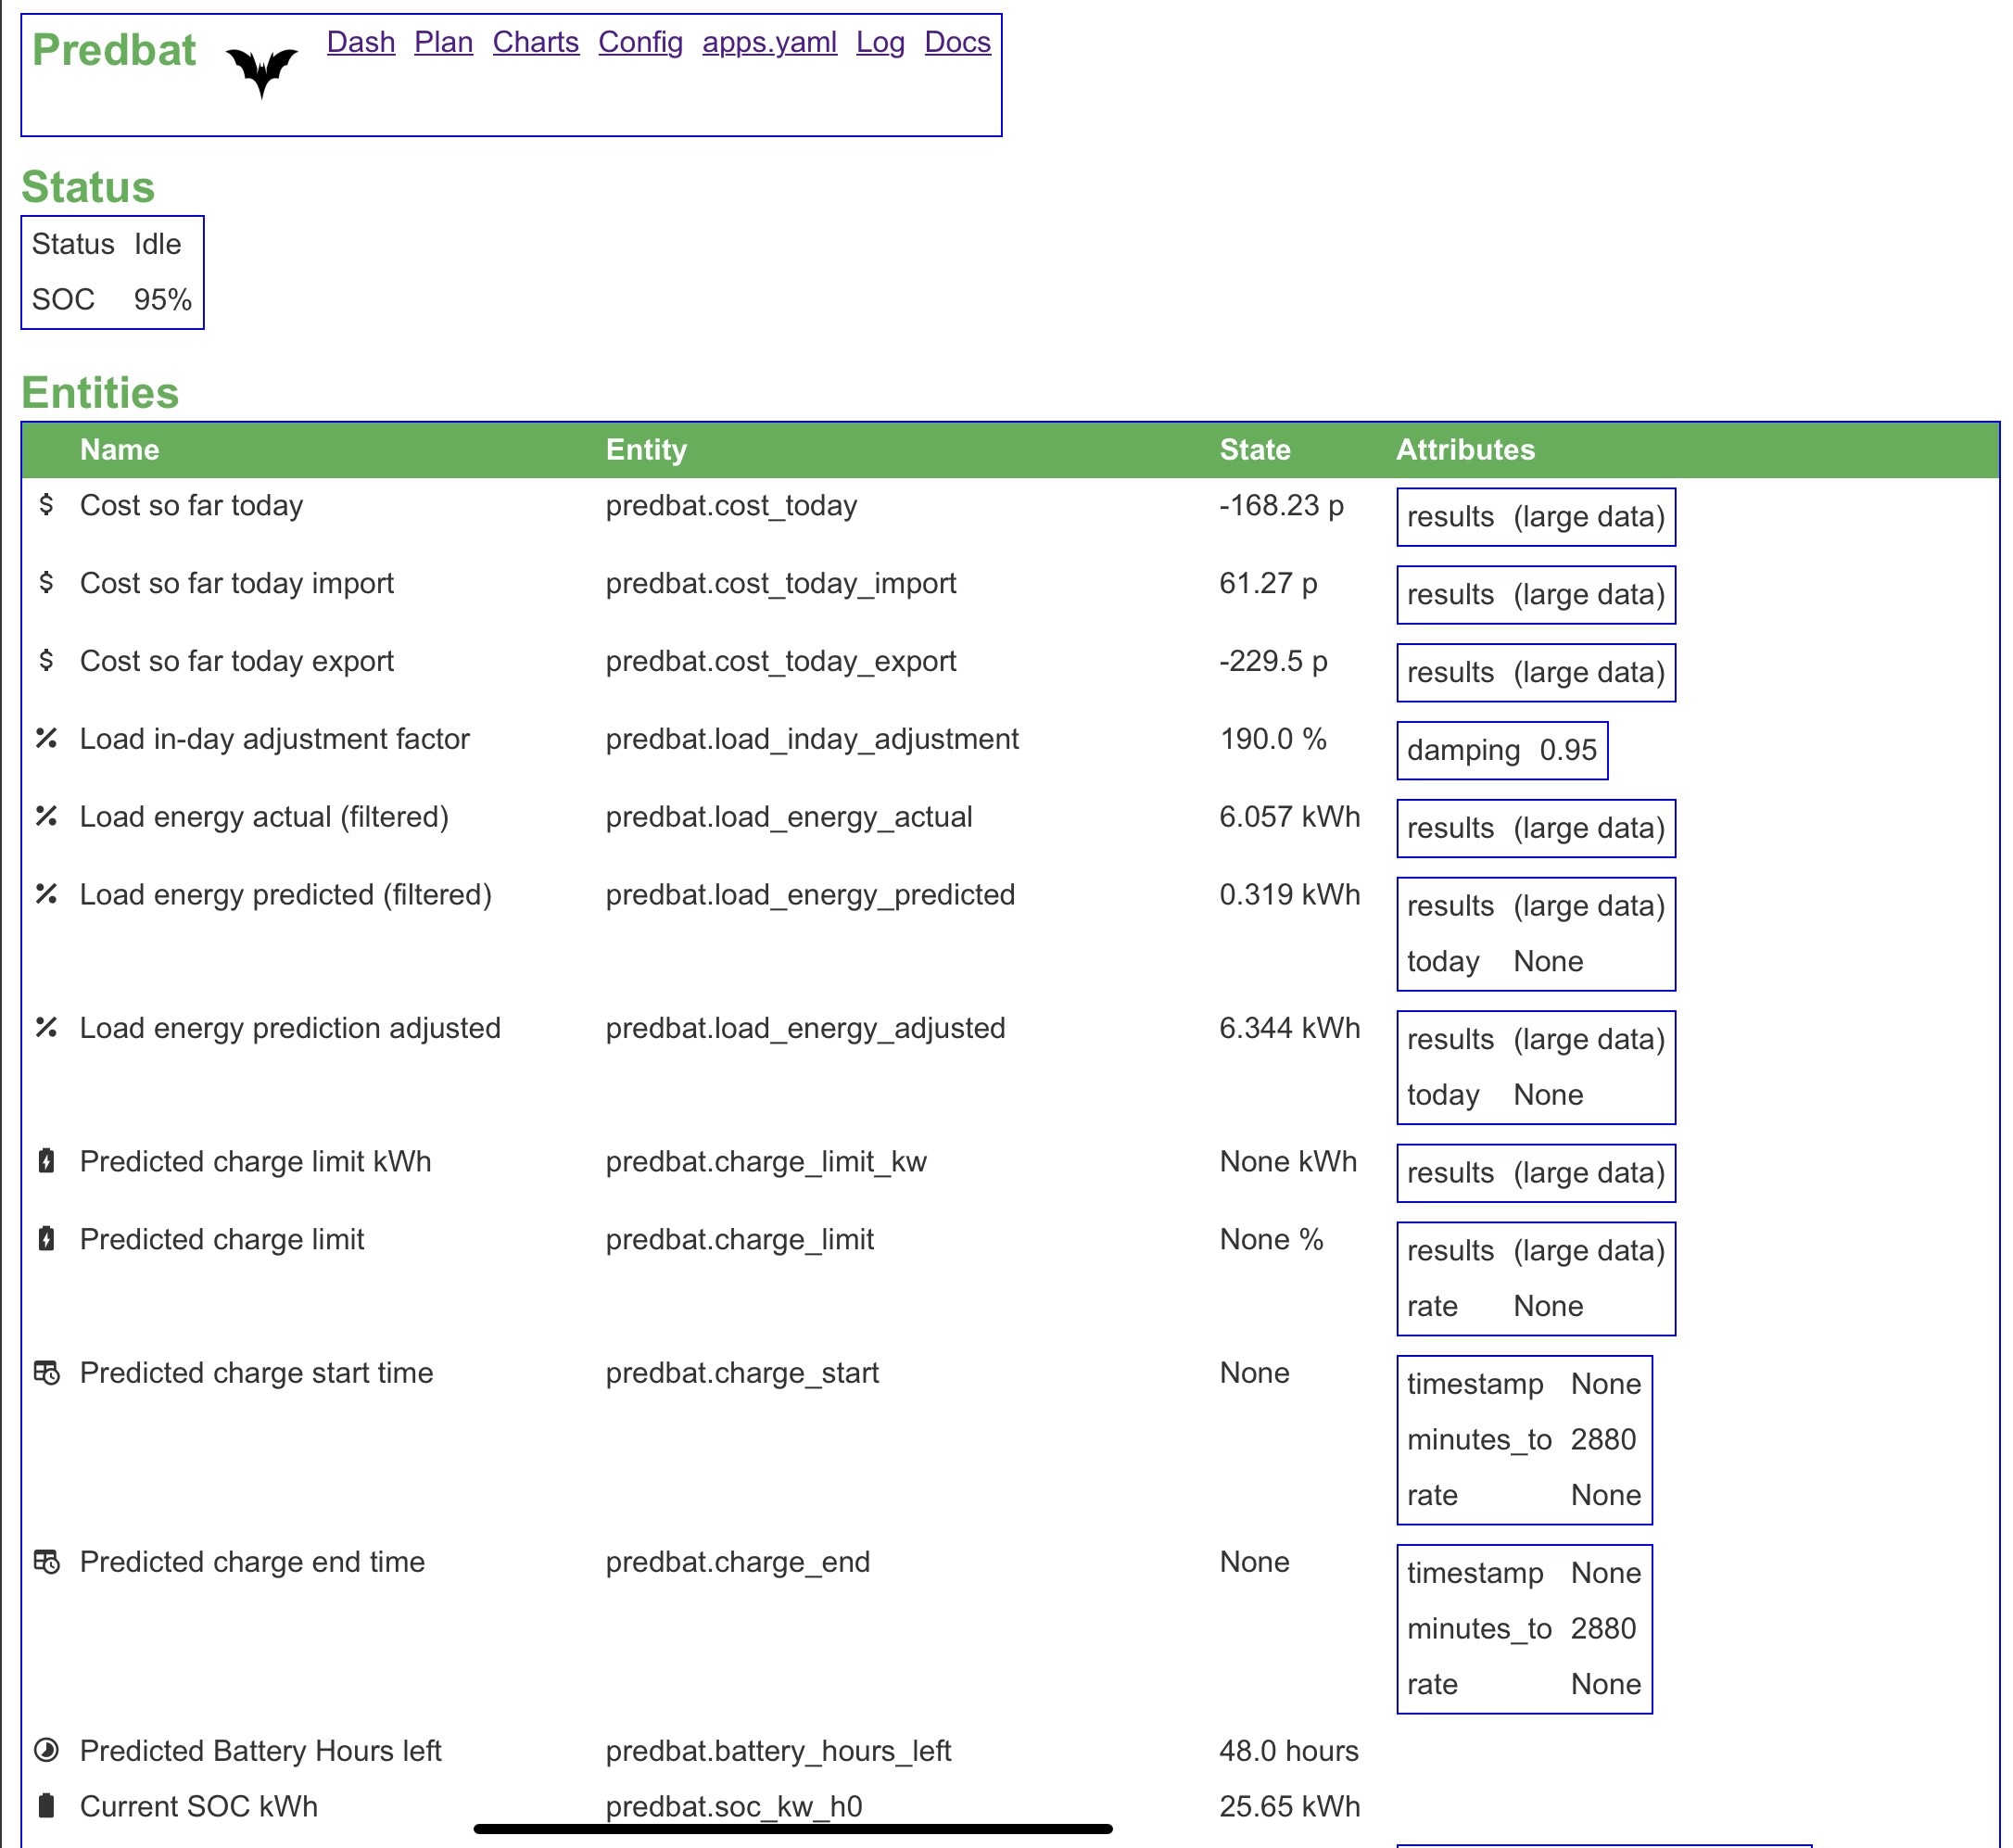
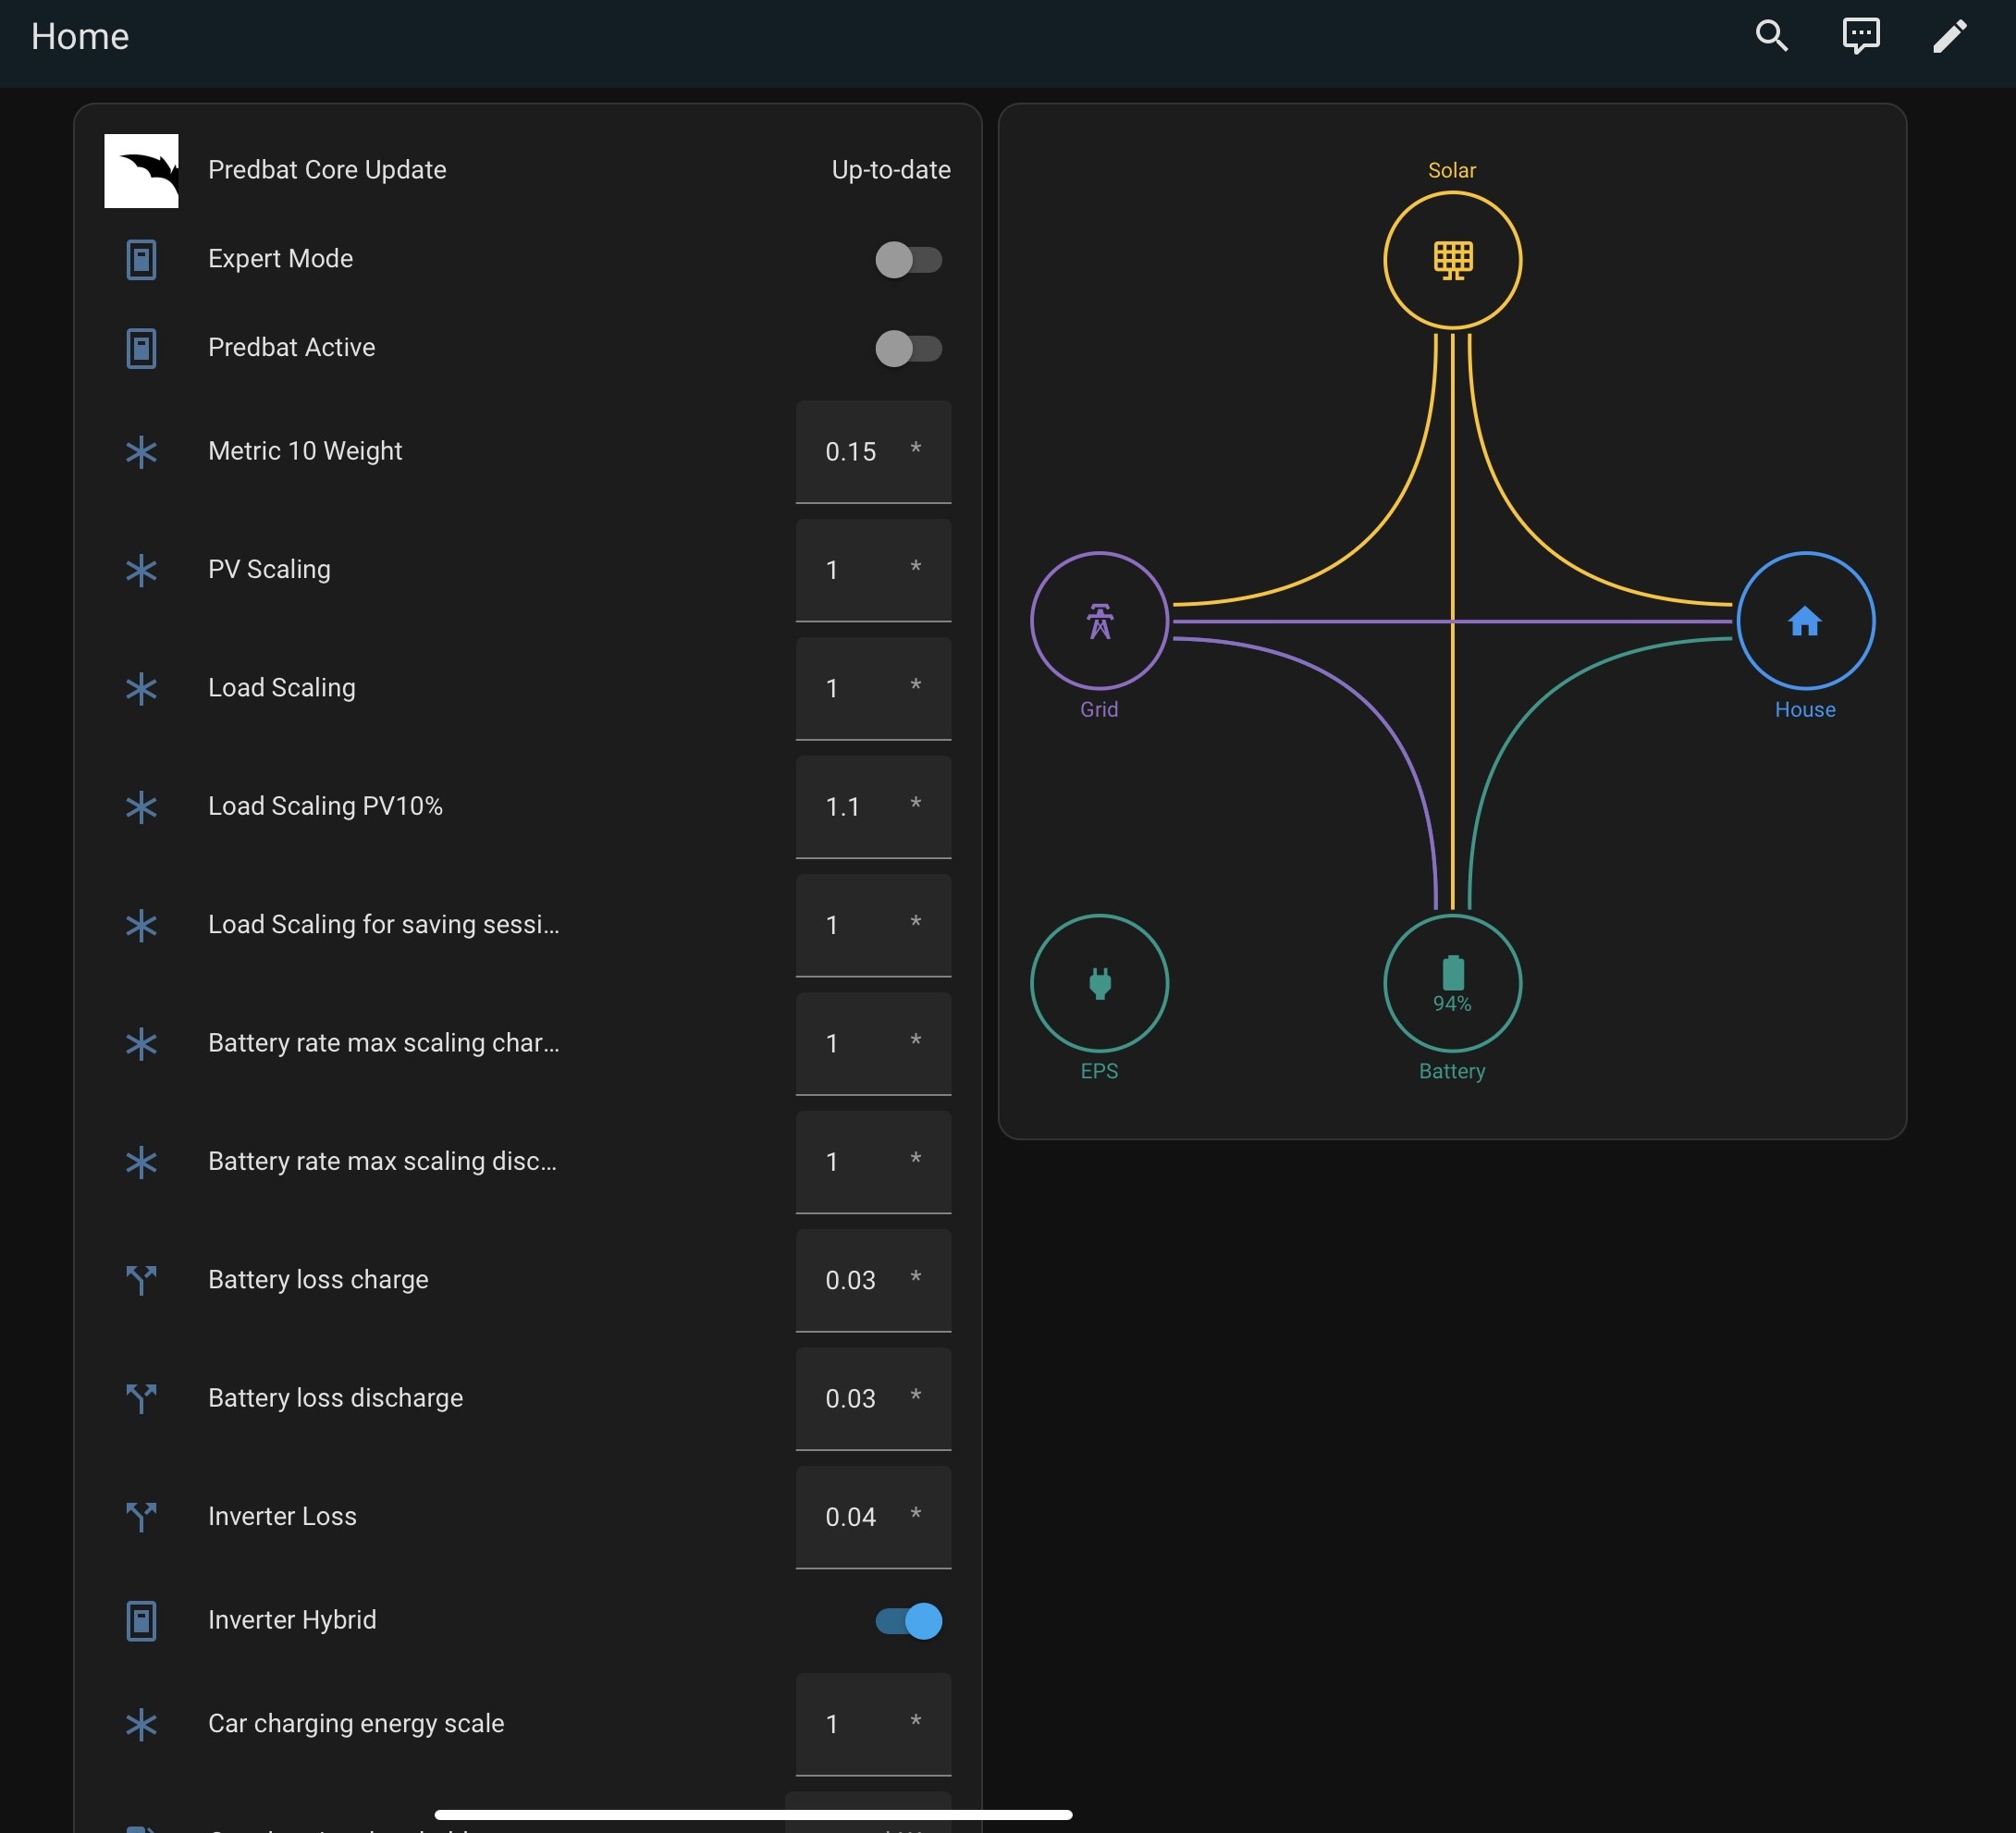
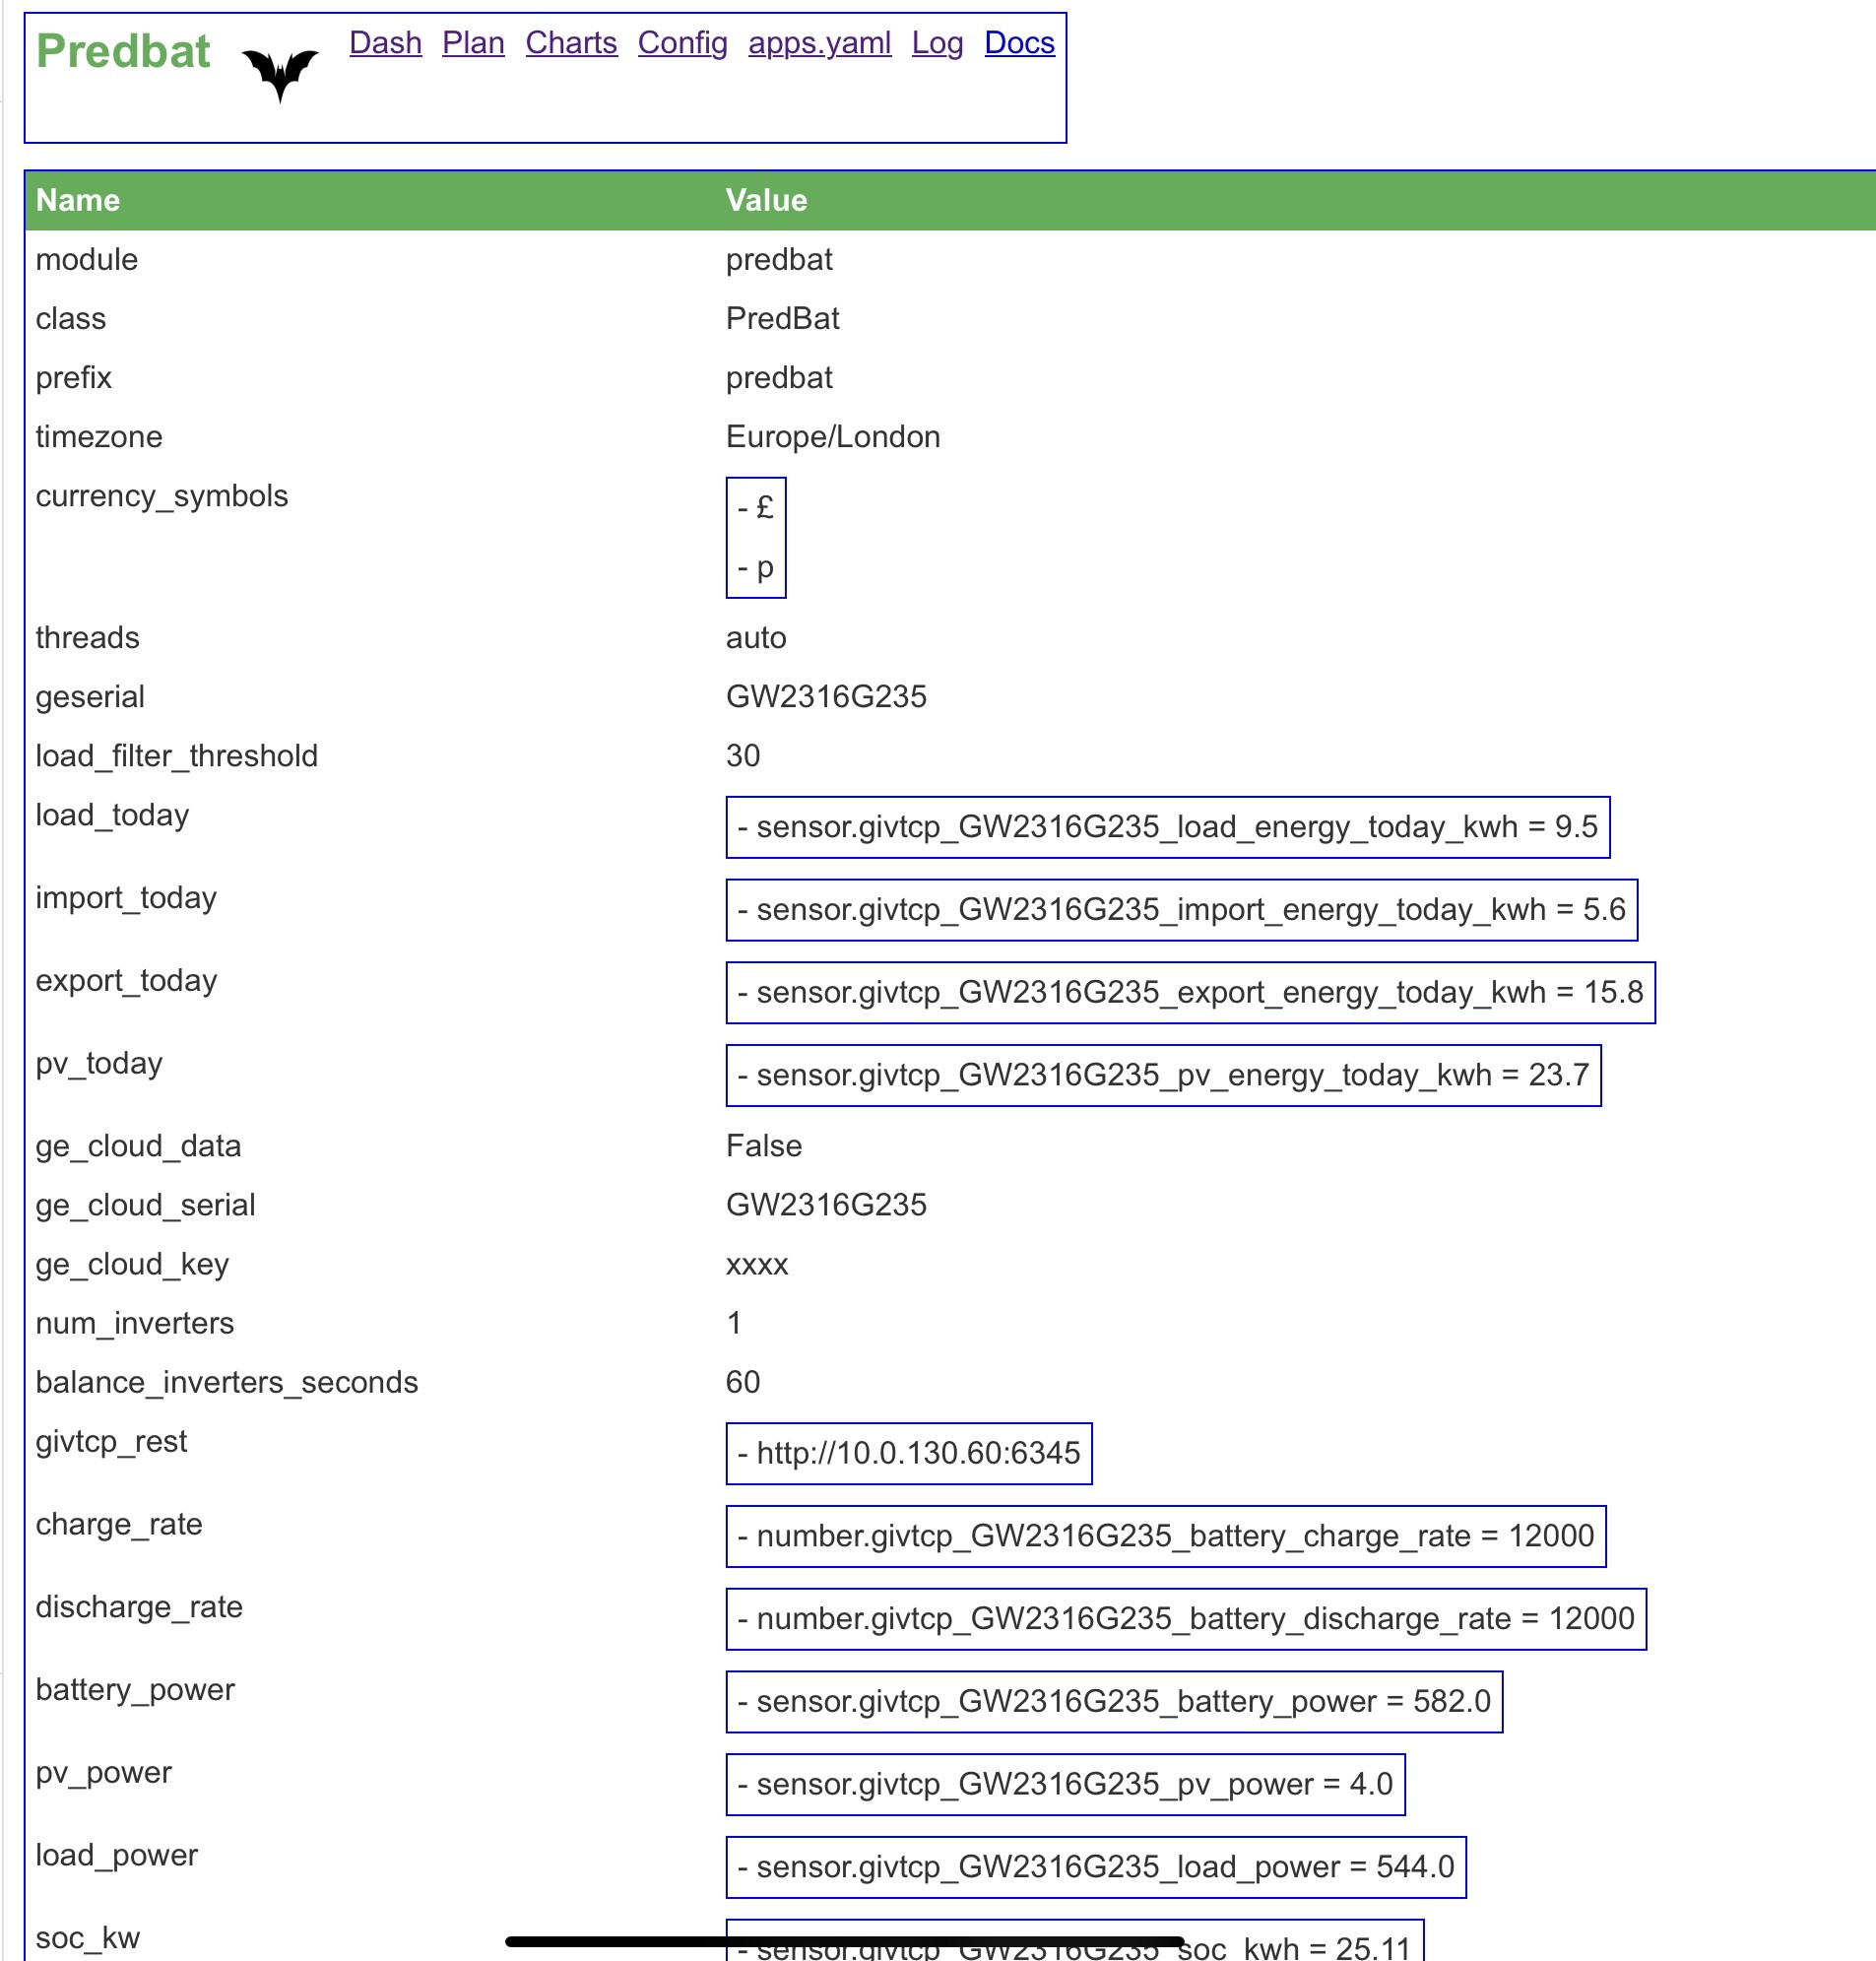
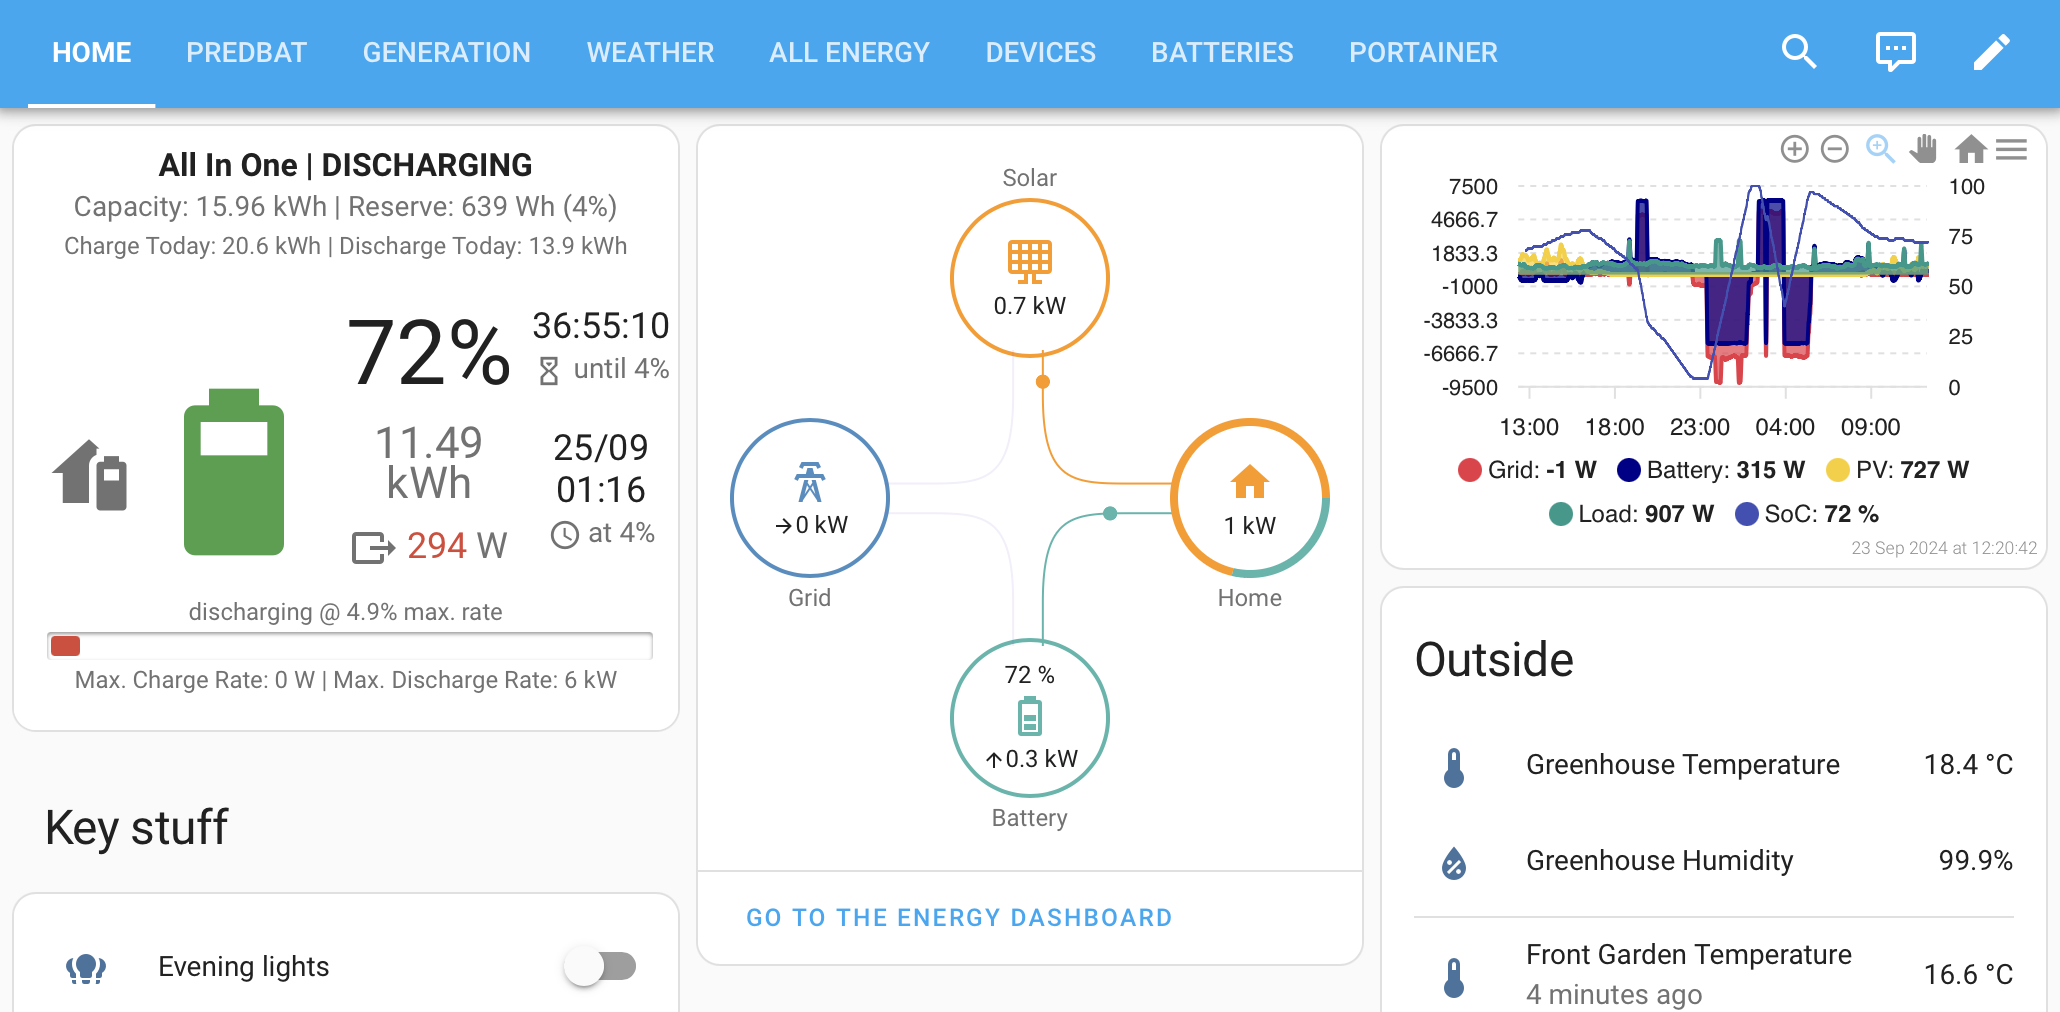
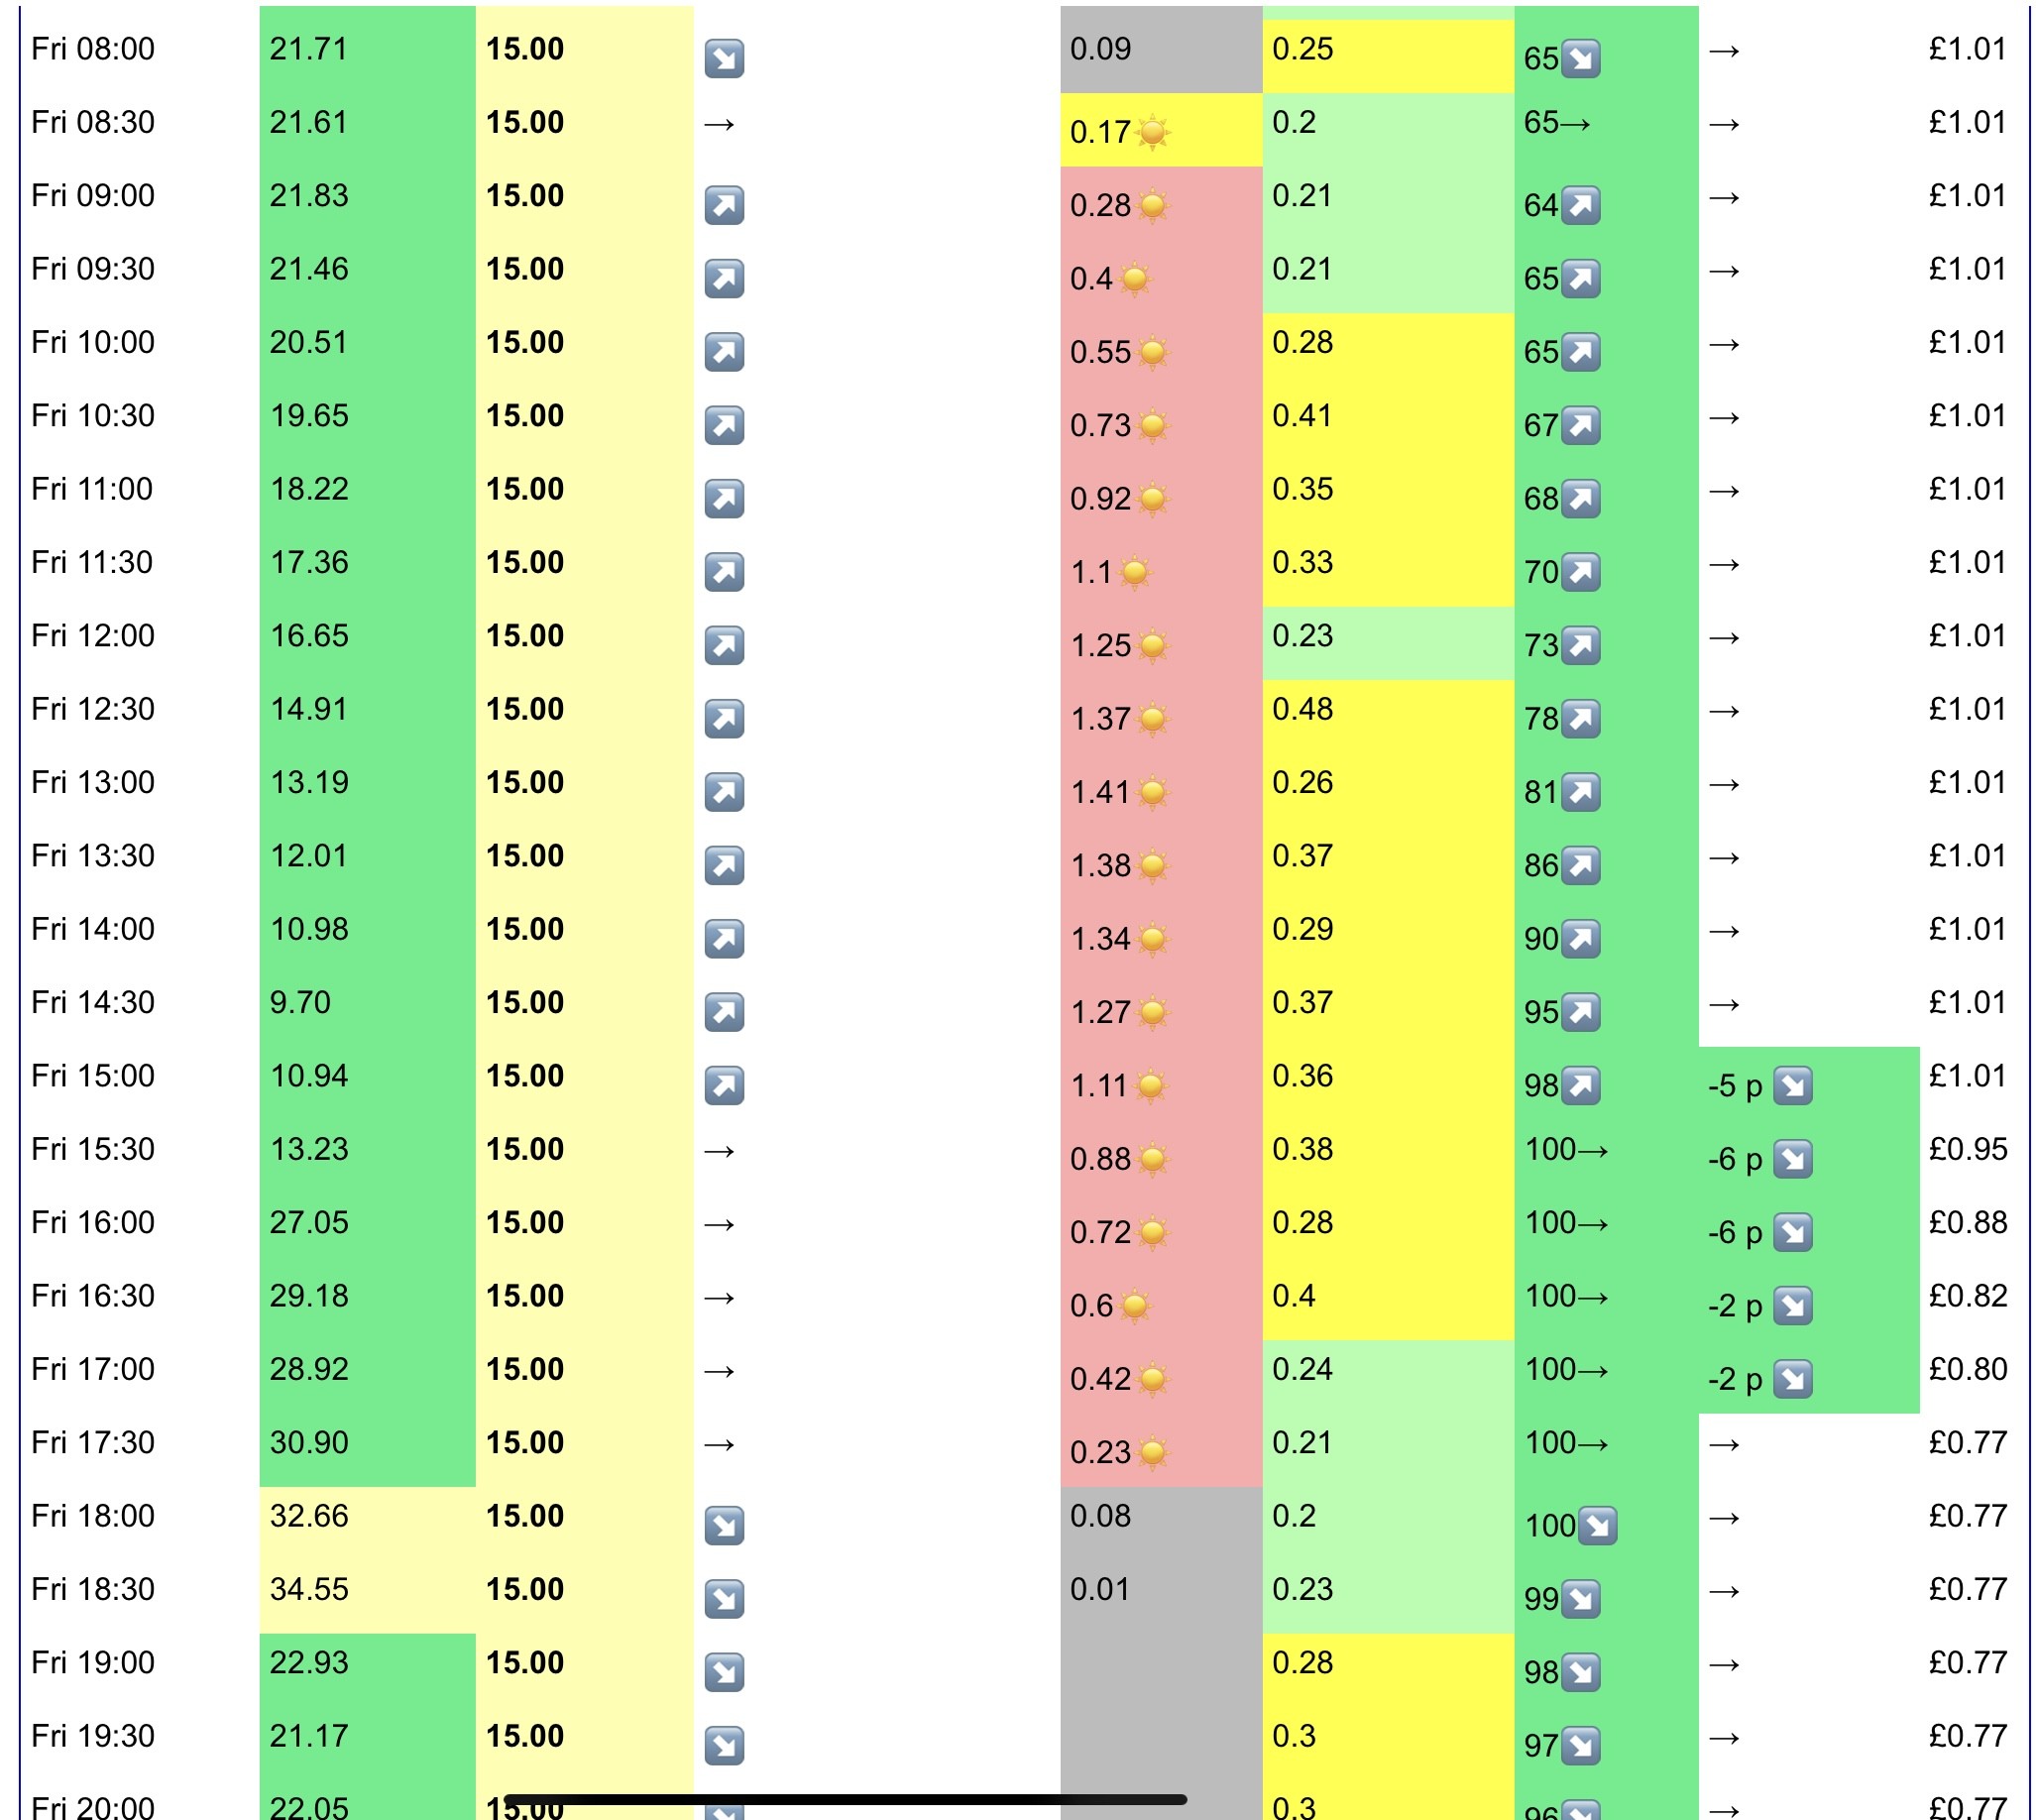
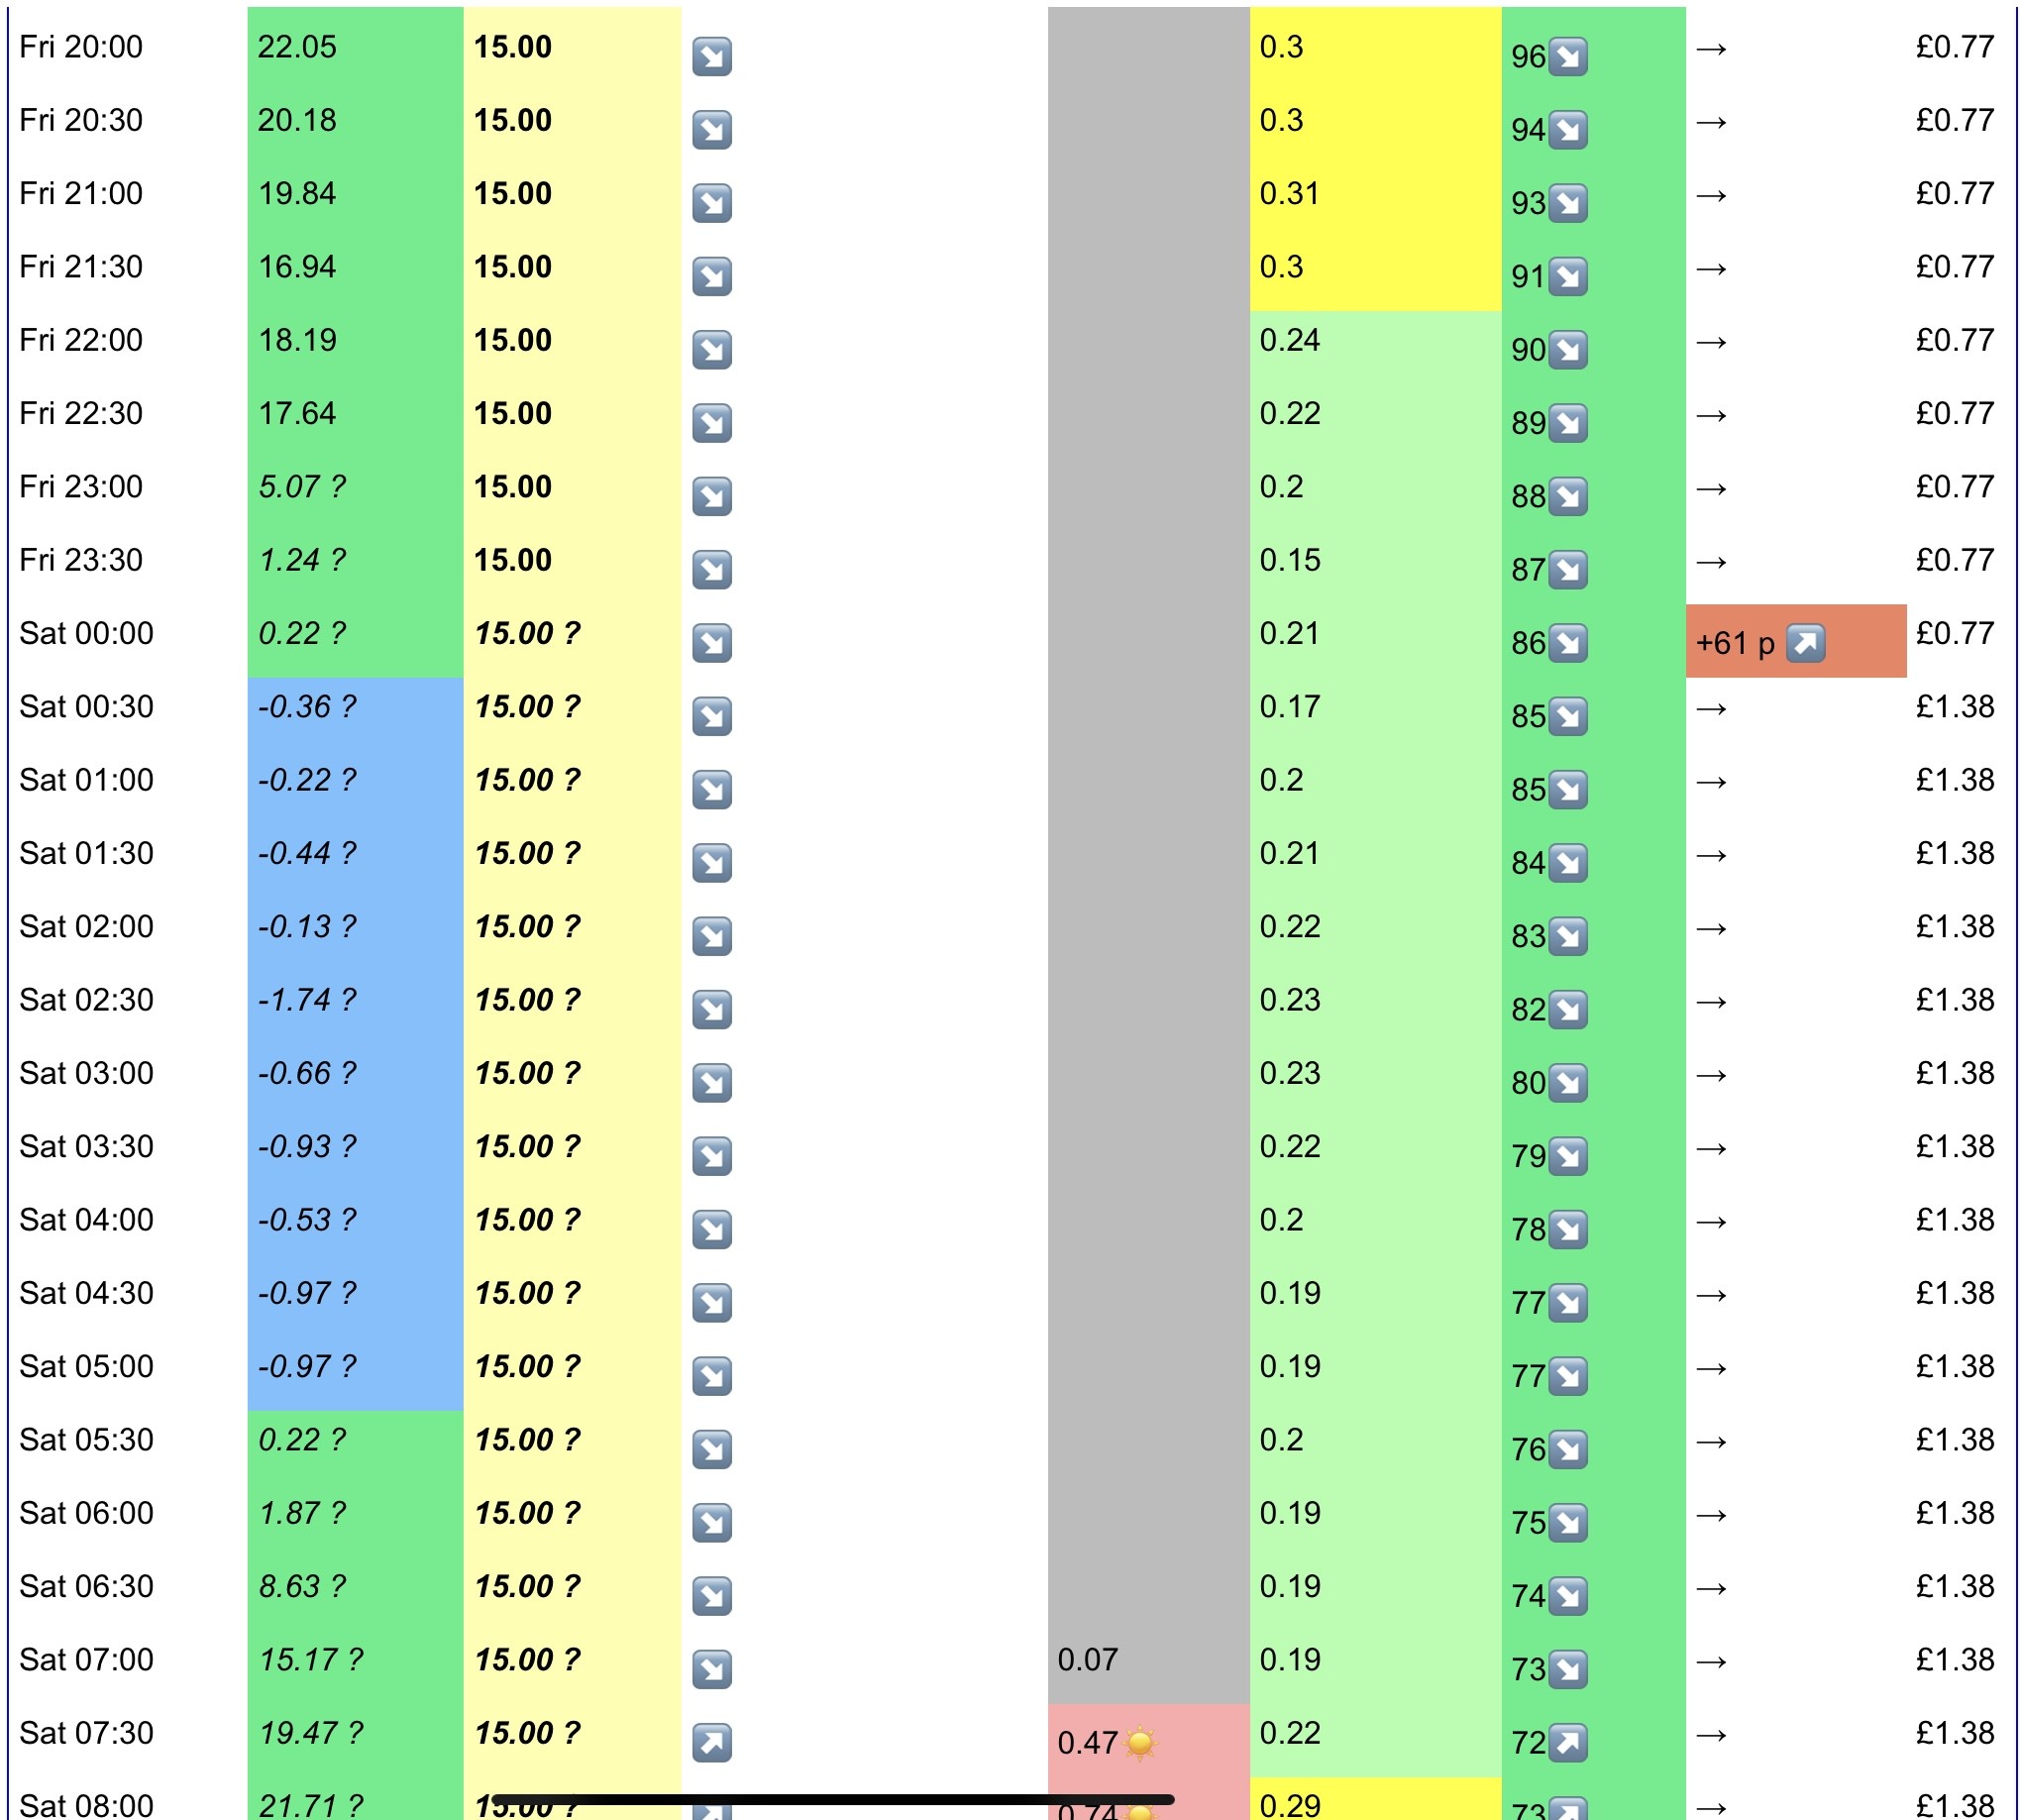
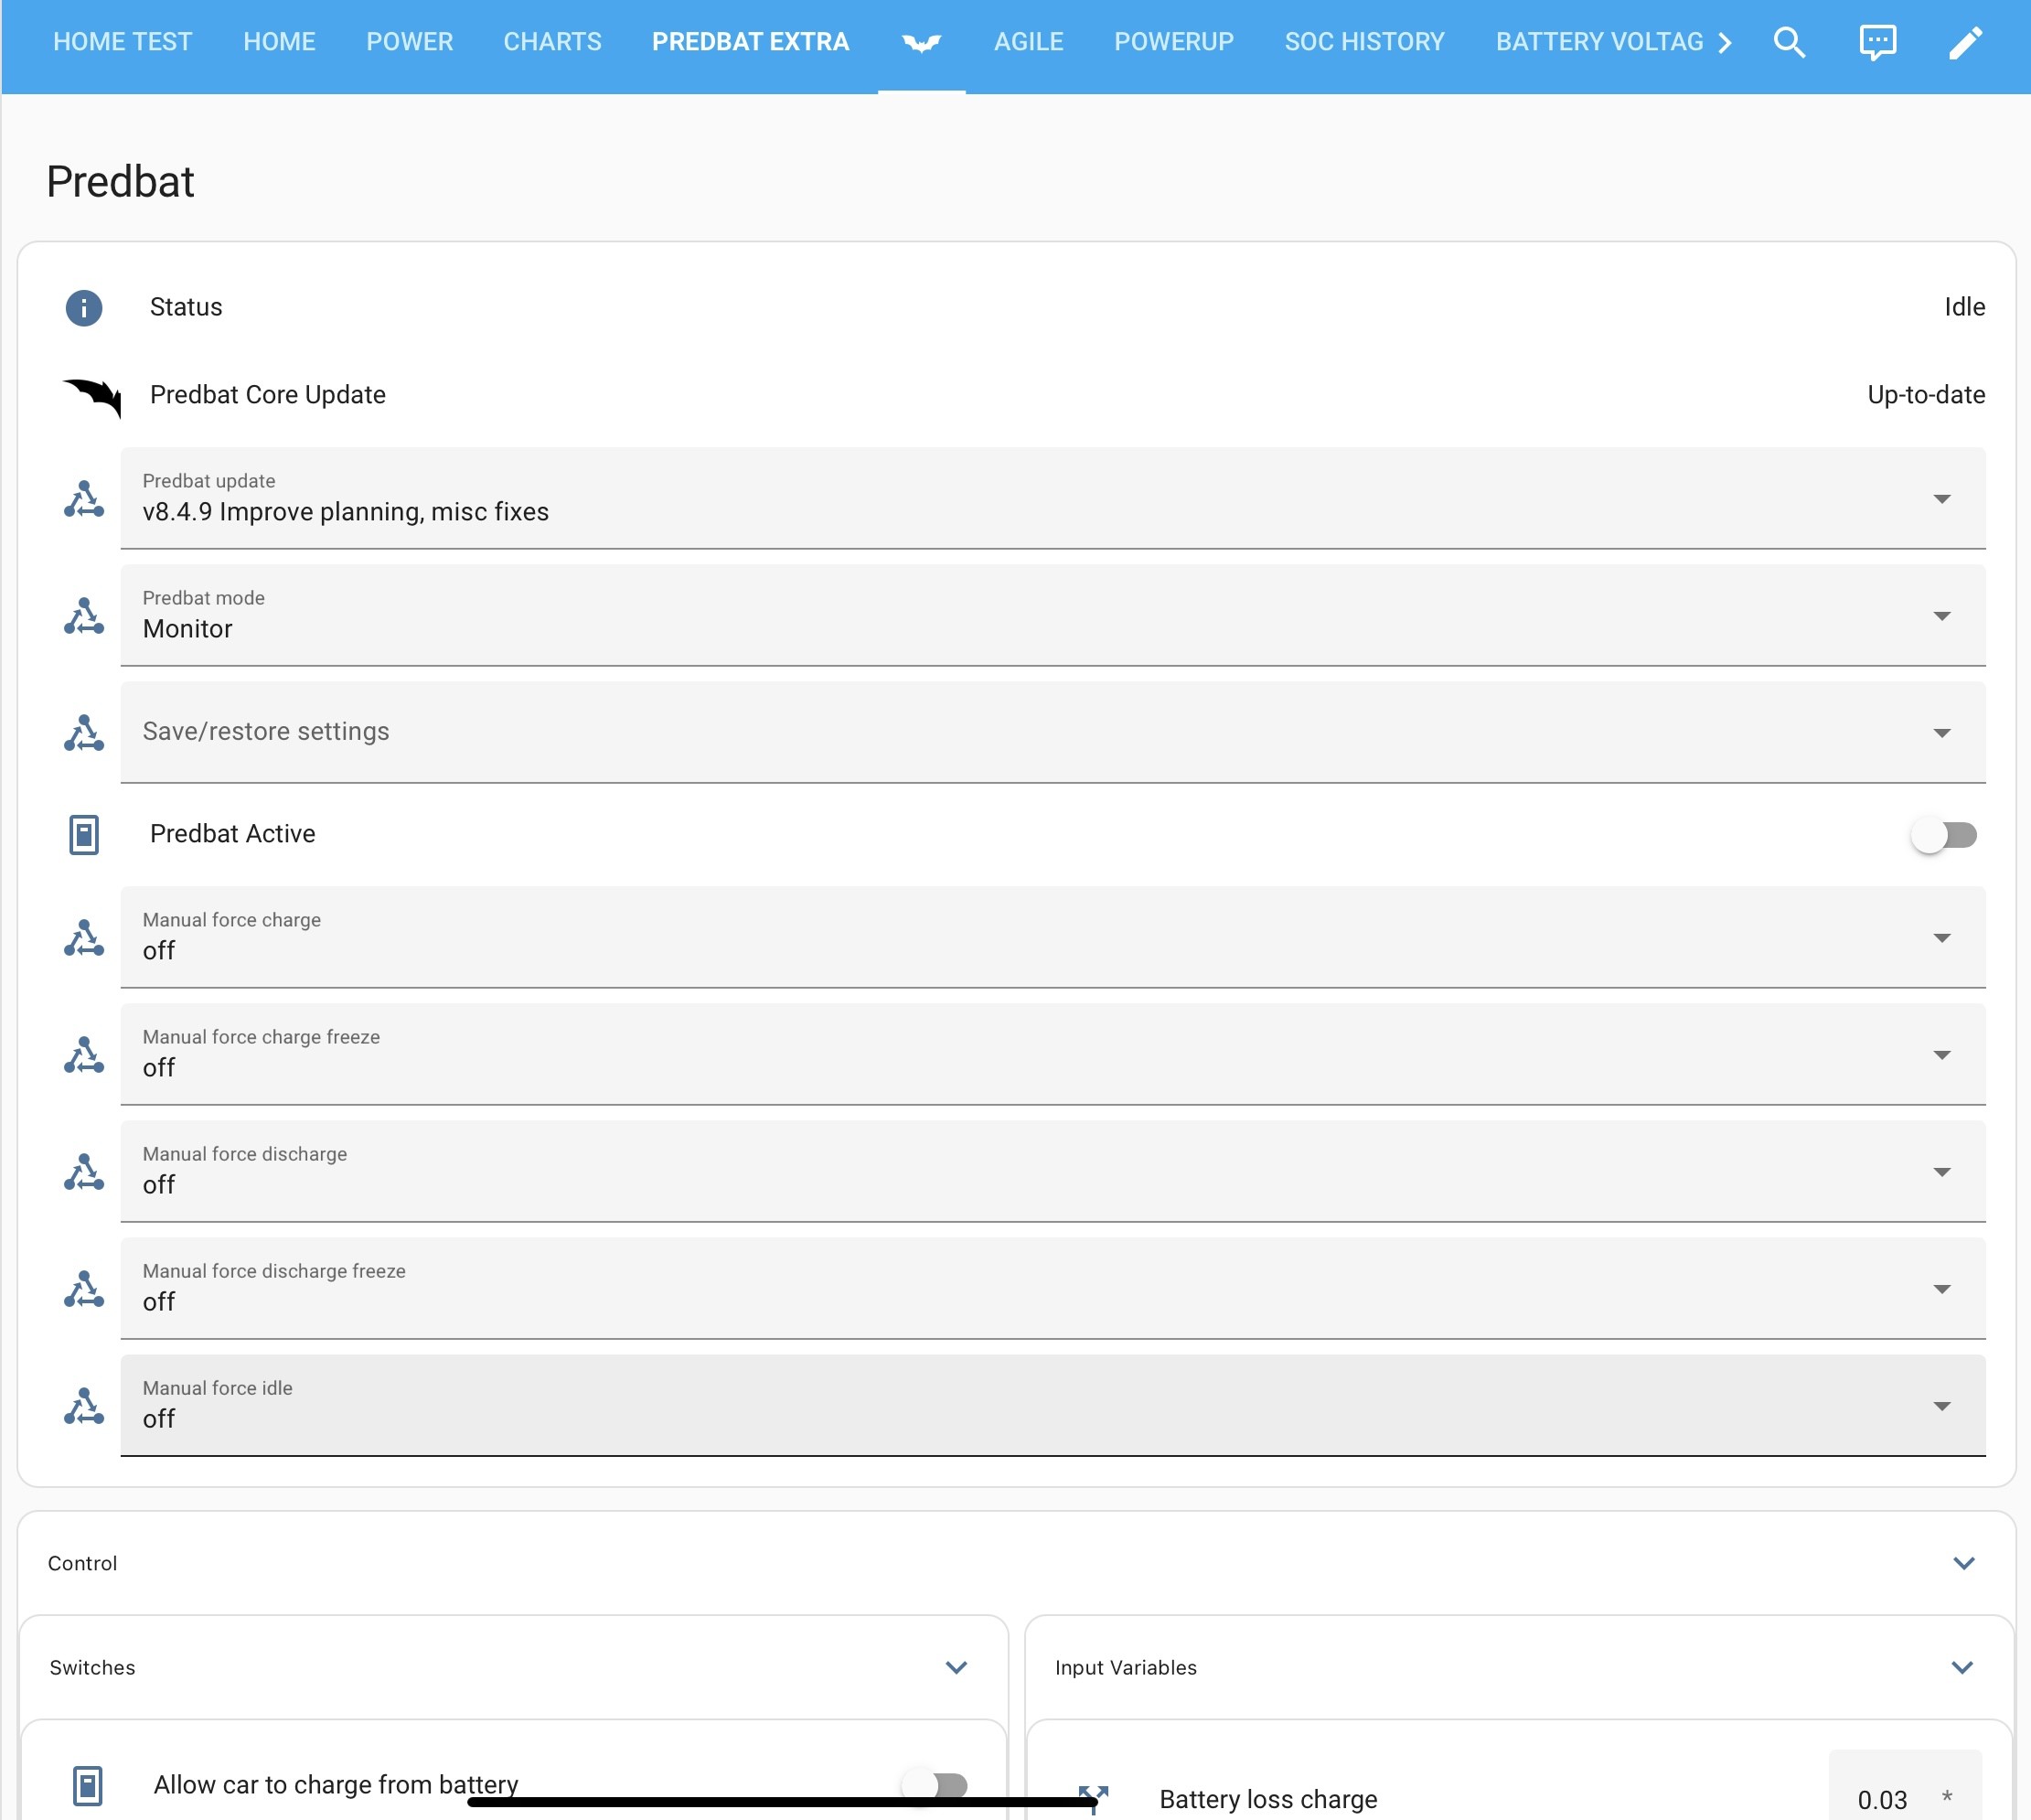
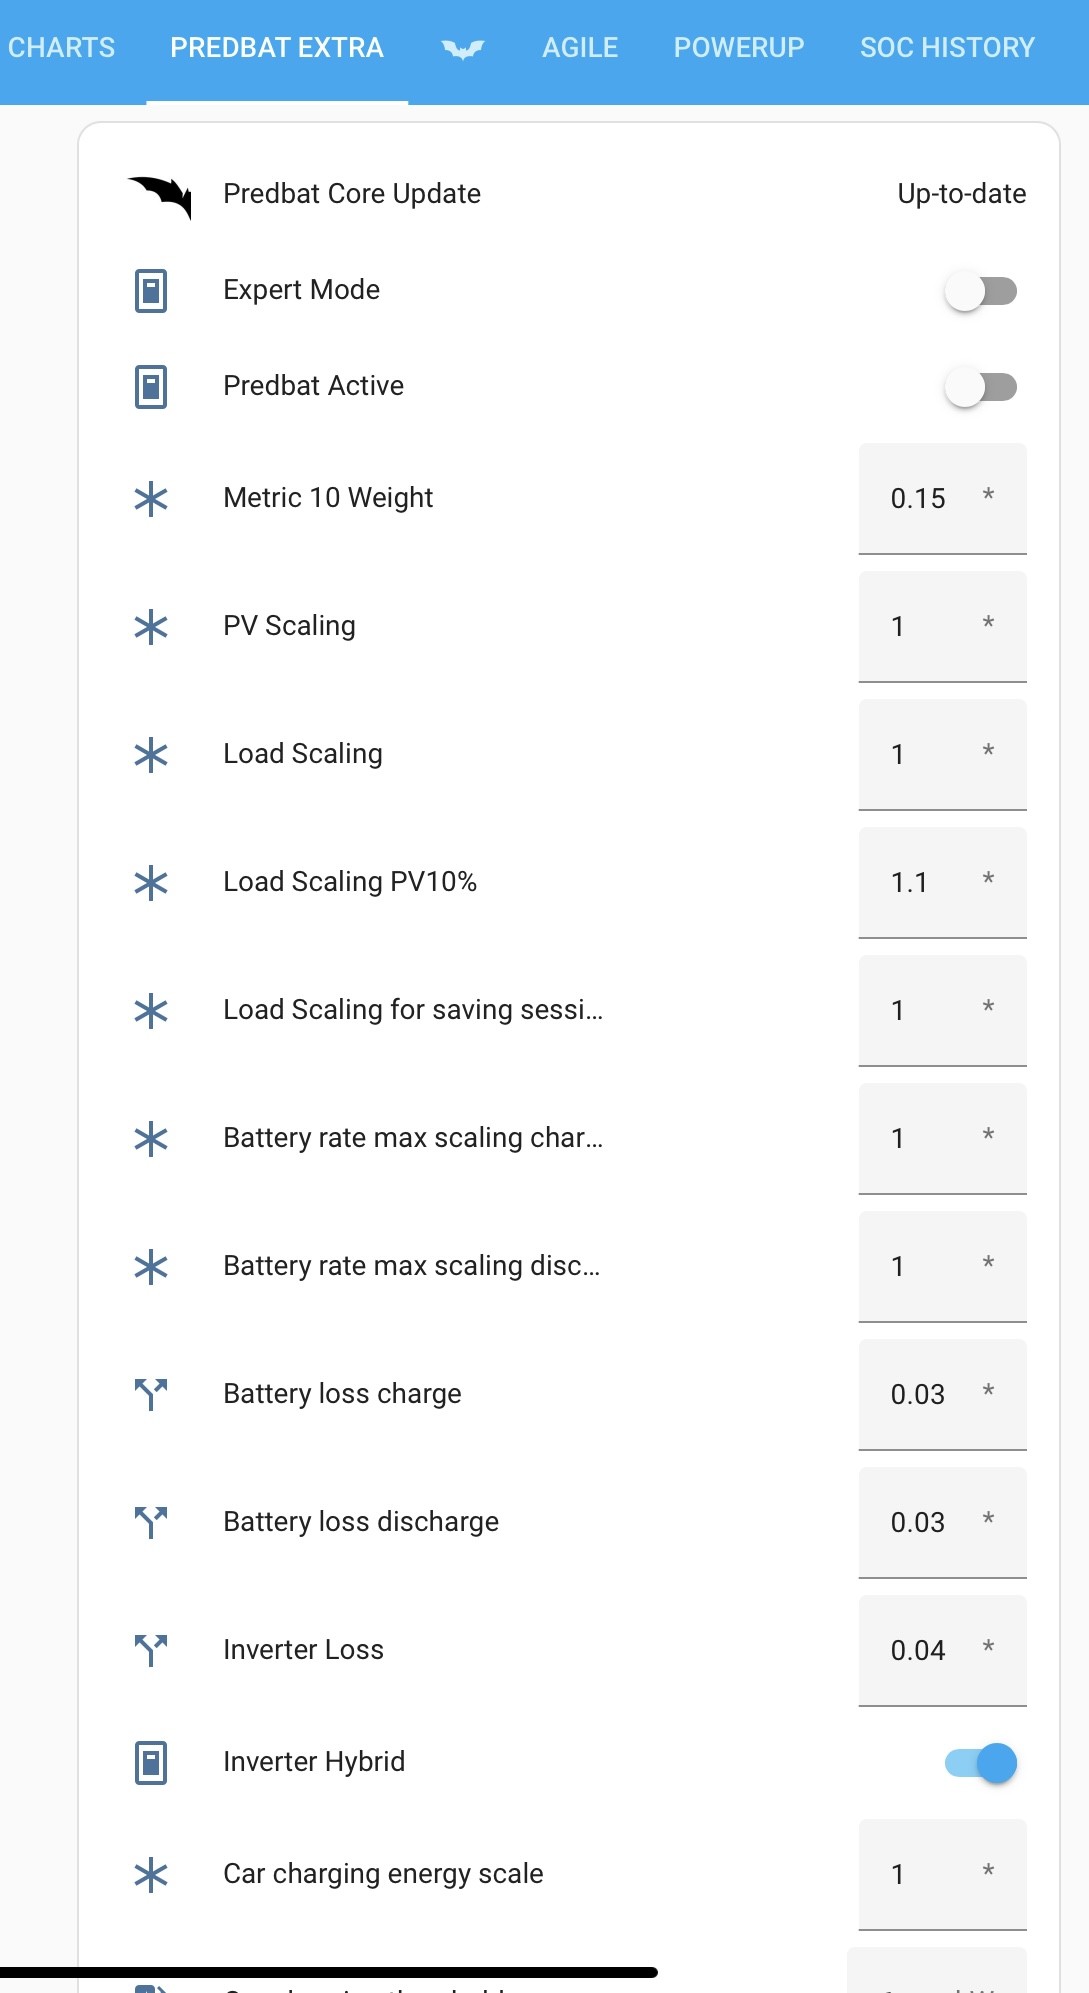
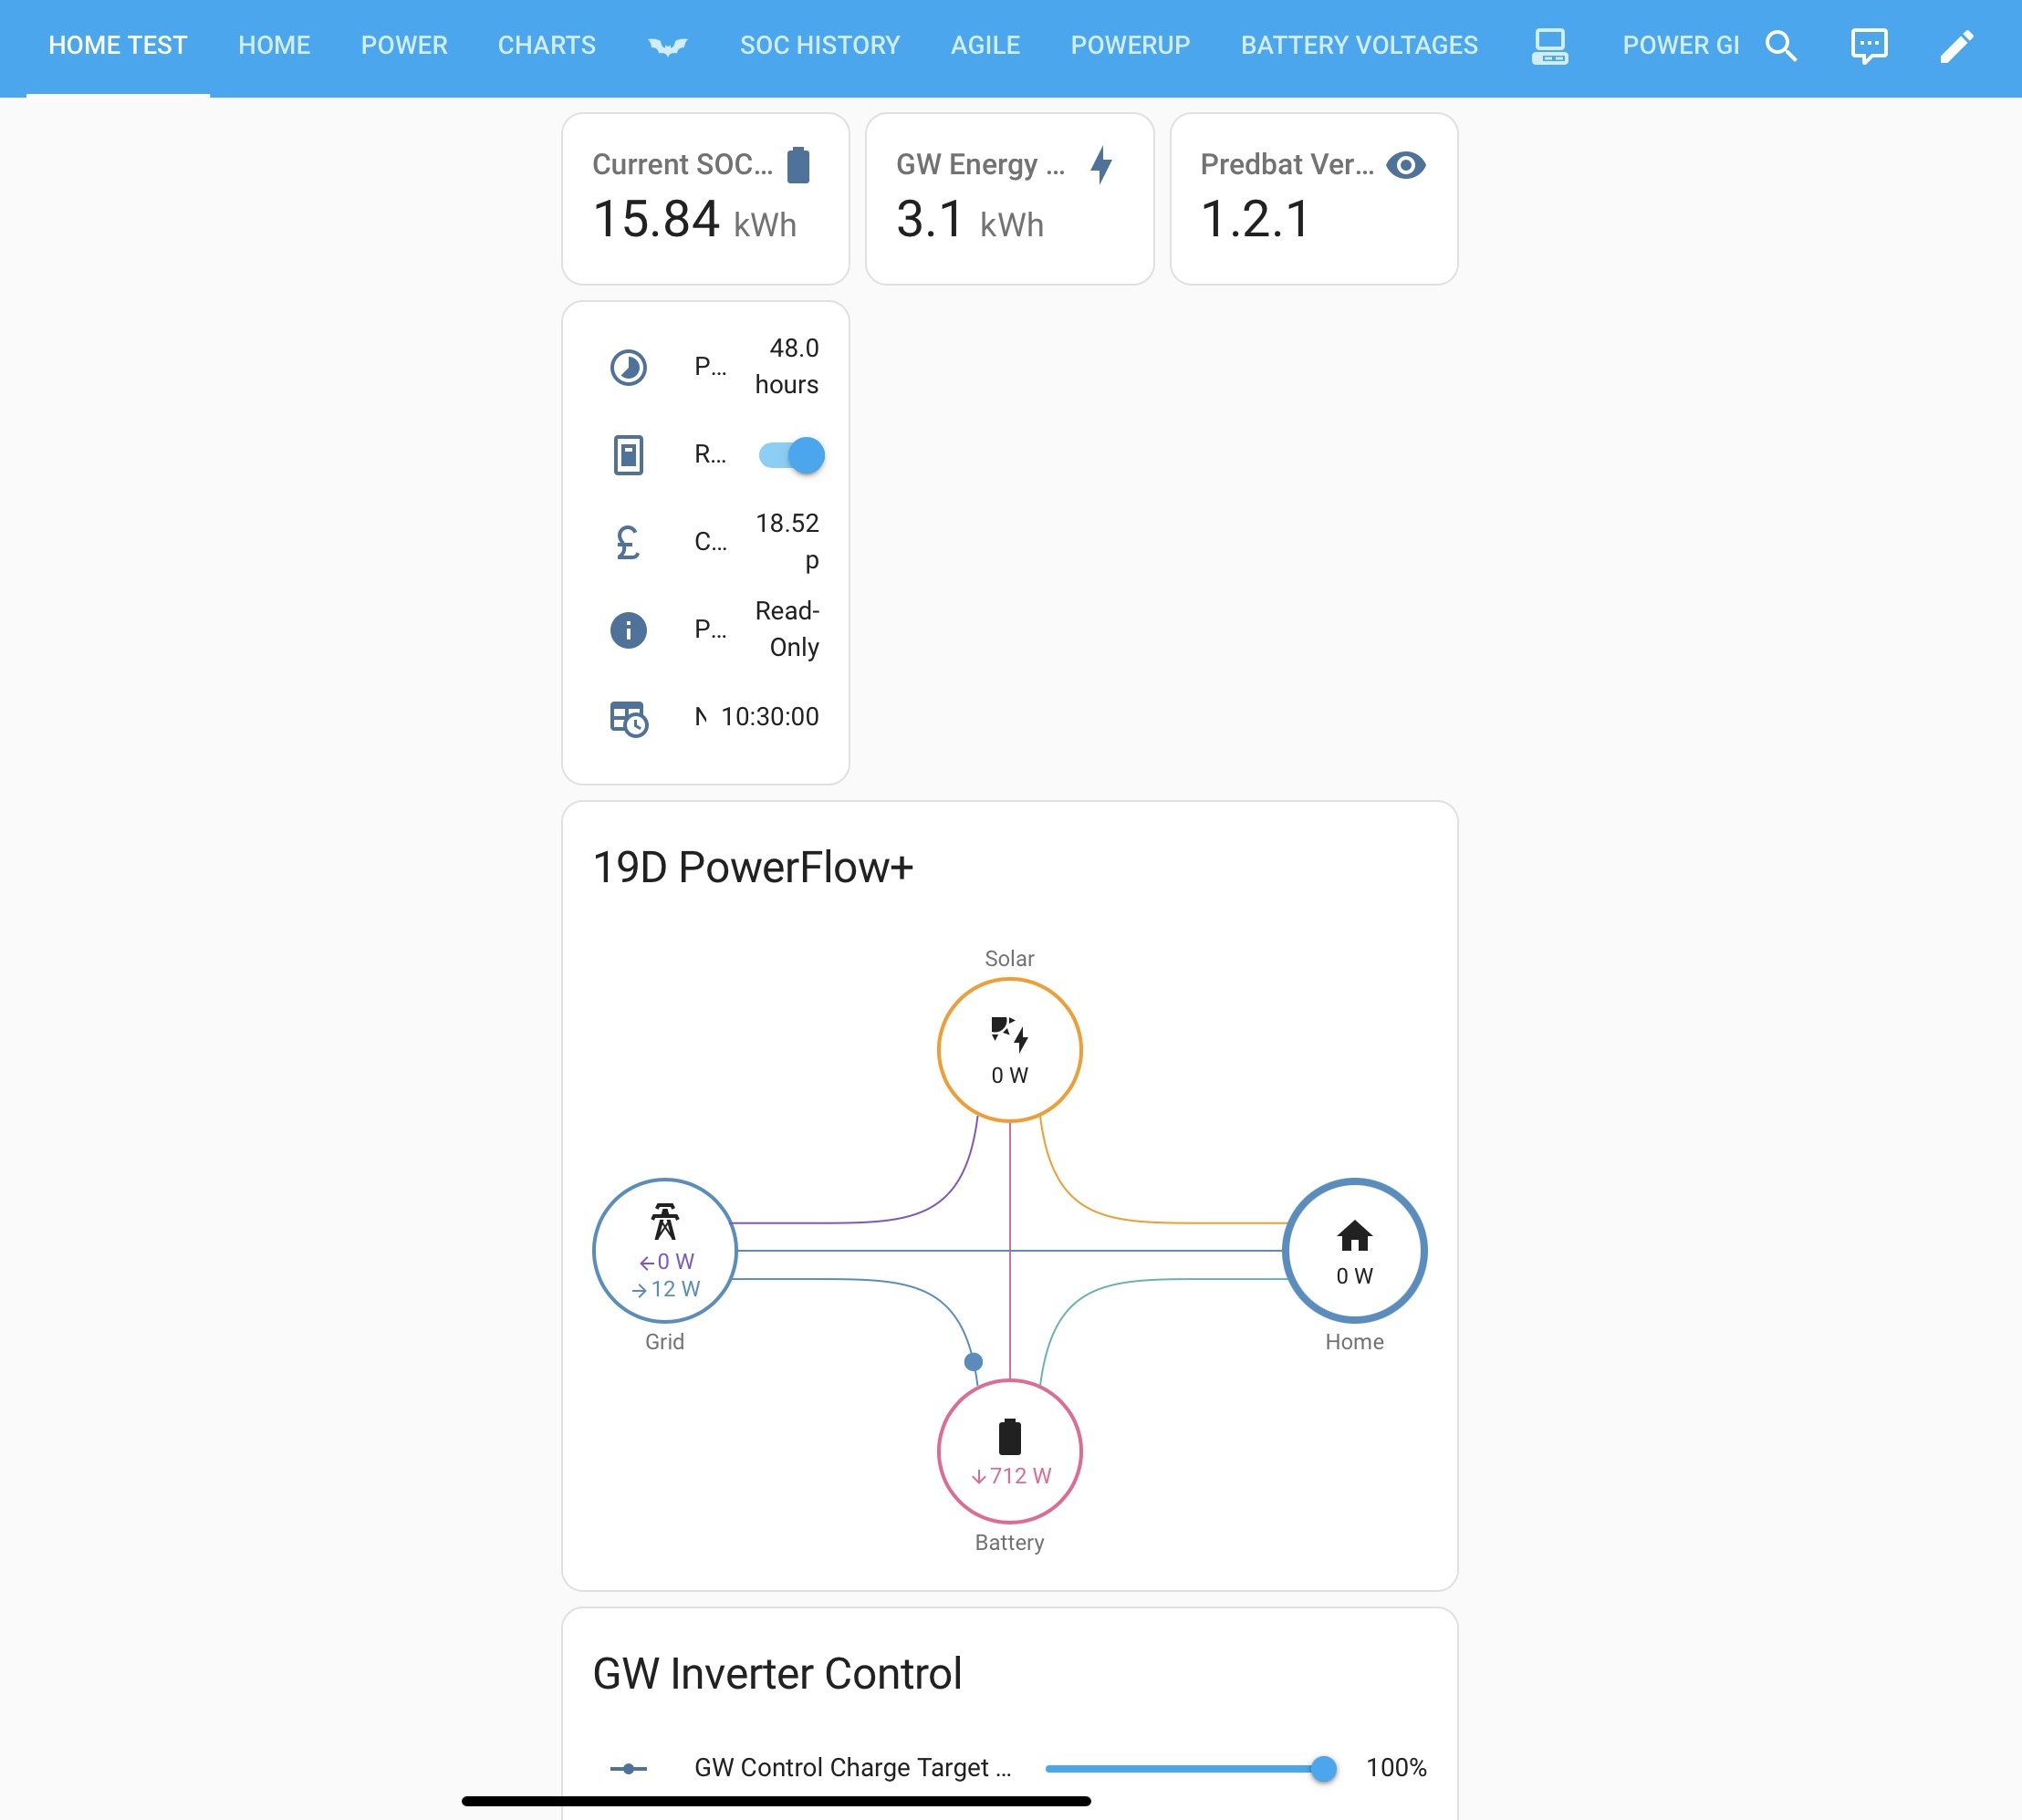
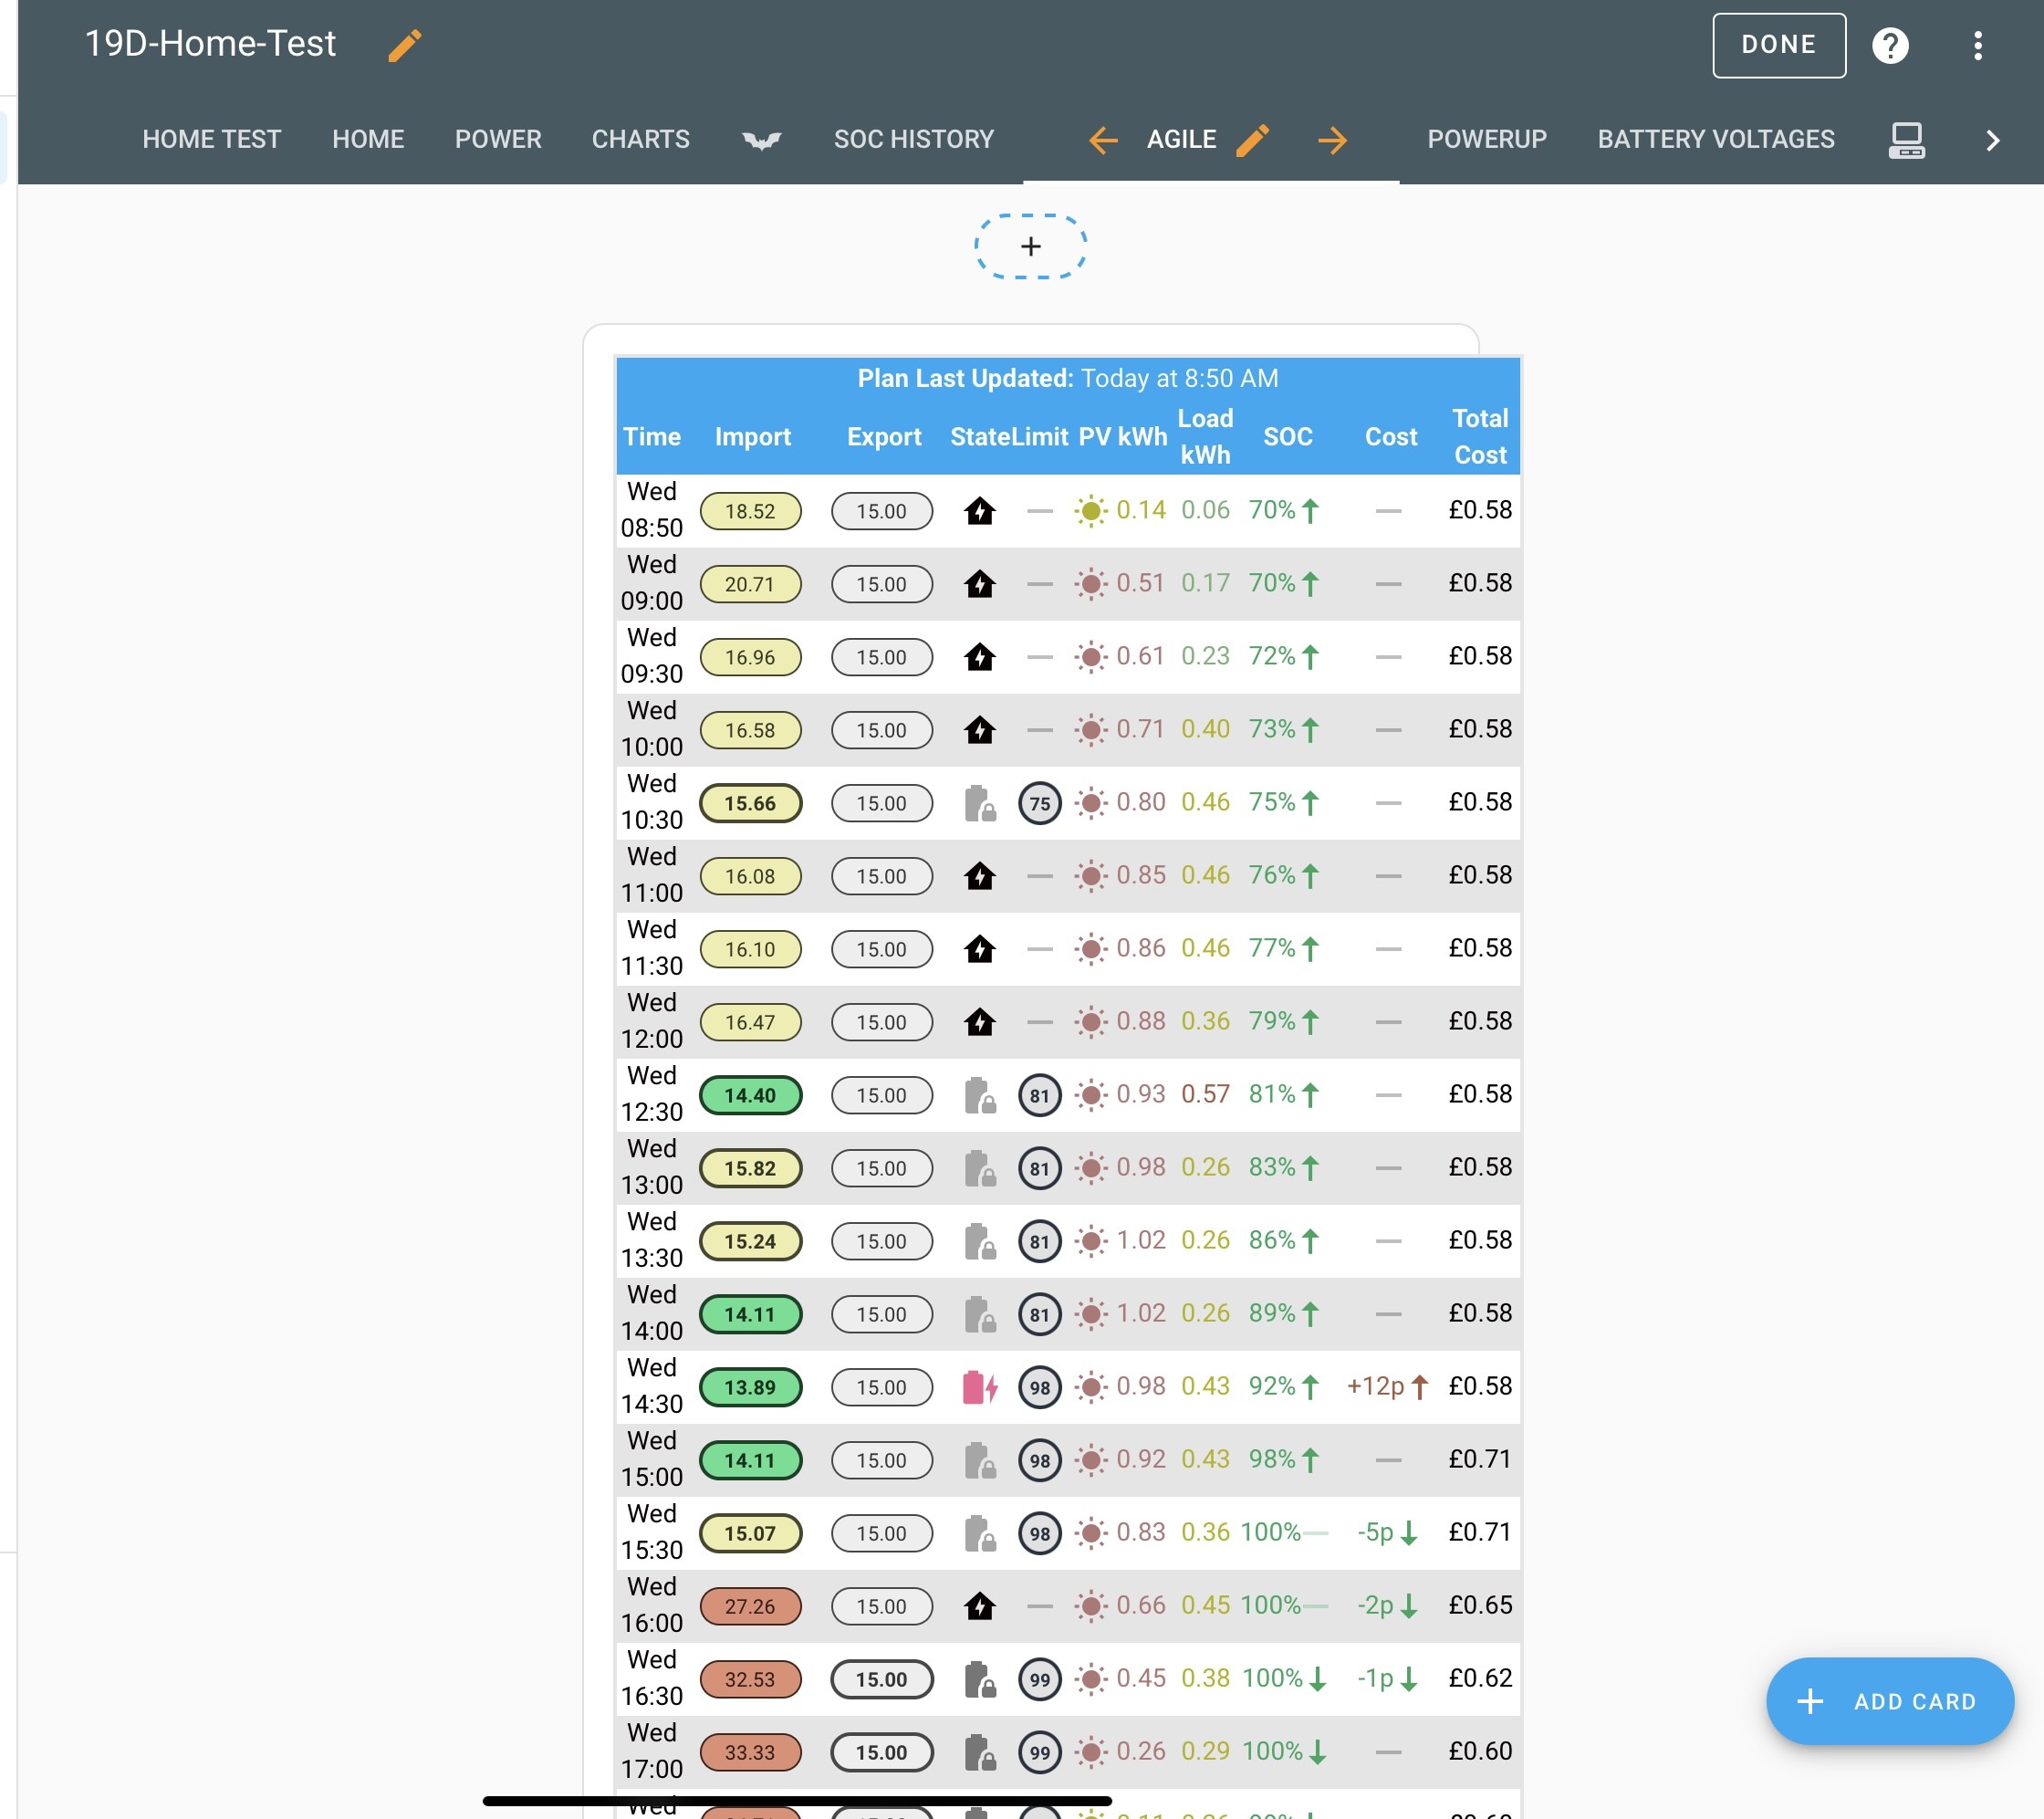
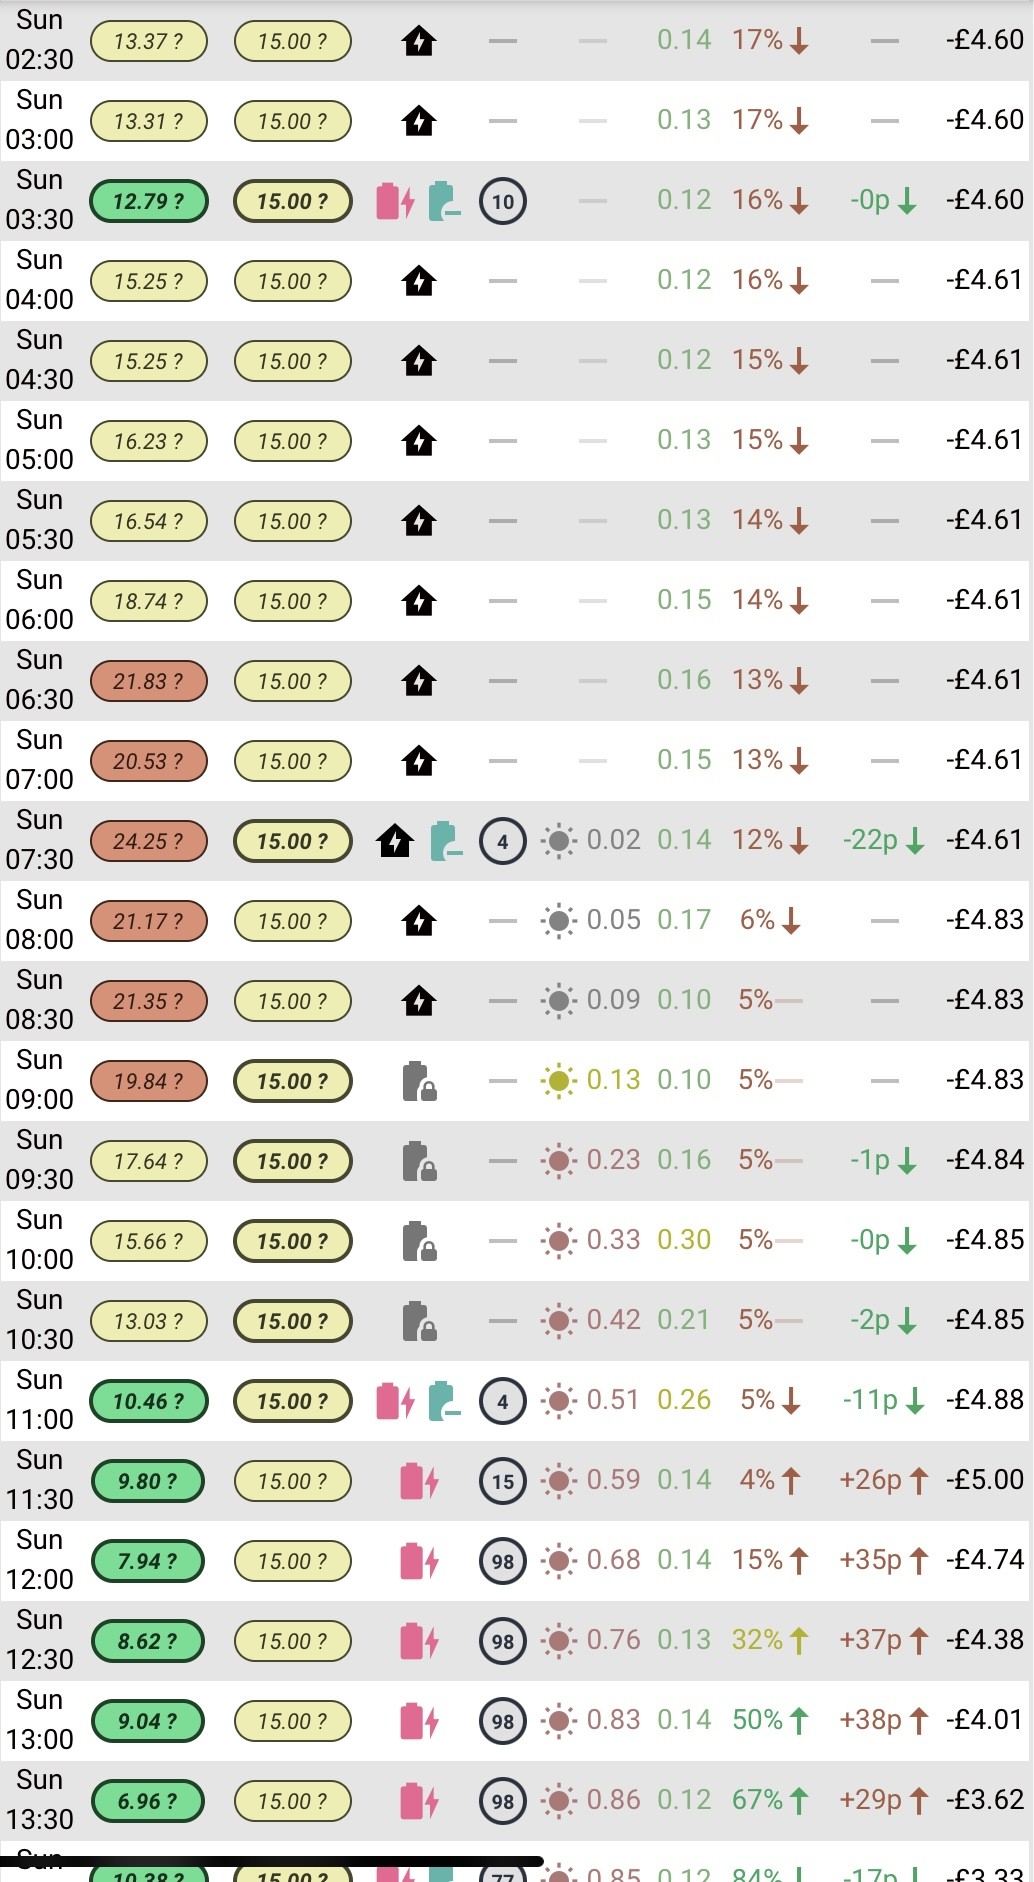
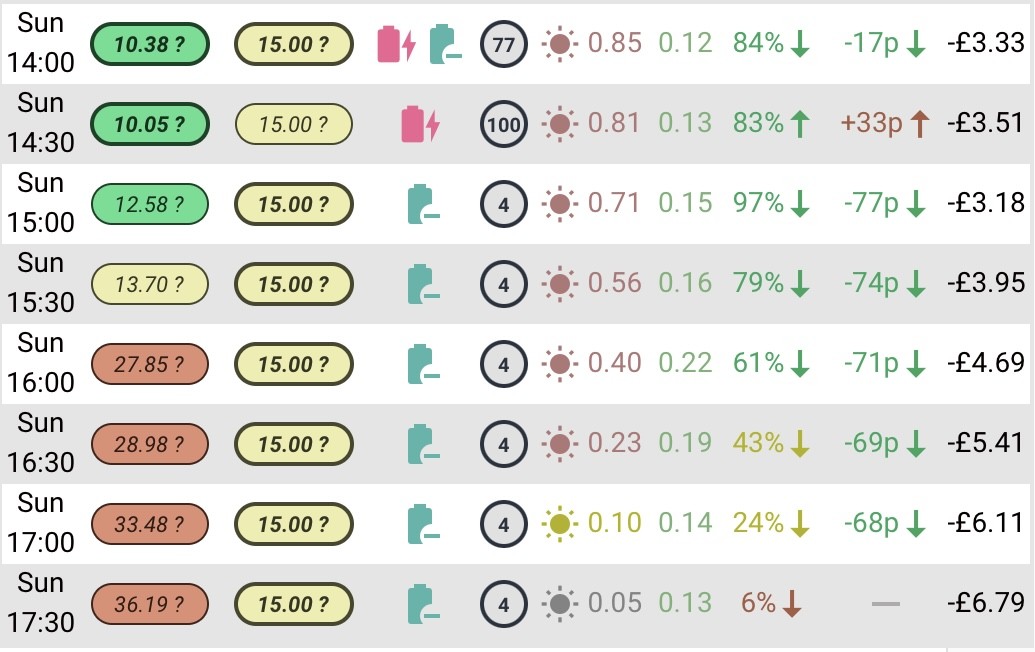
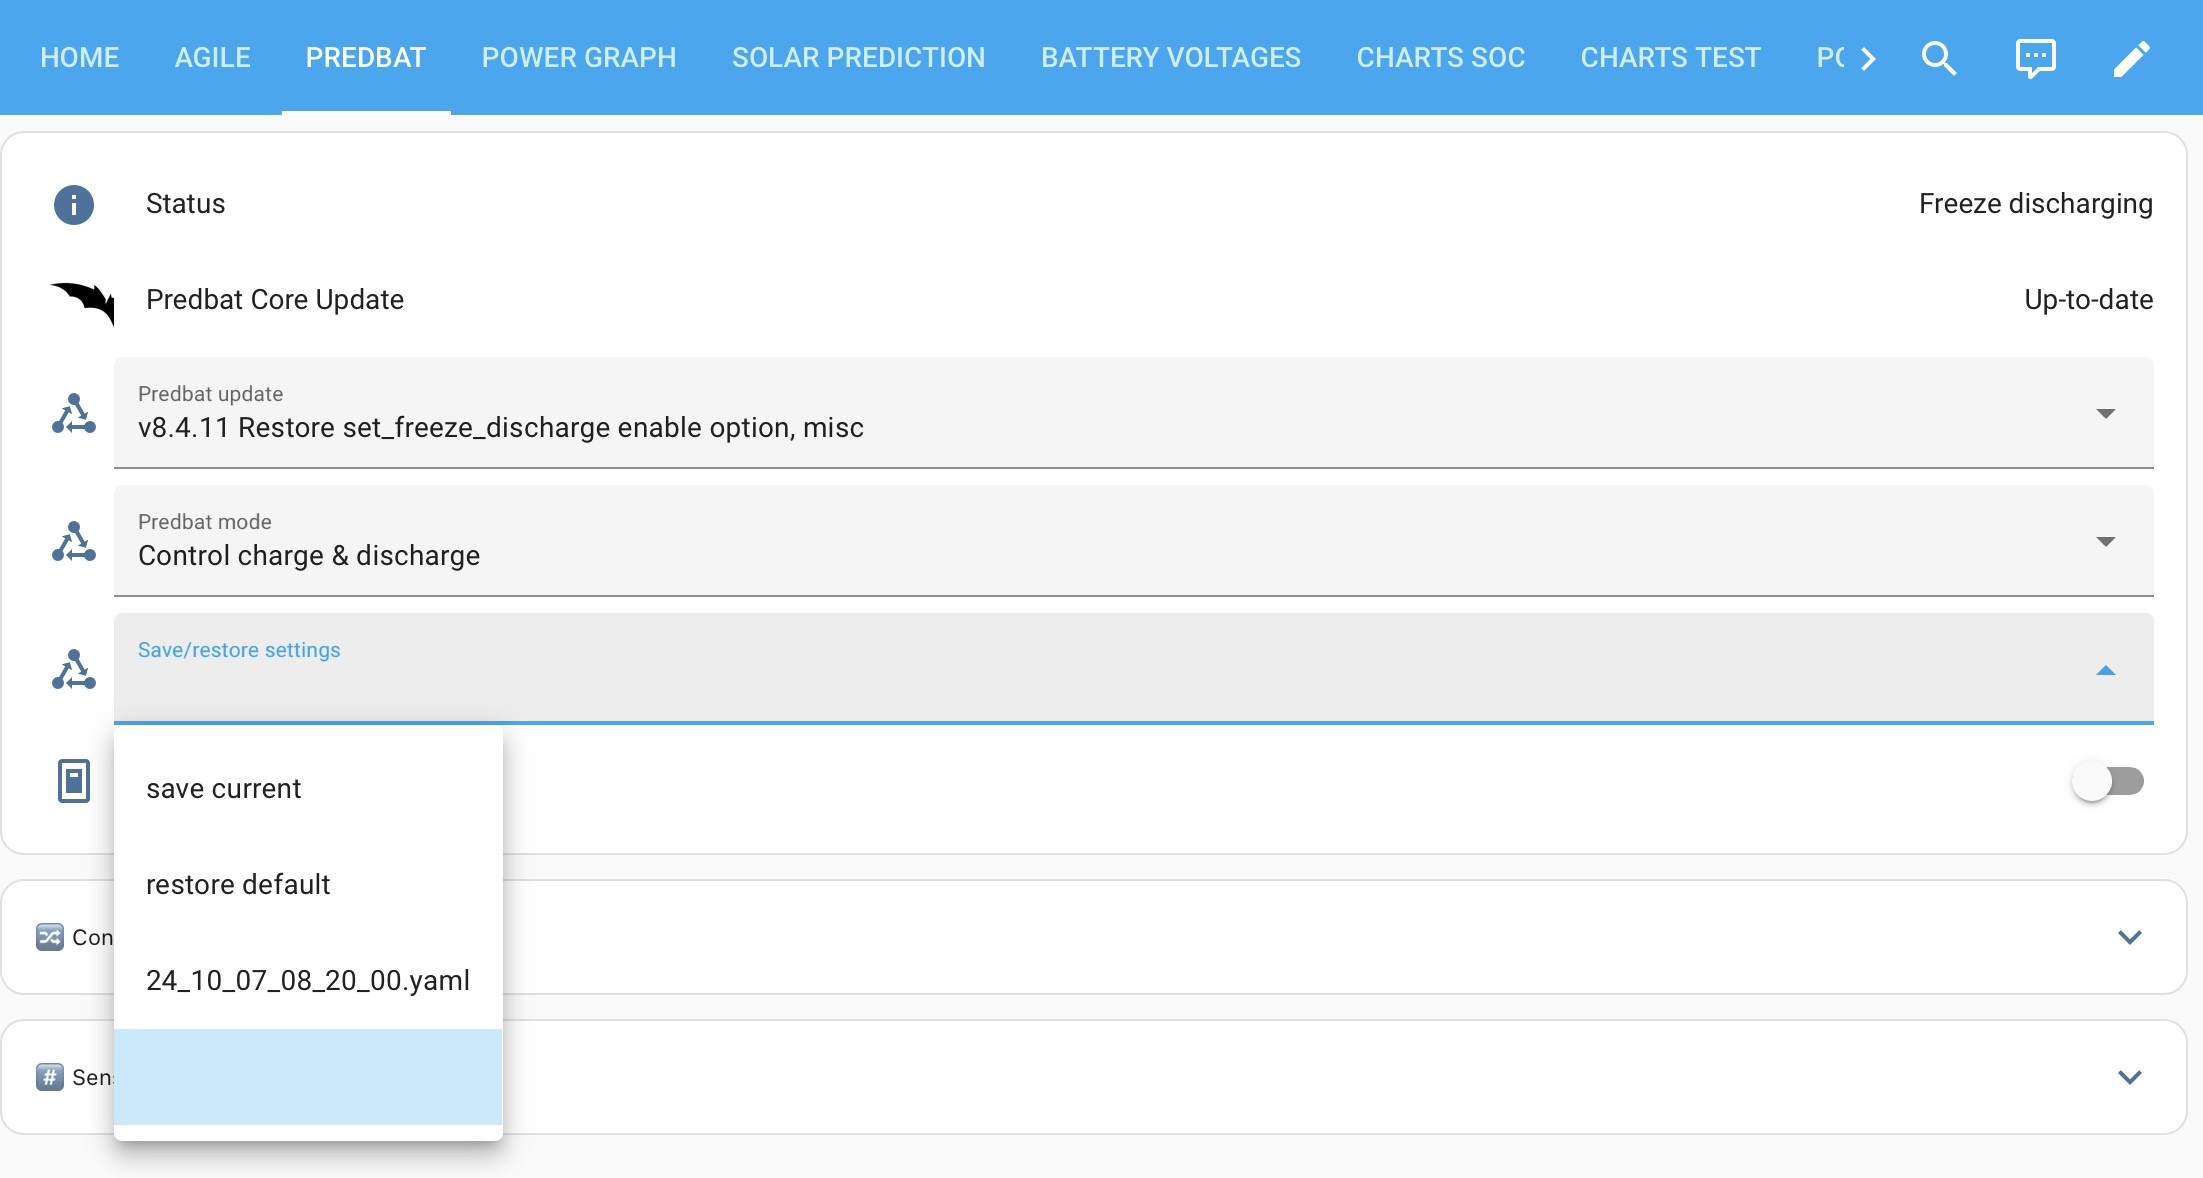
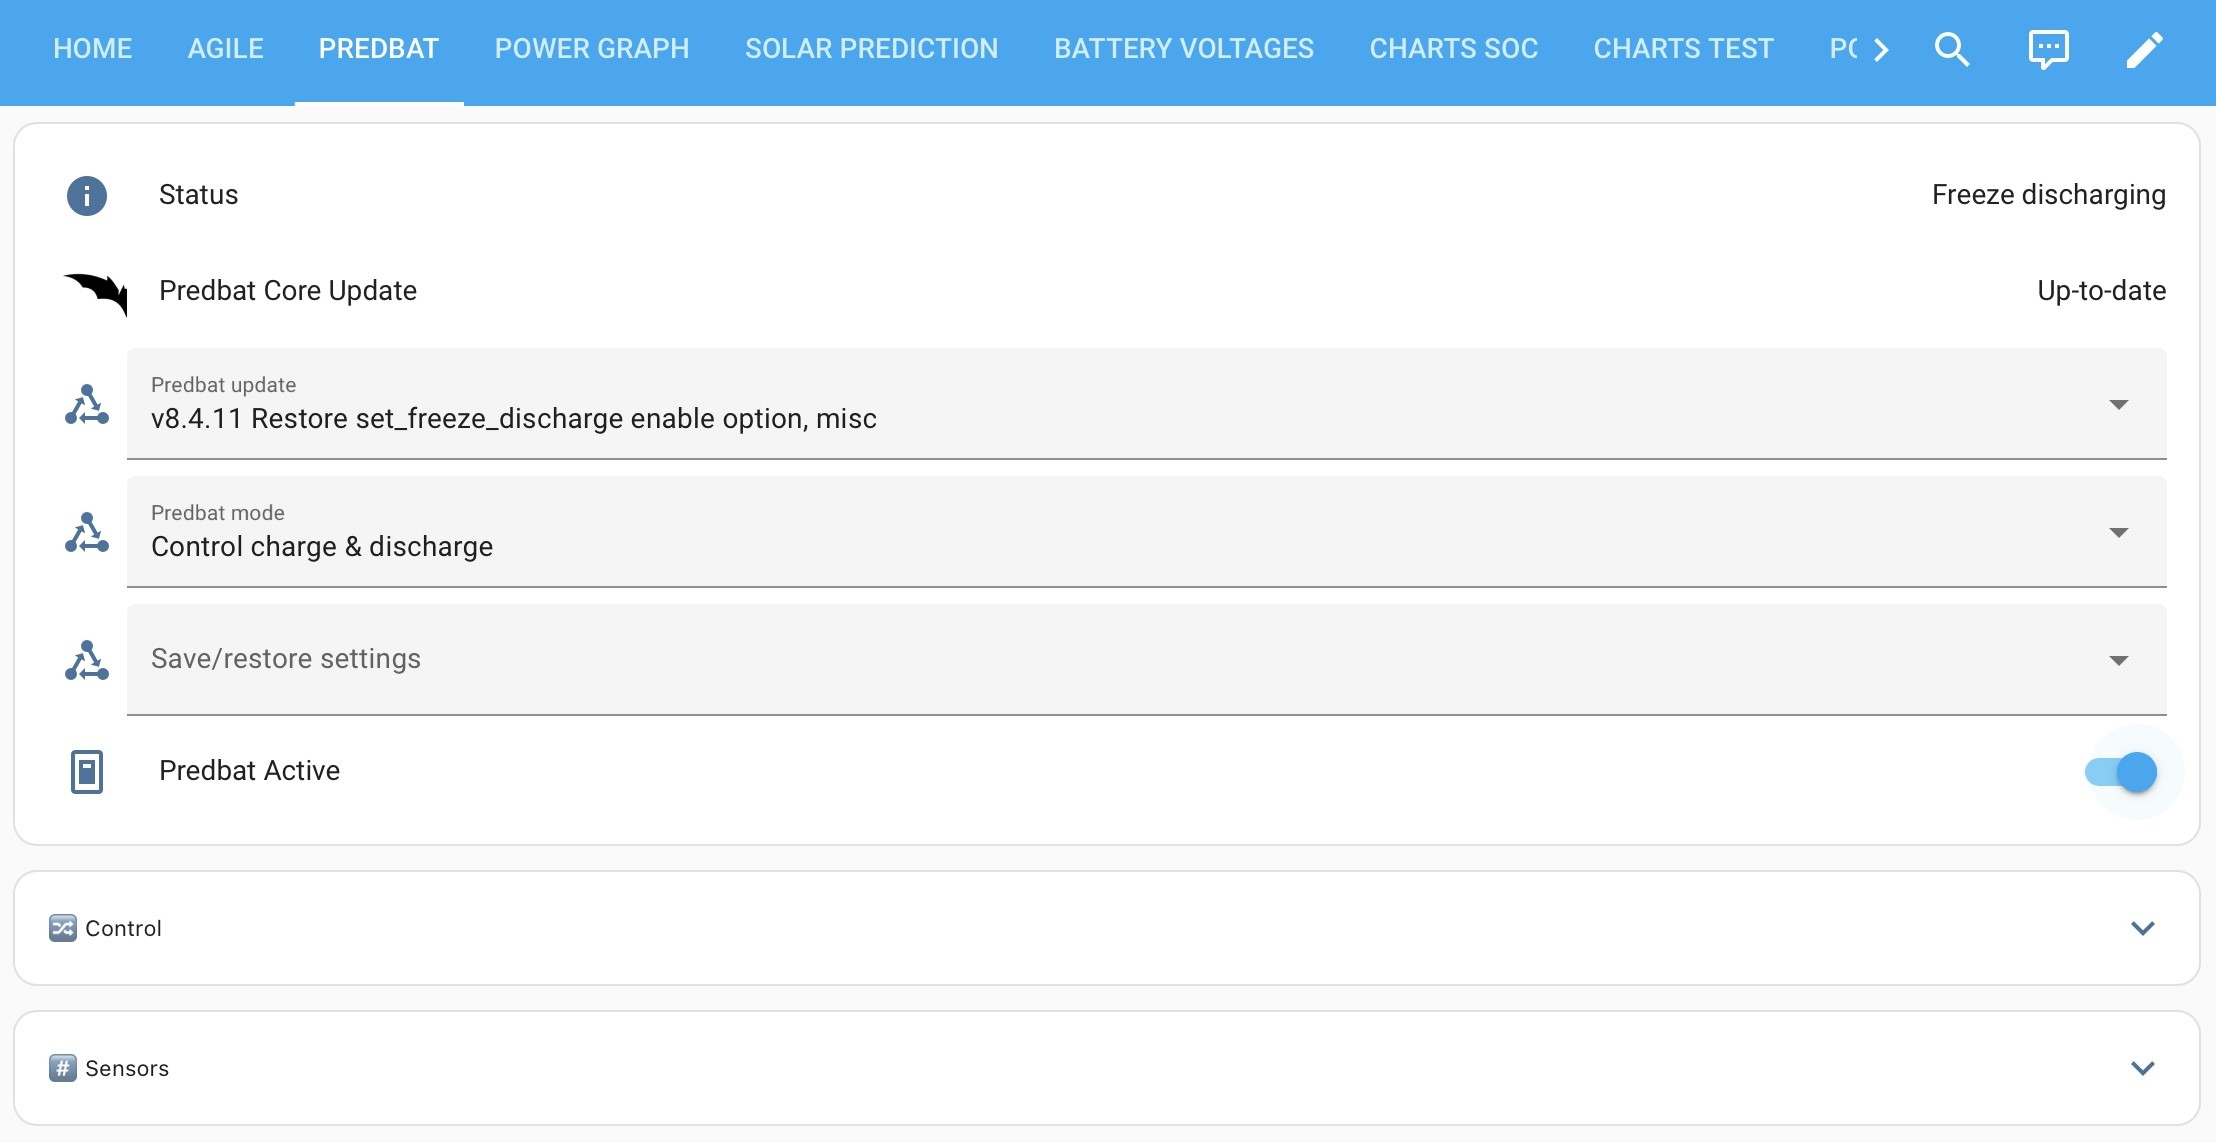
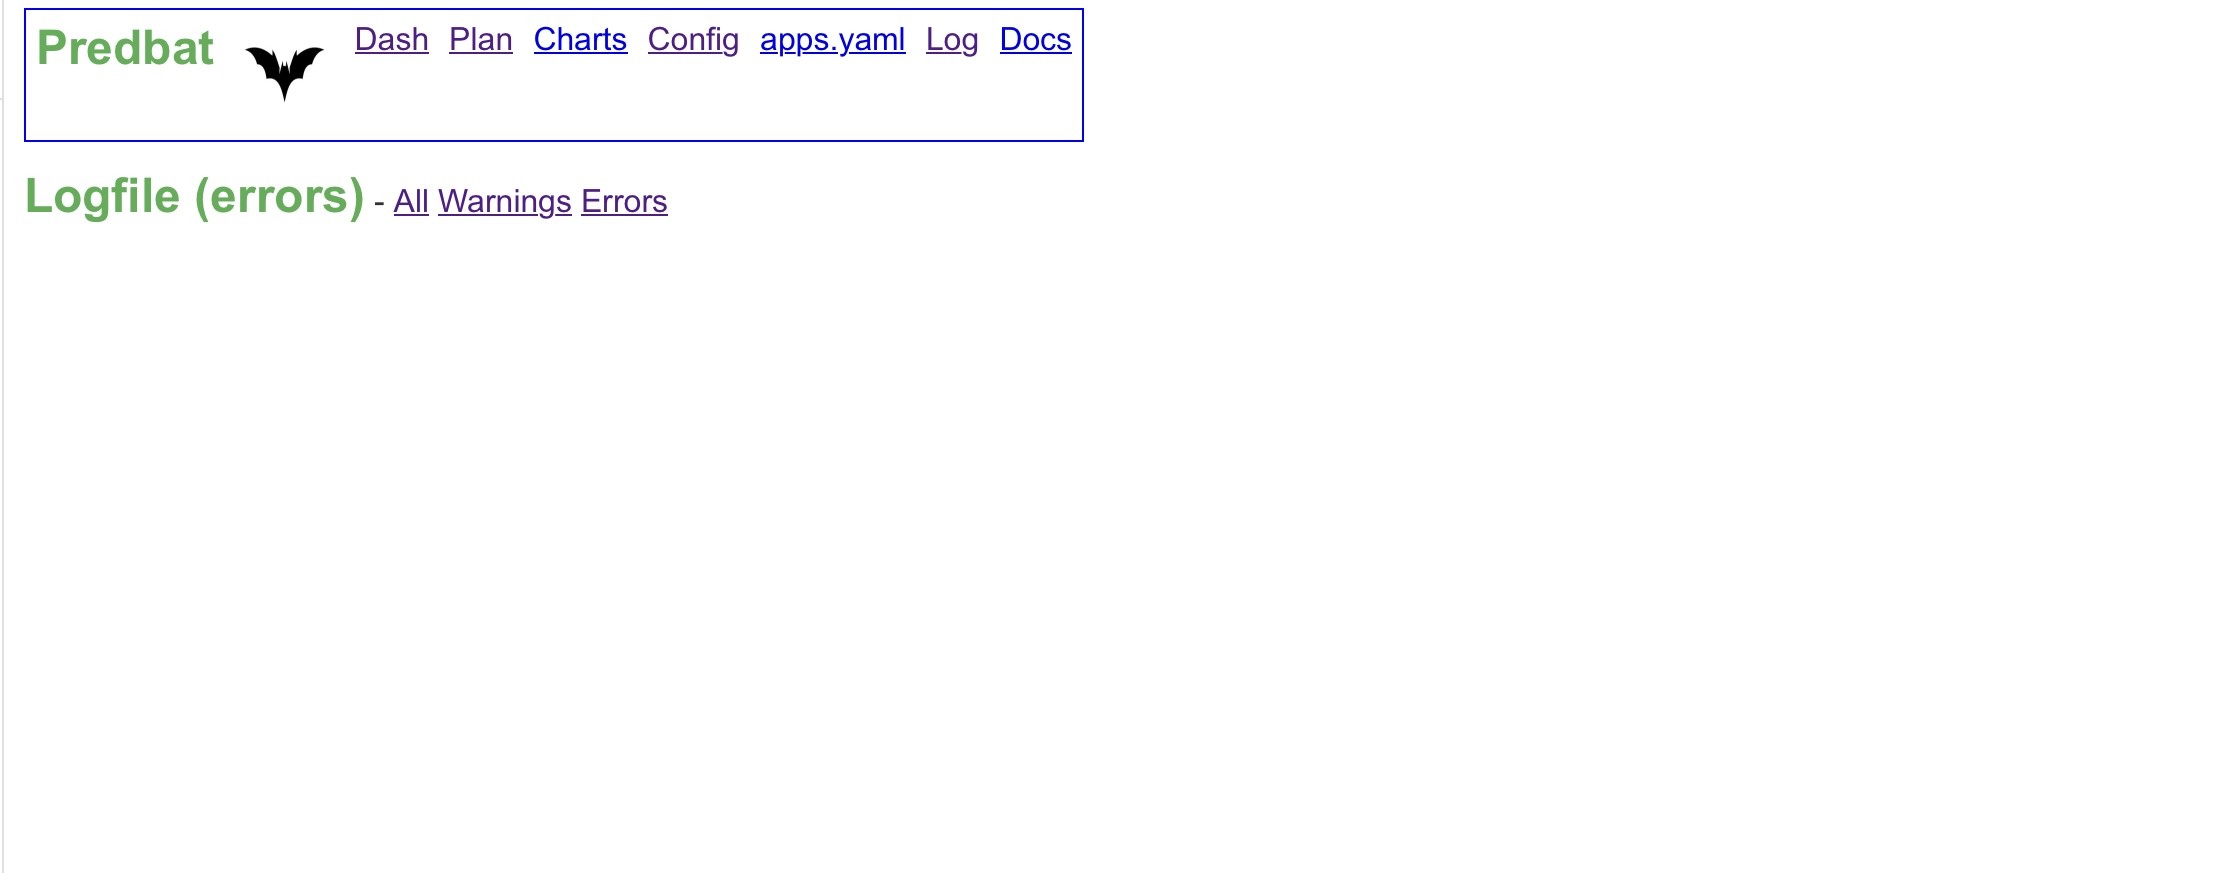
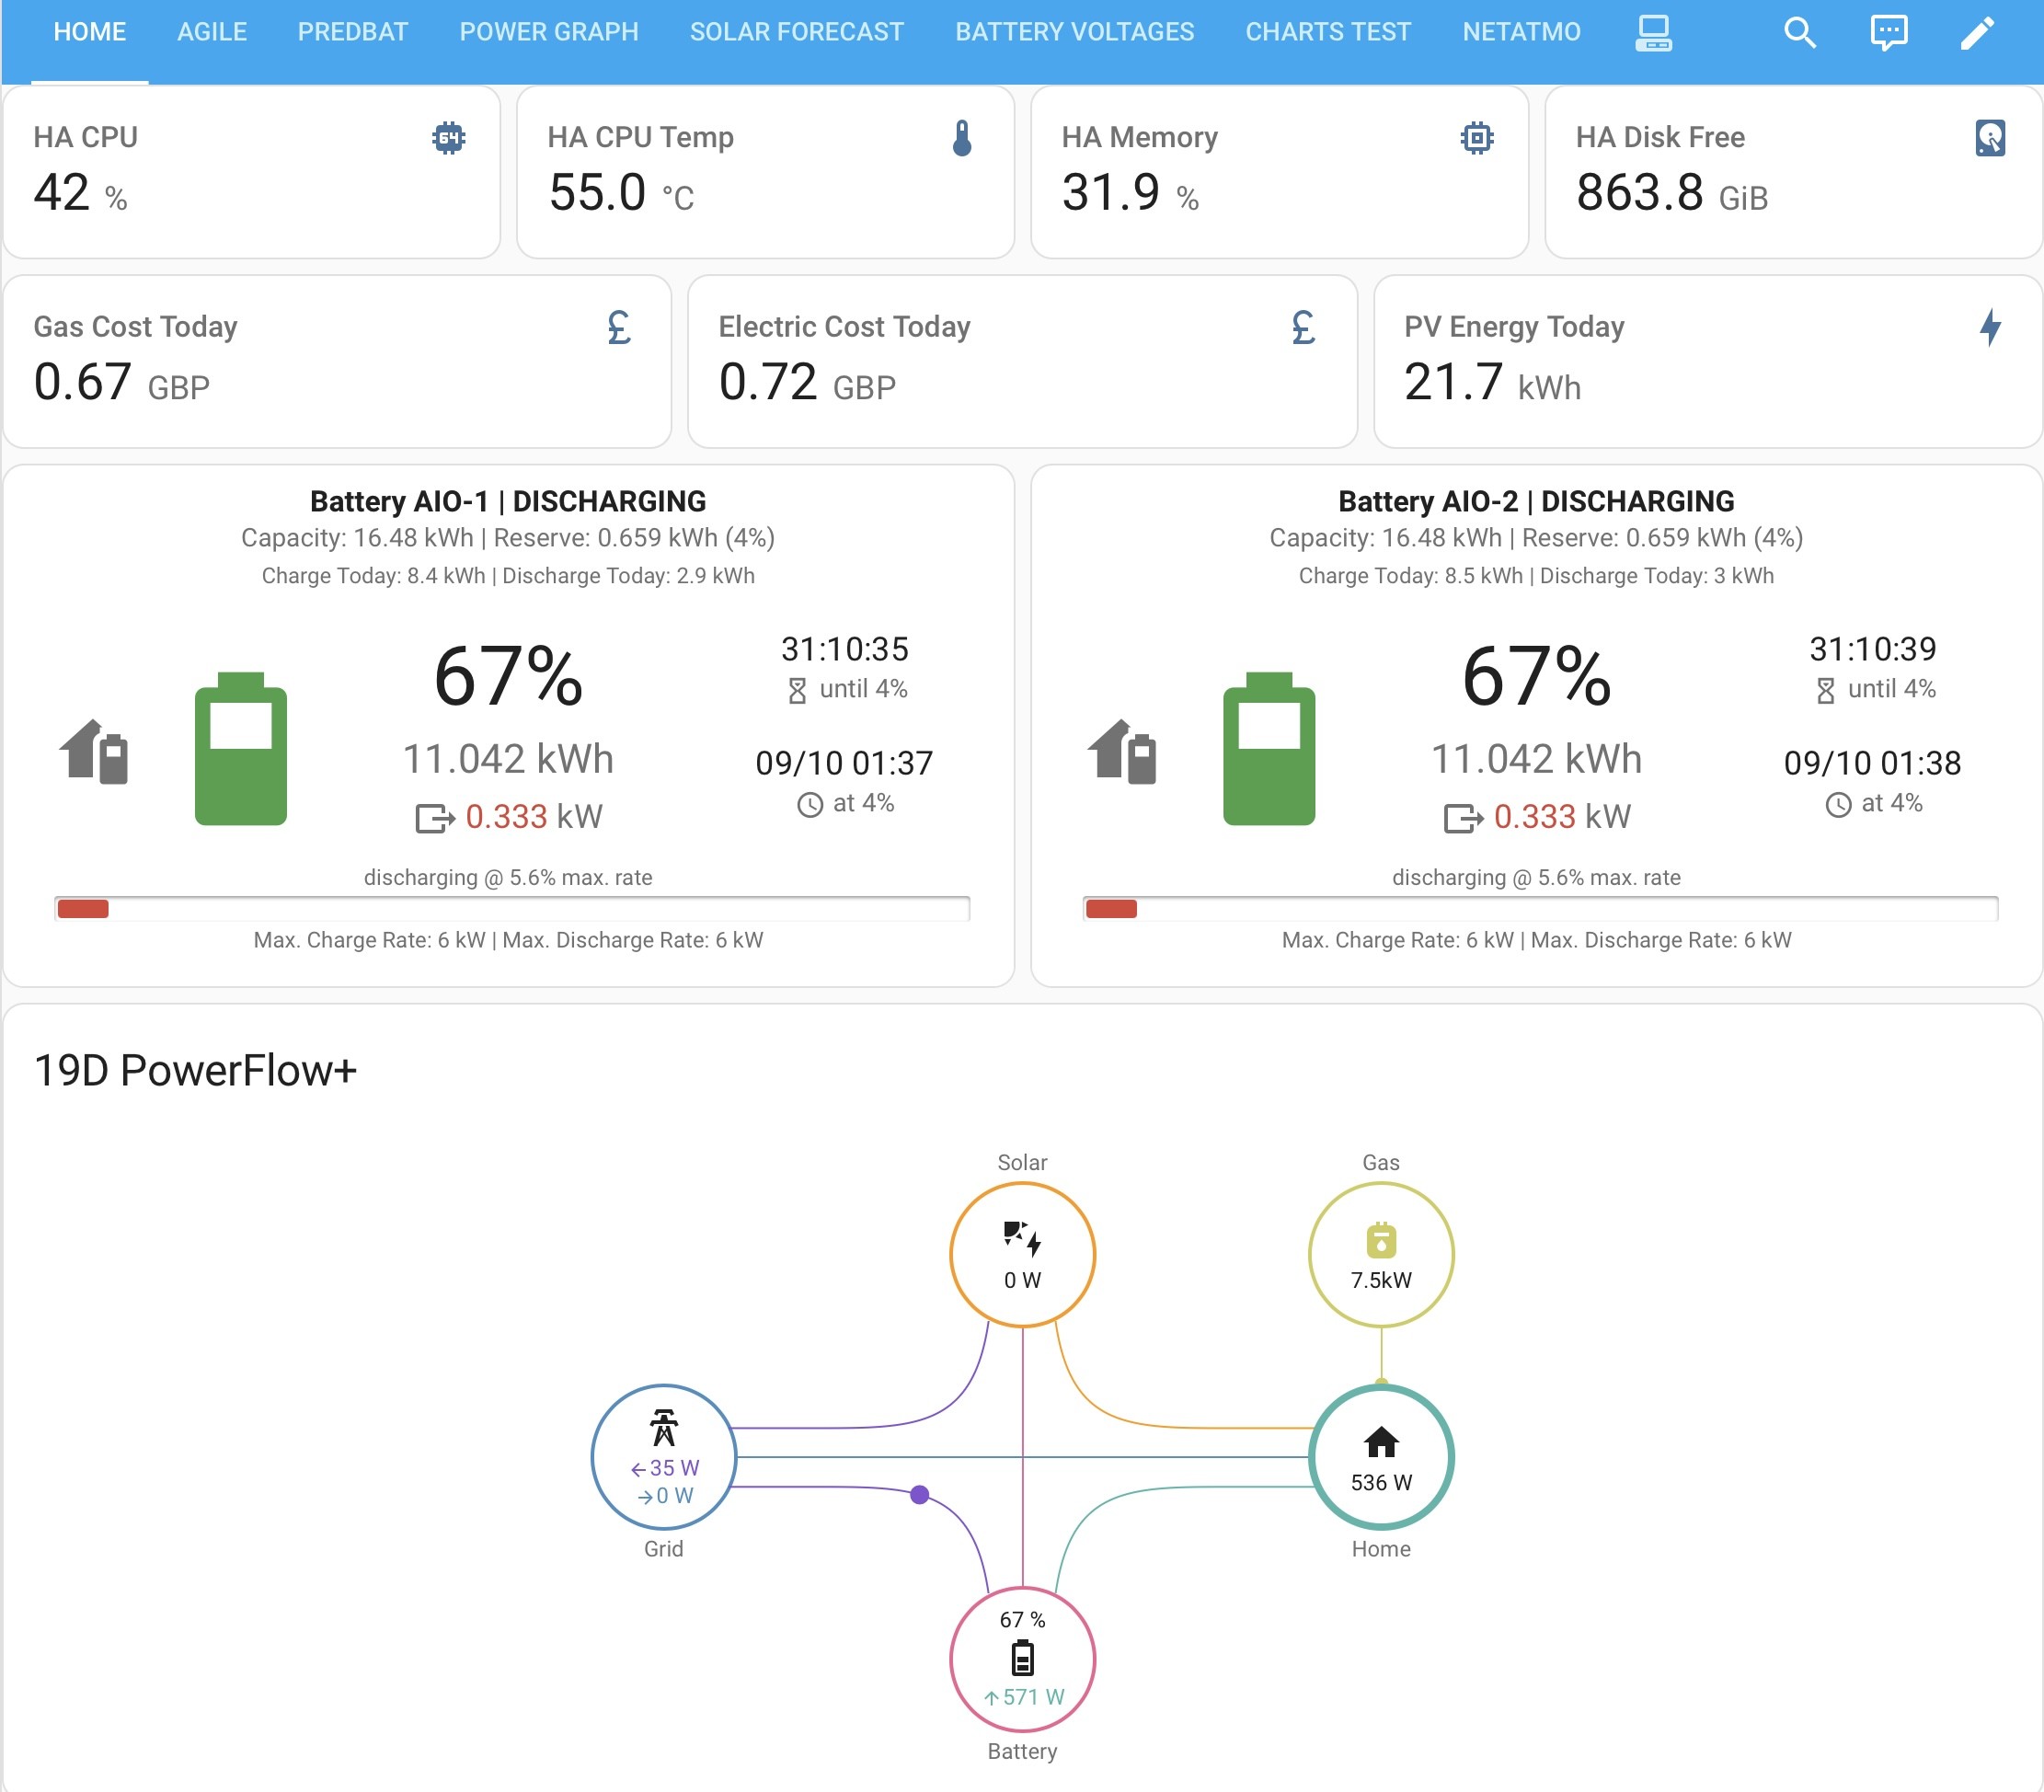
Here is a screen shot of Predbat after install (from where this post starts).

D
#2 Daveb01

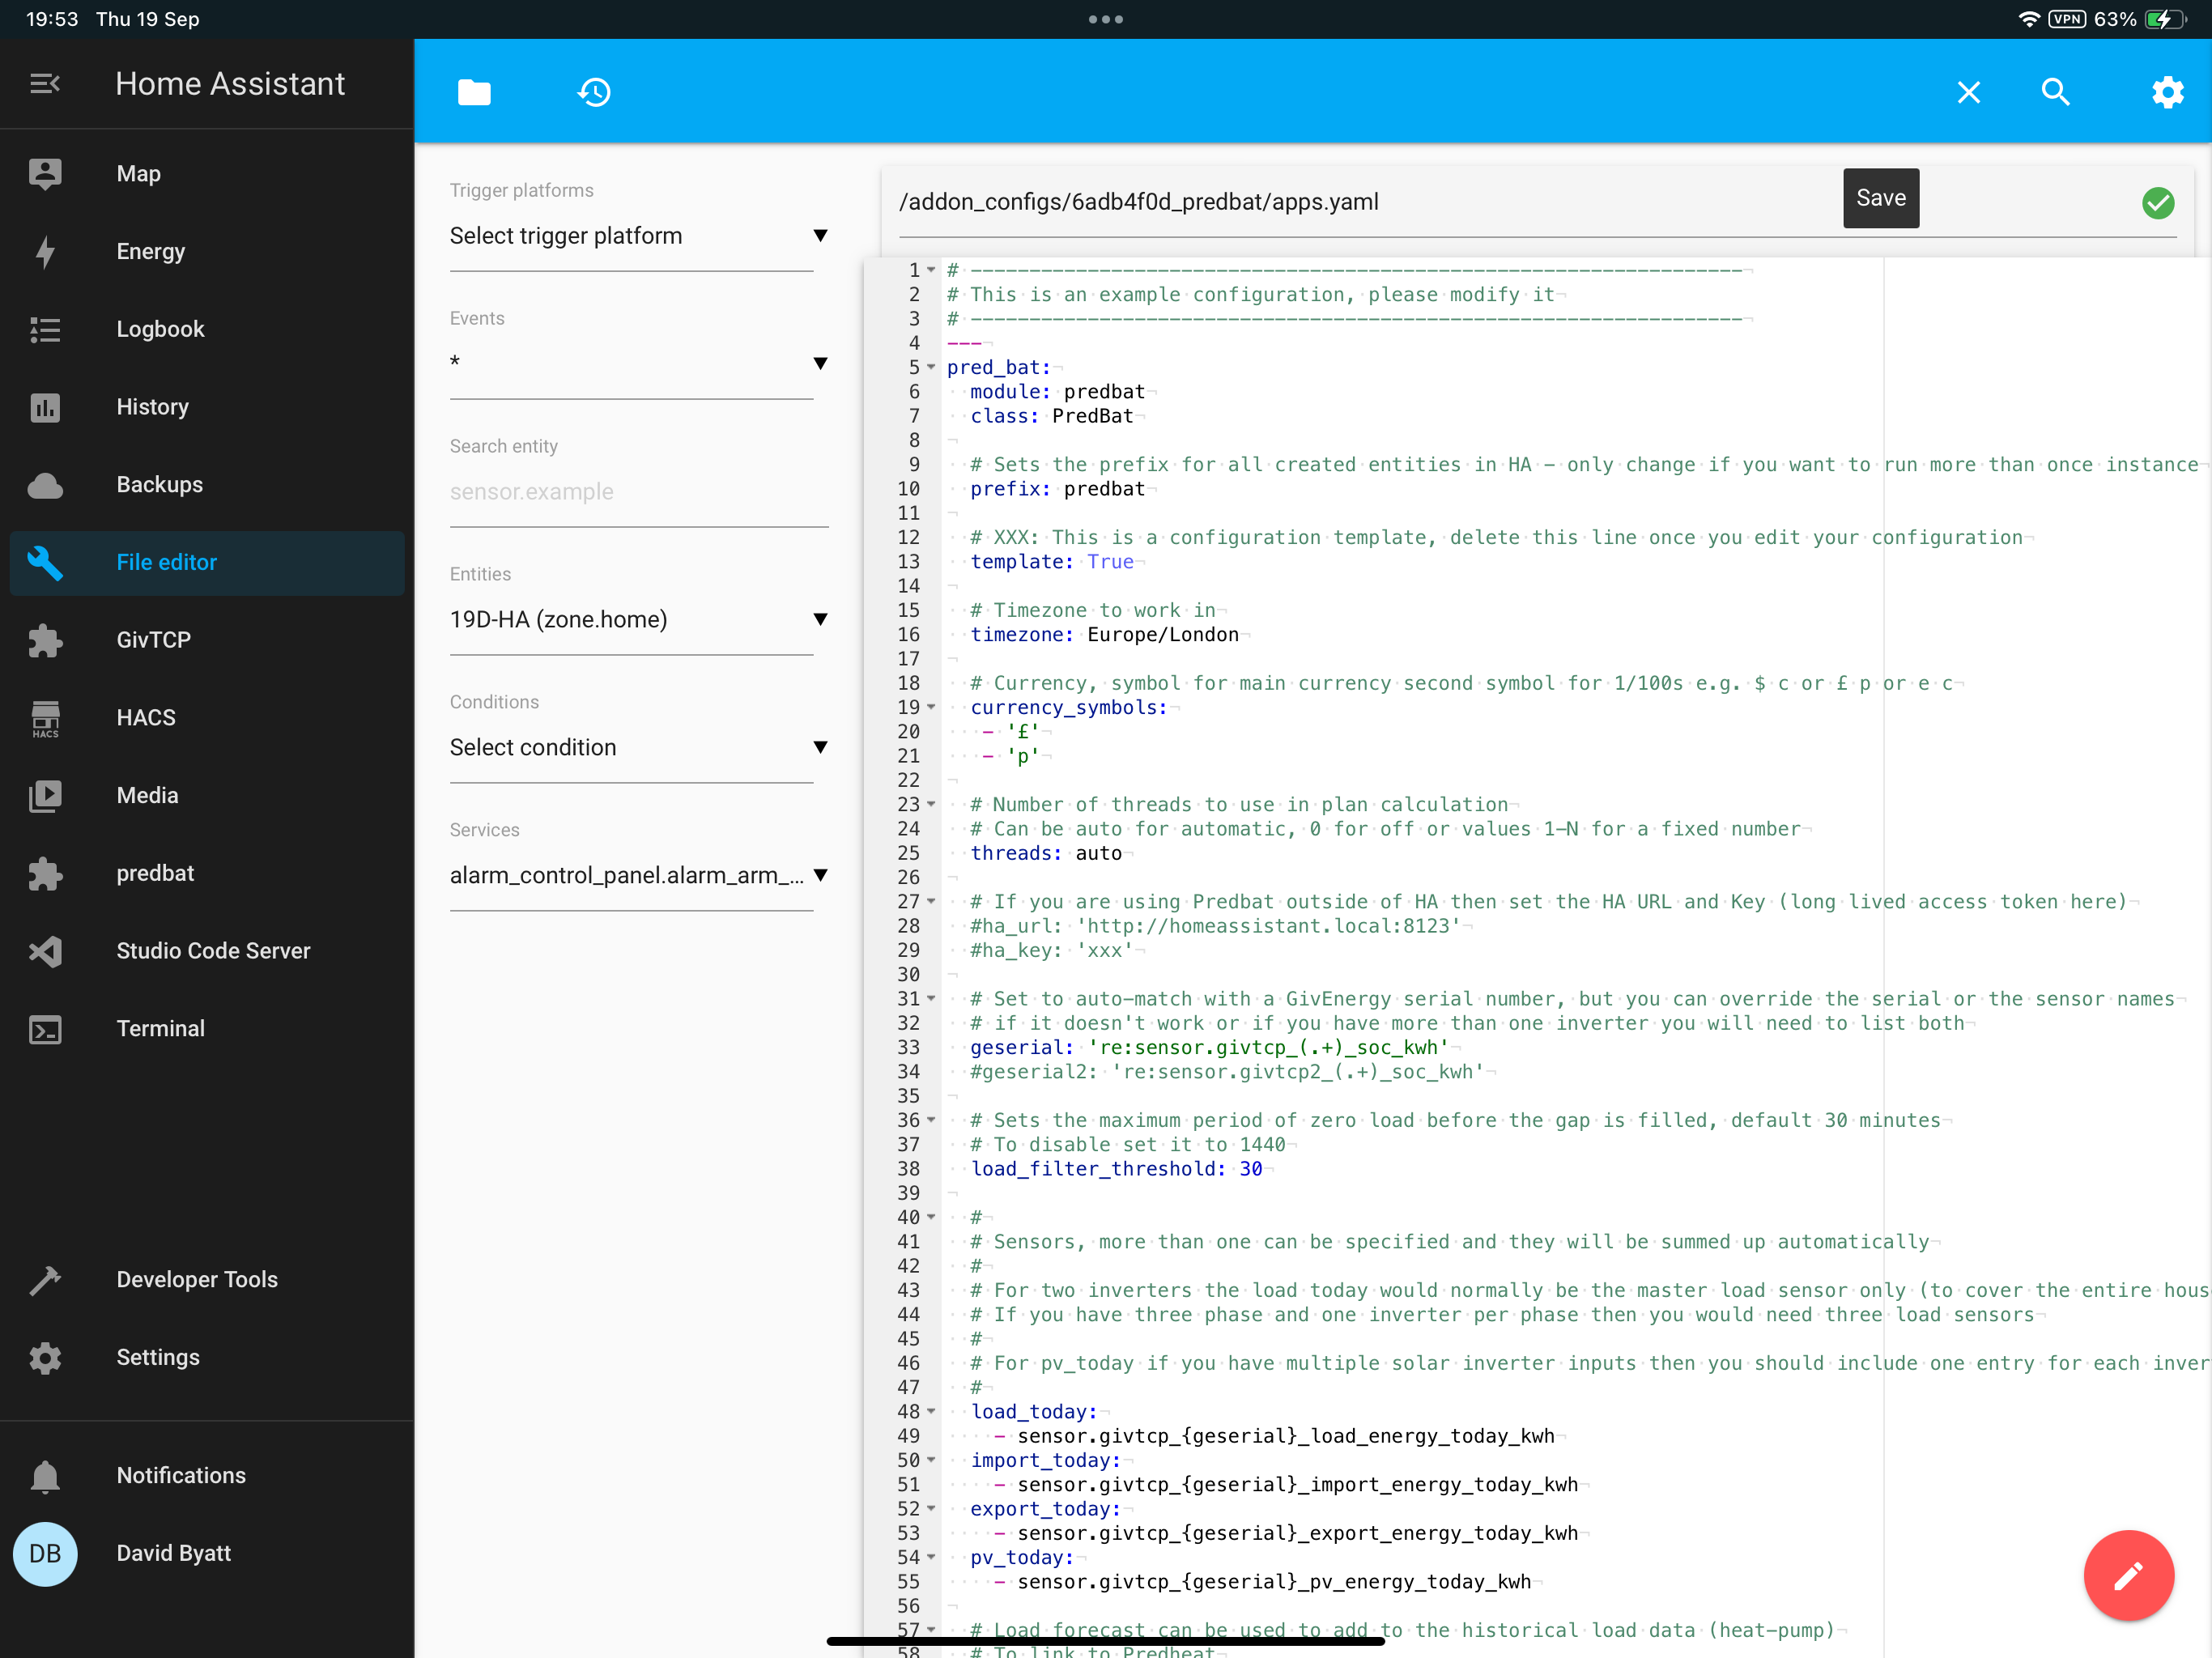
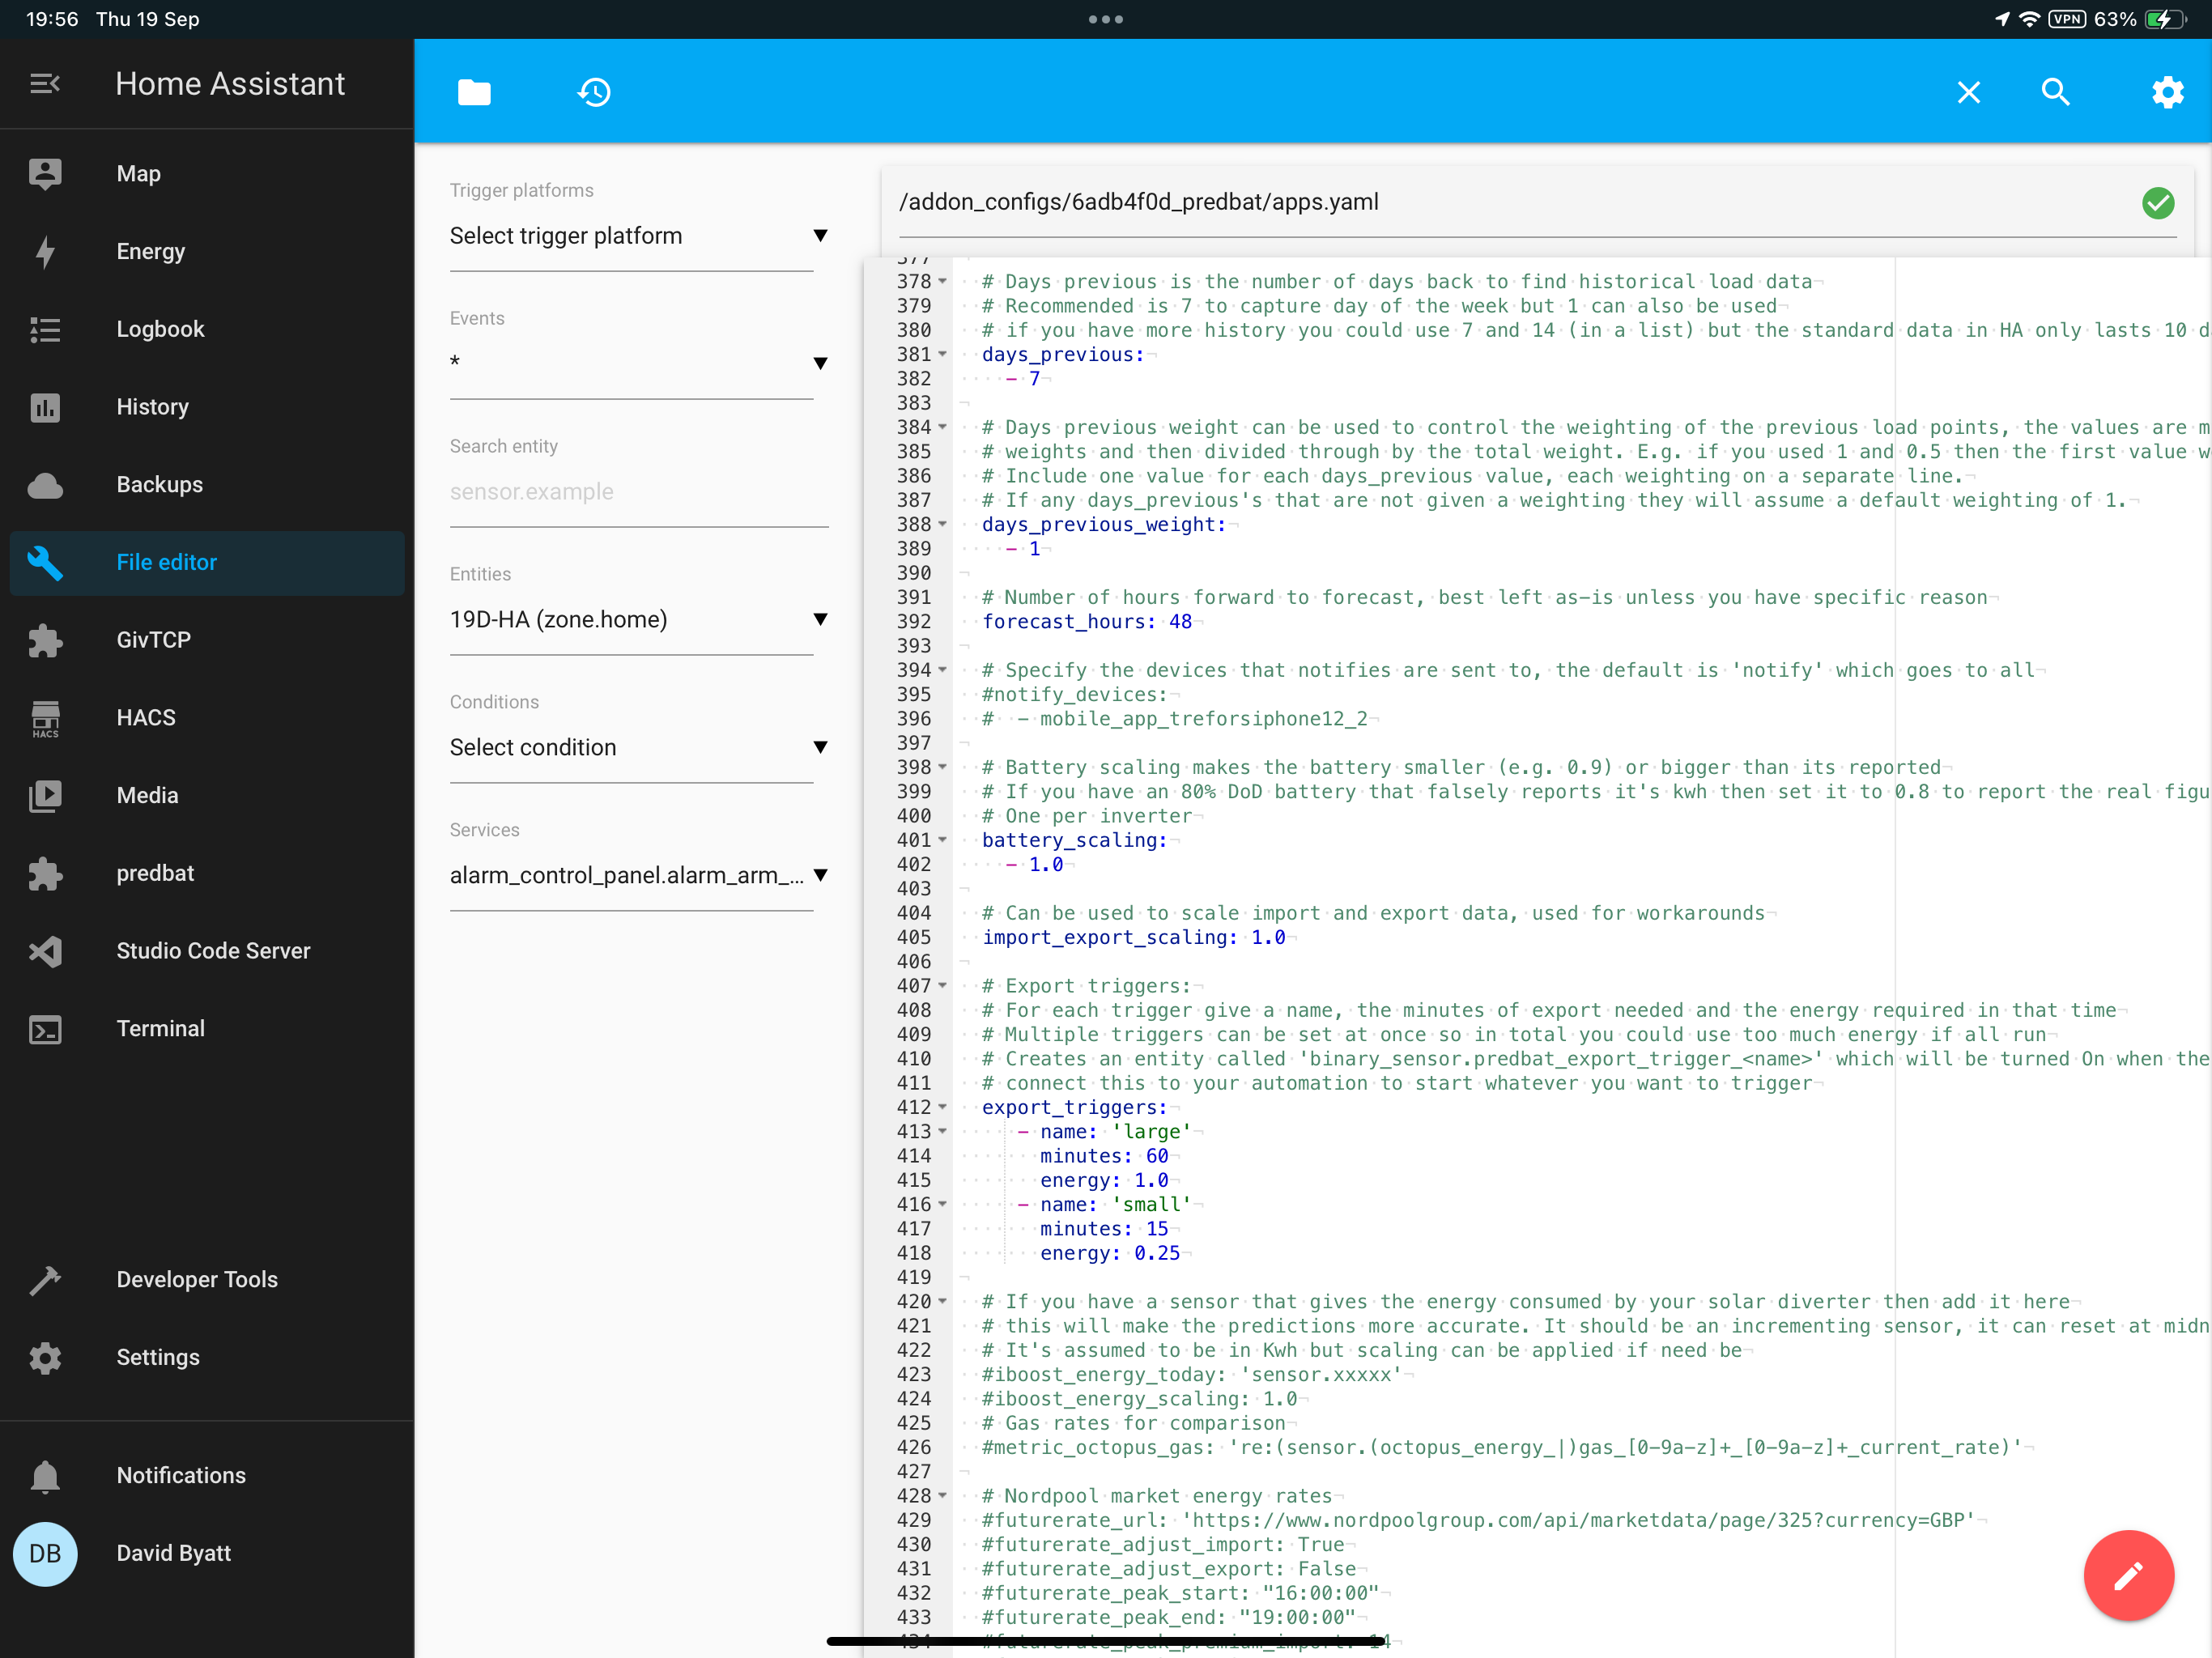
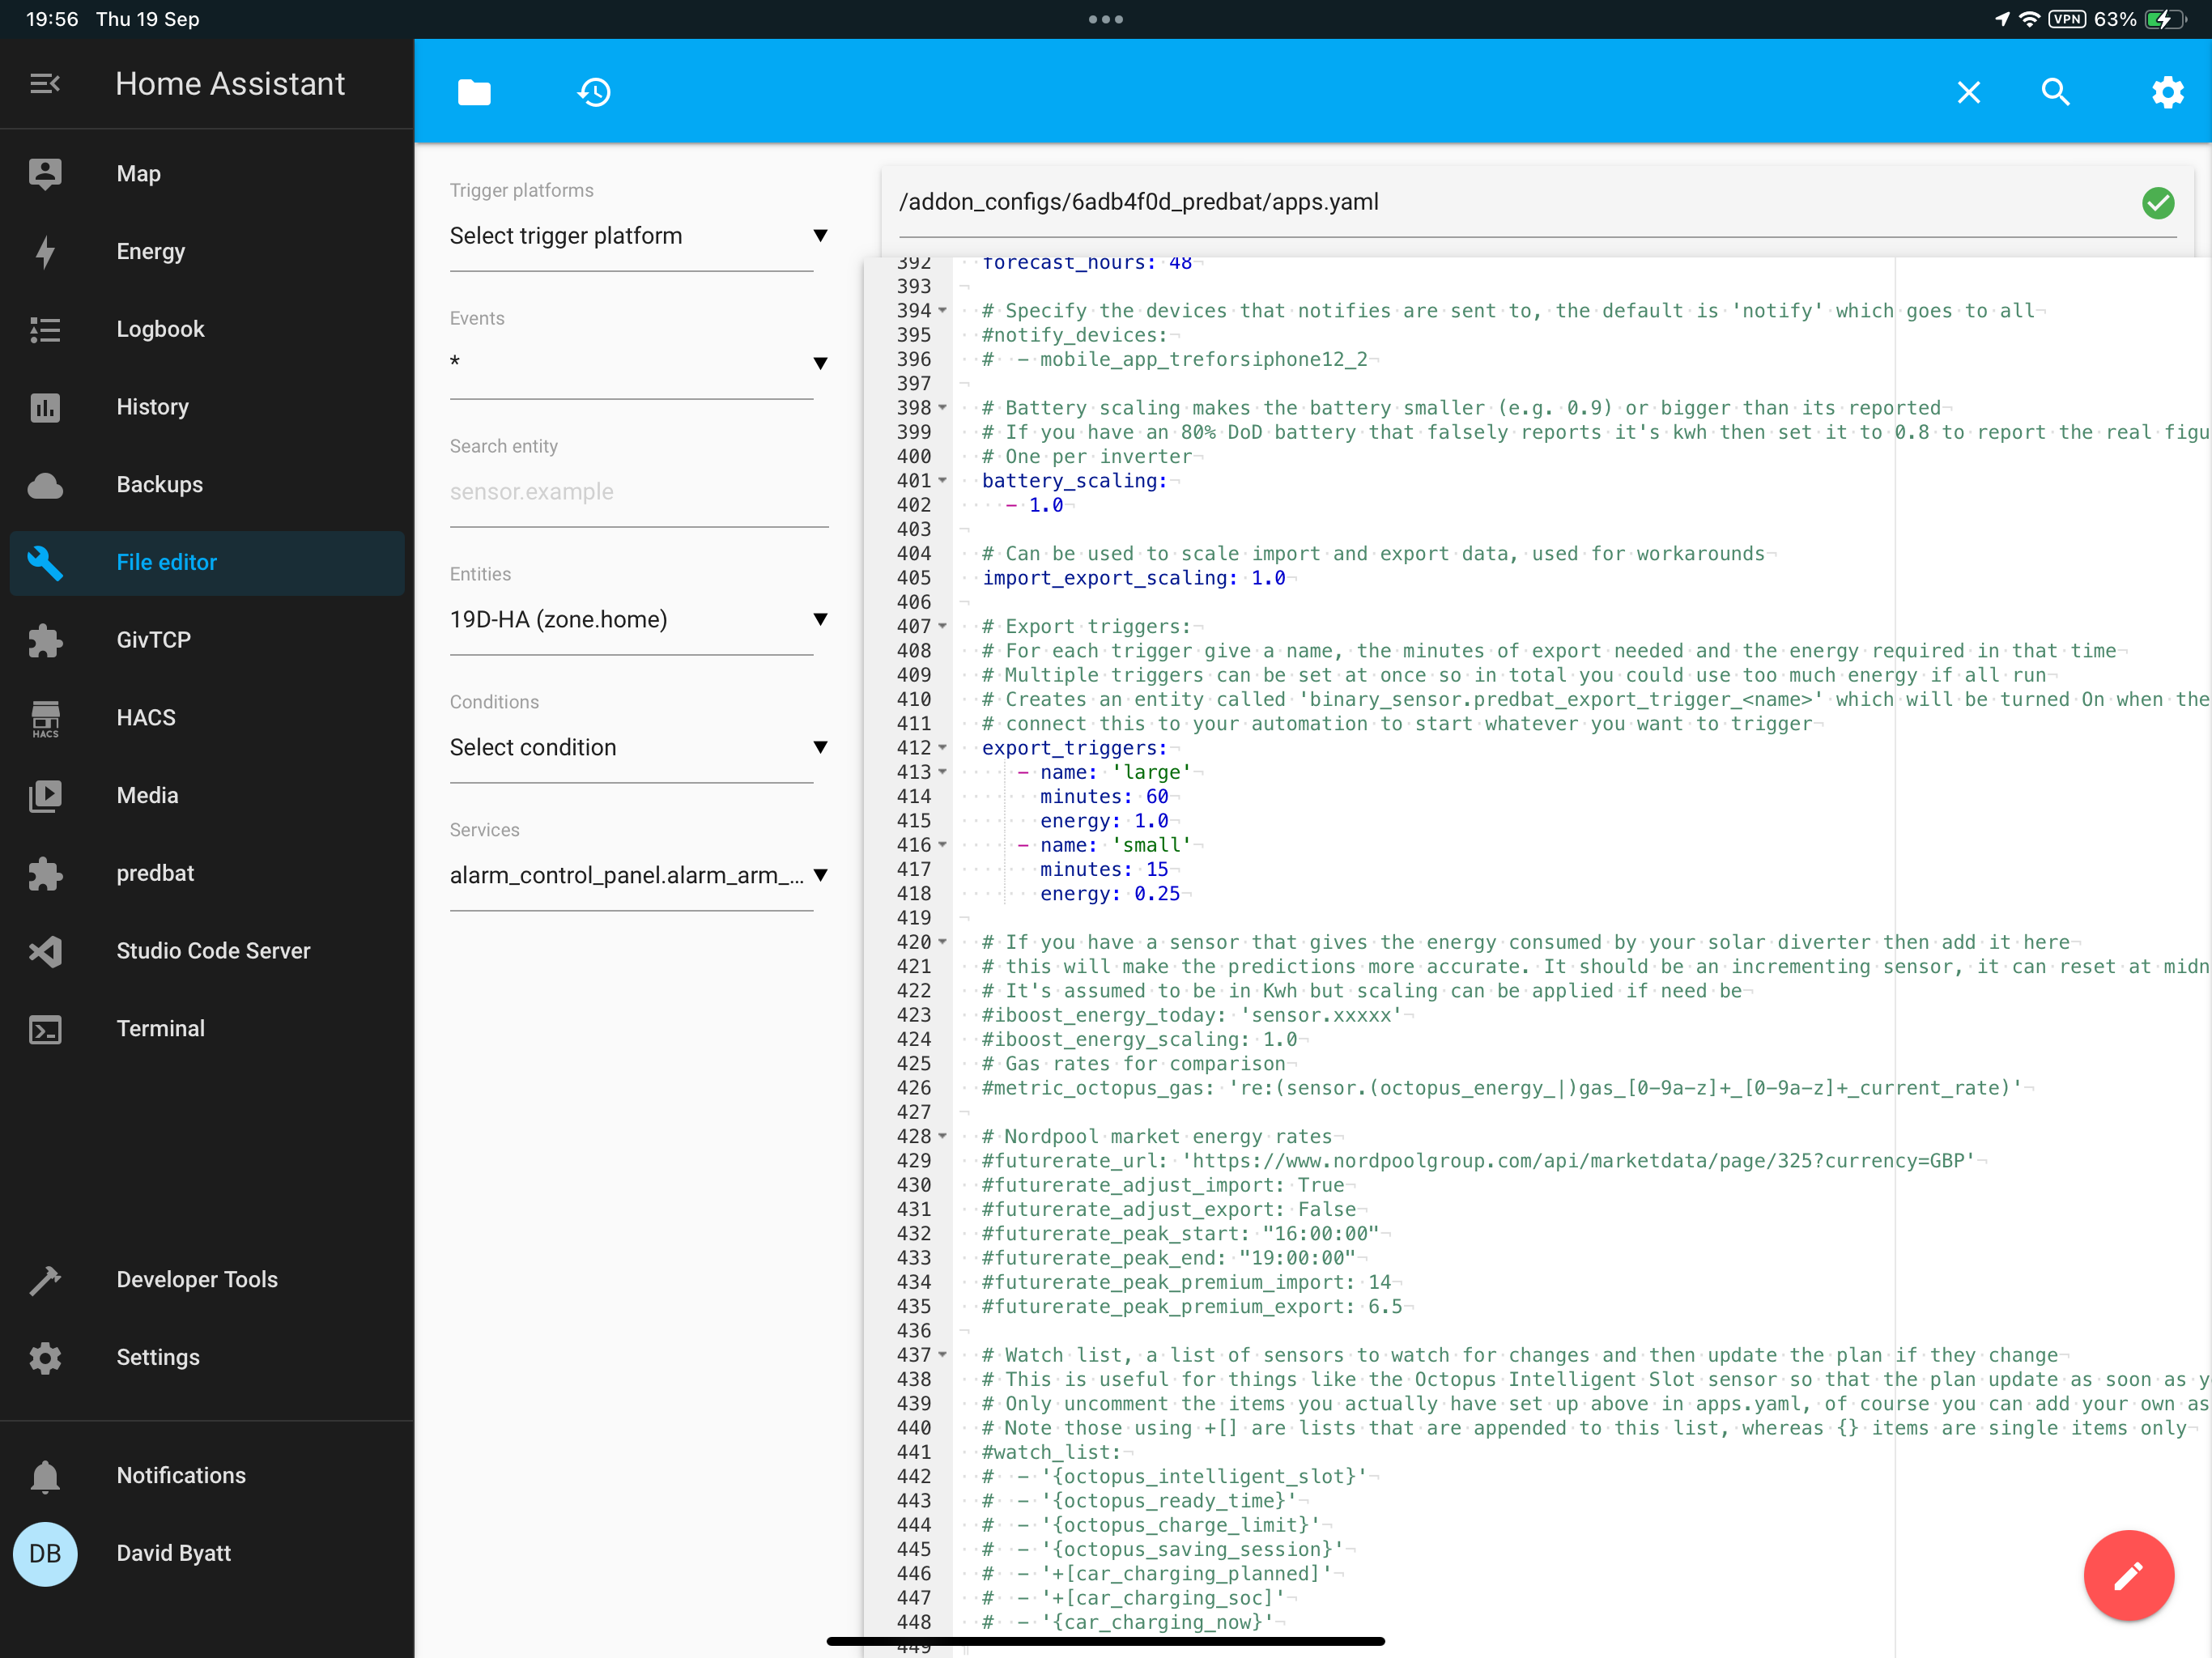
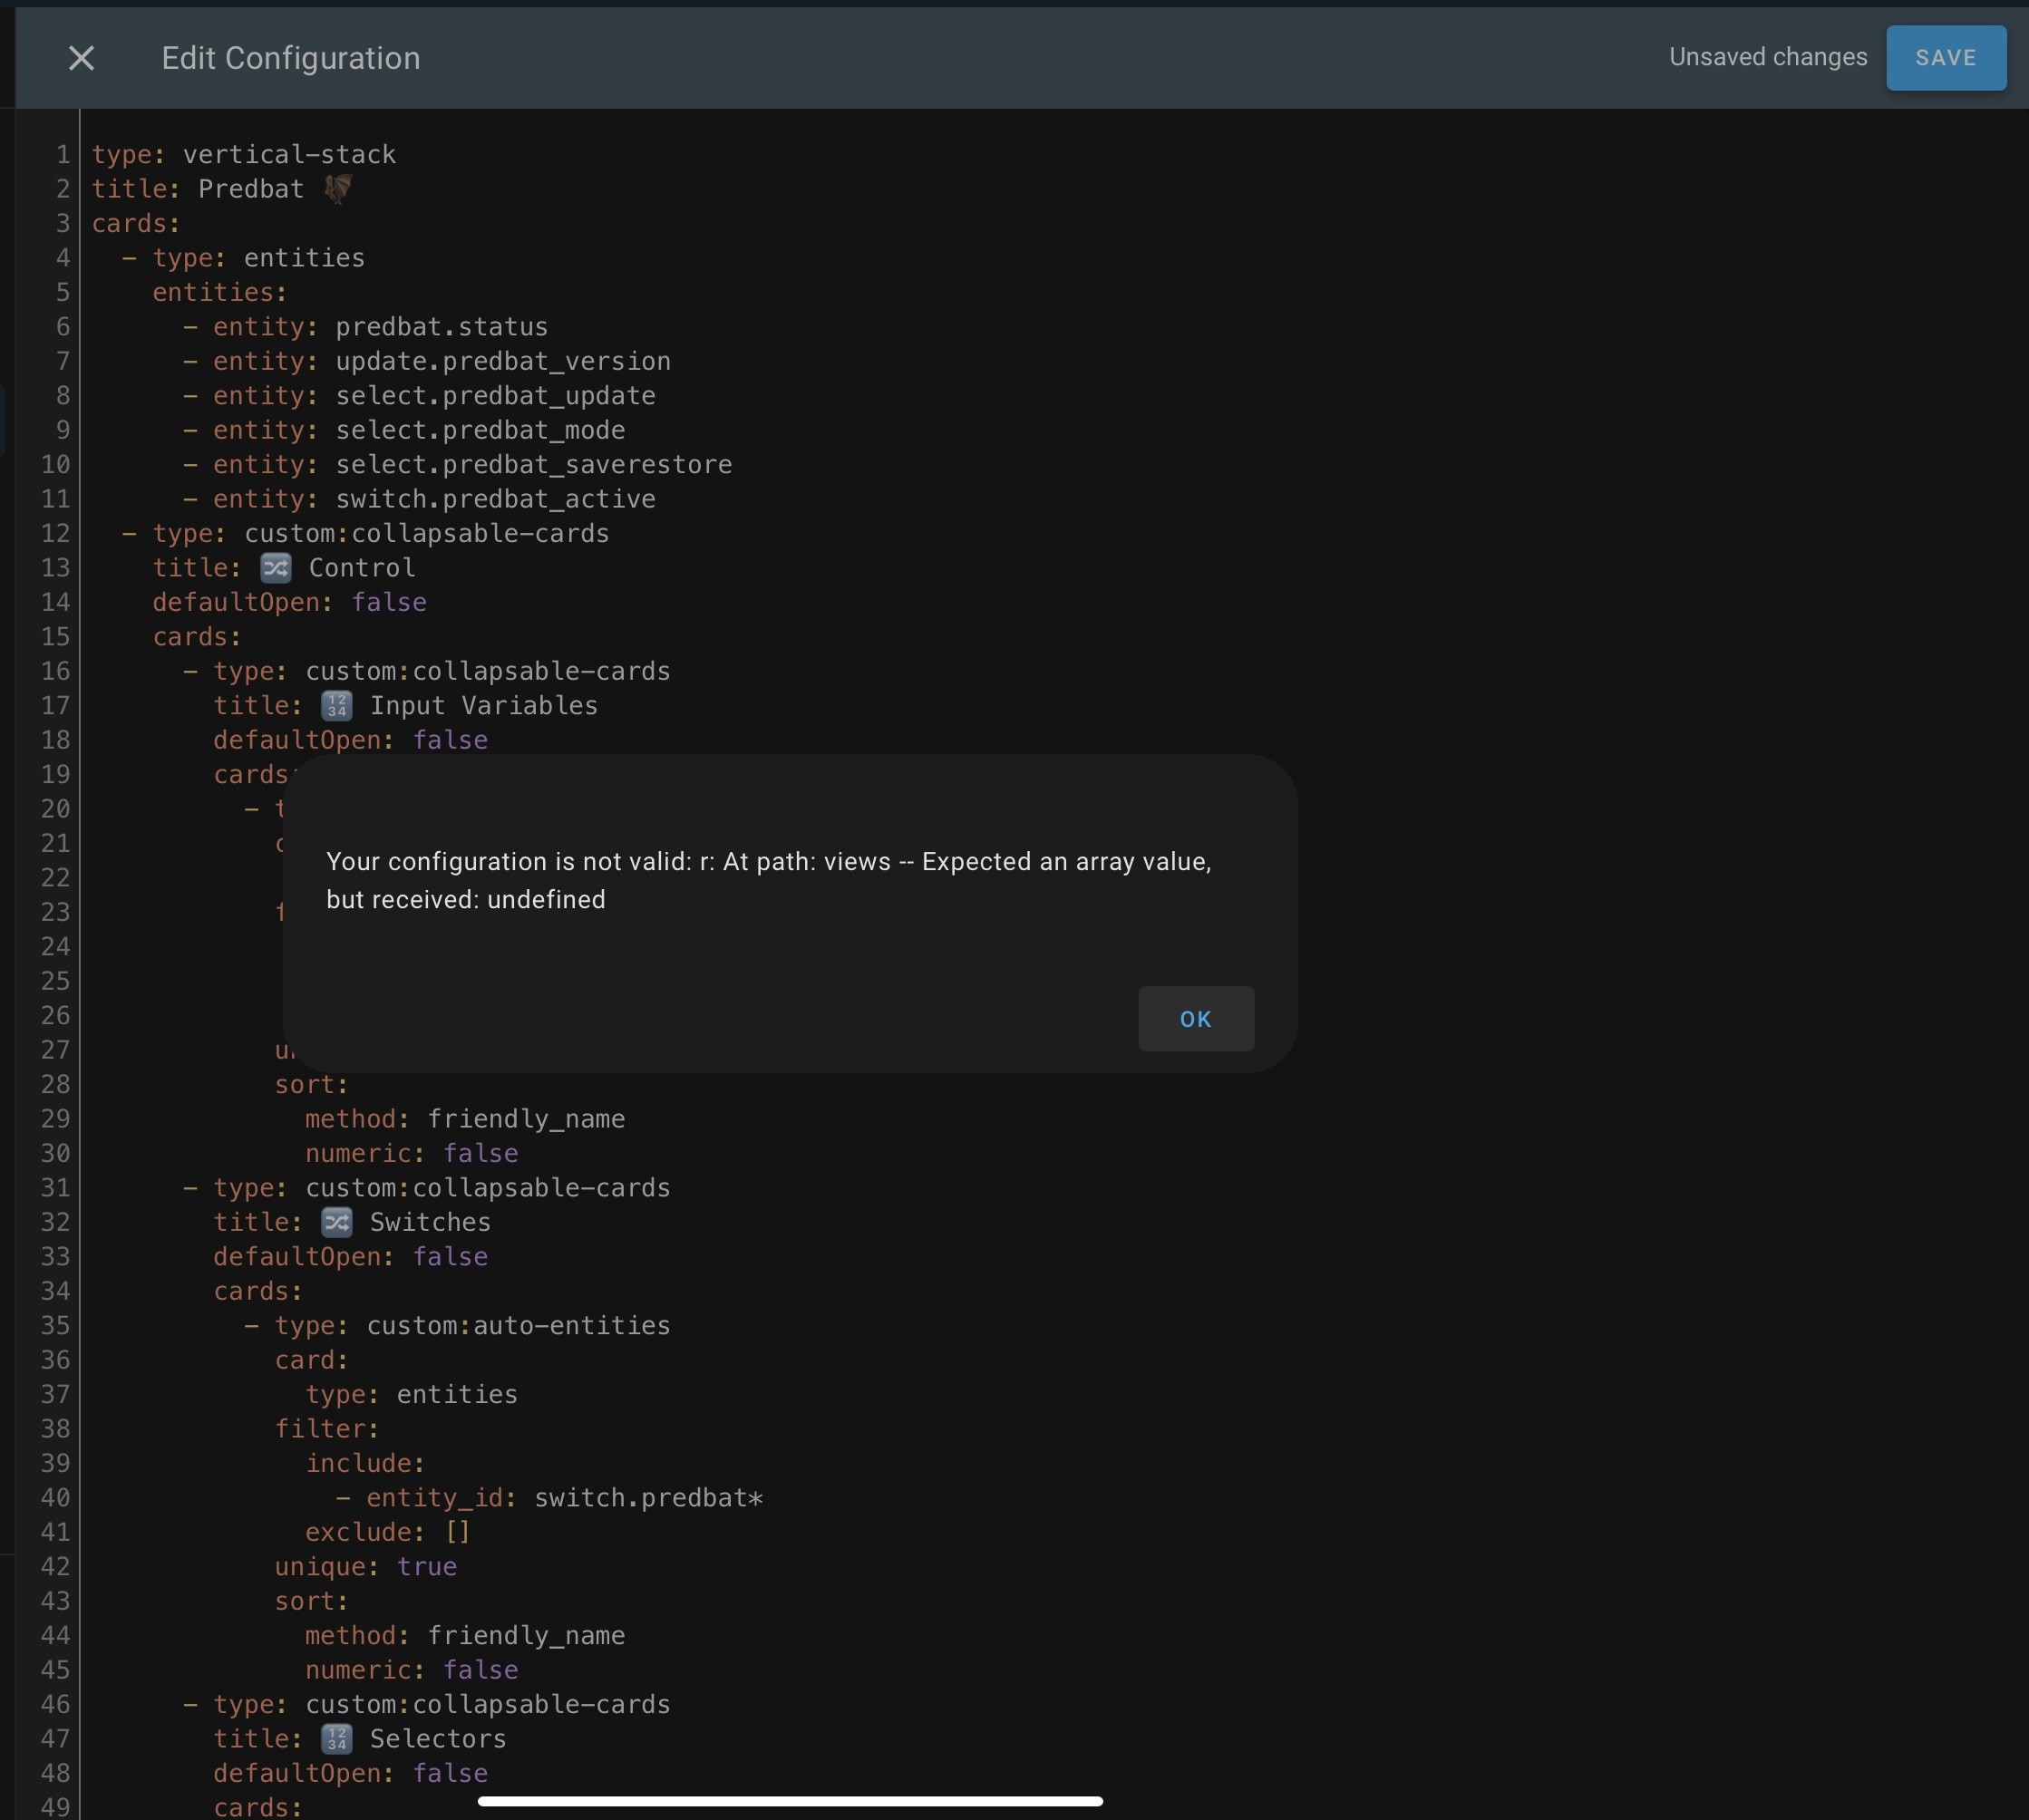
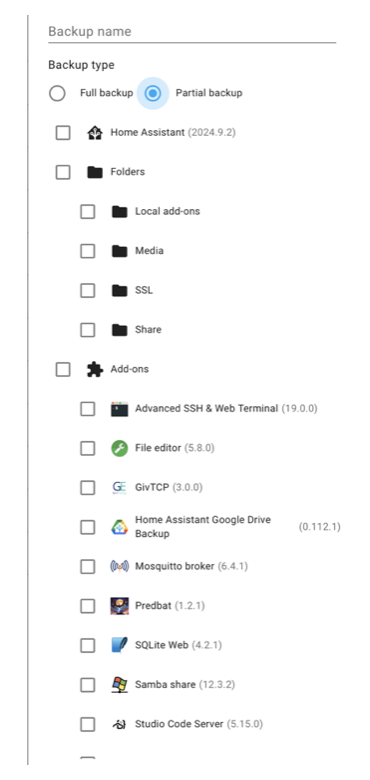
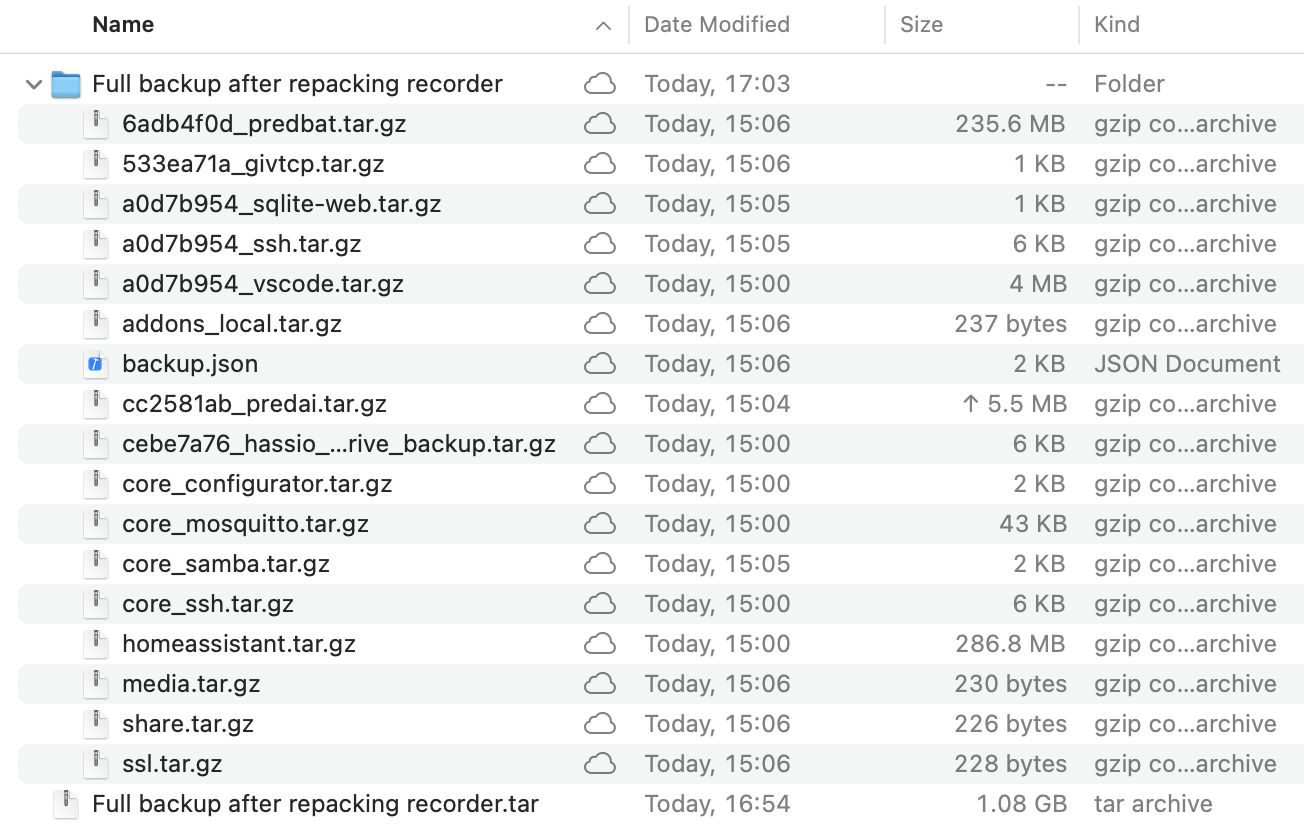
I made the mistake while editing the Predbat yaml file for the first time and doing to much and getting it wrong. I have done a restore of my backup and going to start again just doing the basics.

I watched this video and updated the settings pausing the video as required, instead of watching the video, then researching what settings I need and going from there.

https://youtu.be/QMvRIbAcpk8?si=P5BNiClUi24D3v6Z

D
#3 Daveb01

From @geoffreycoan

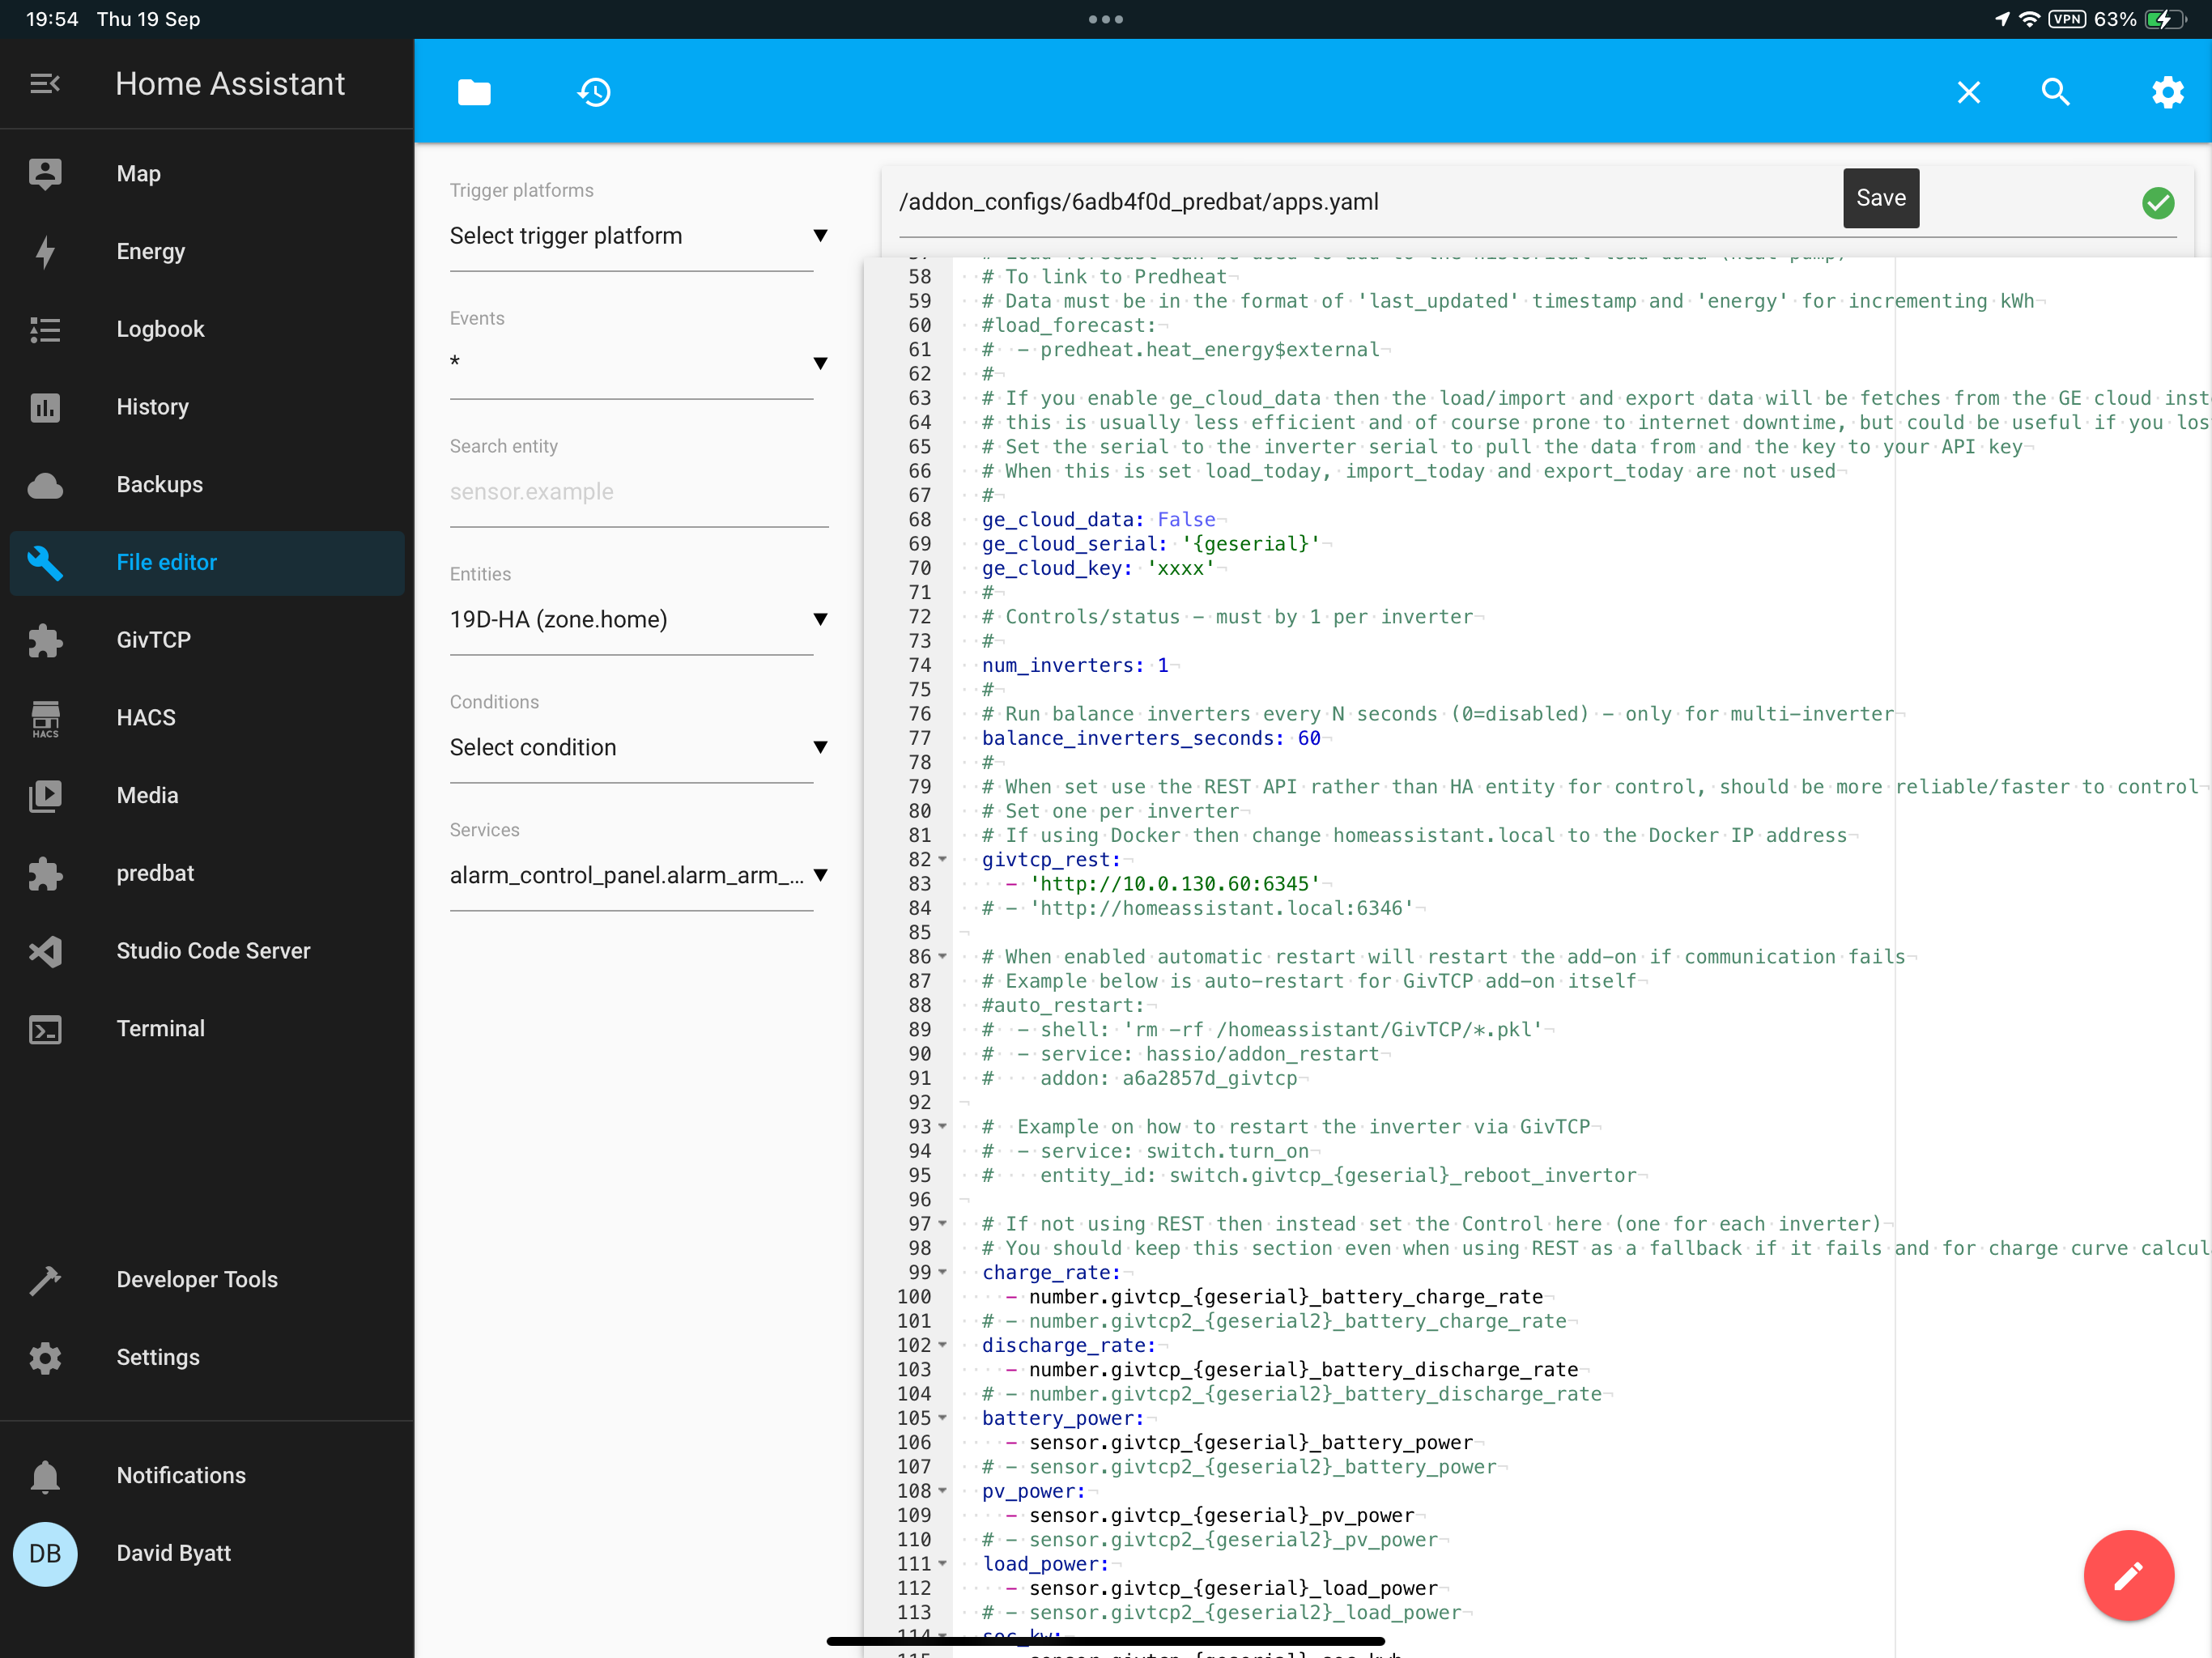
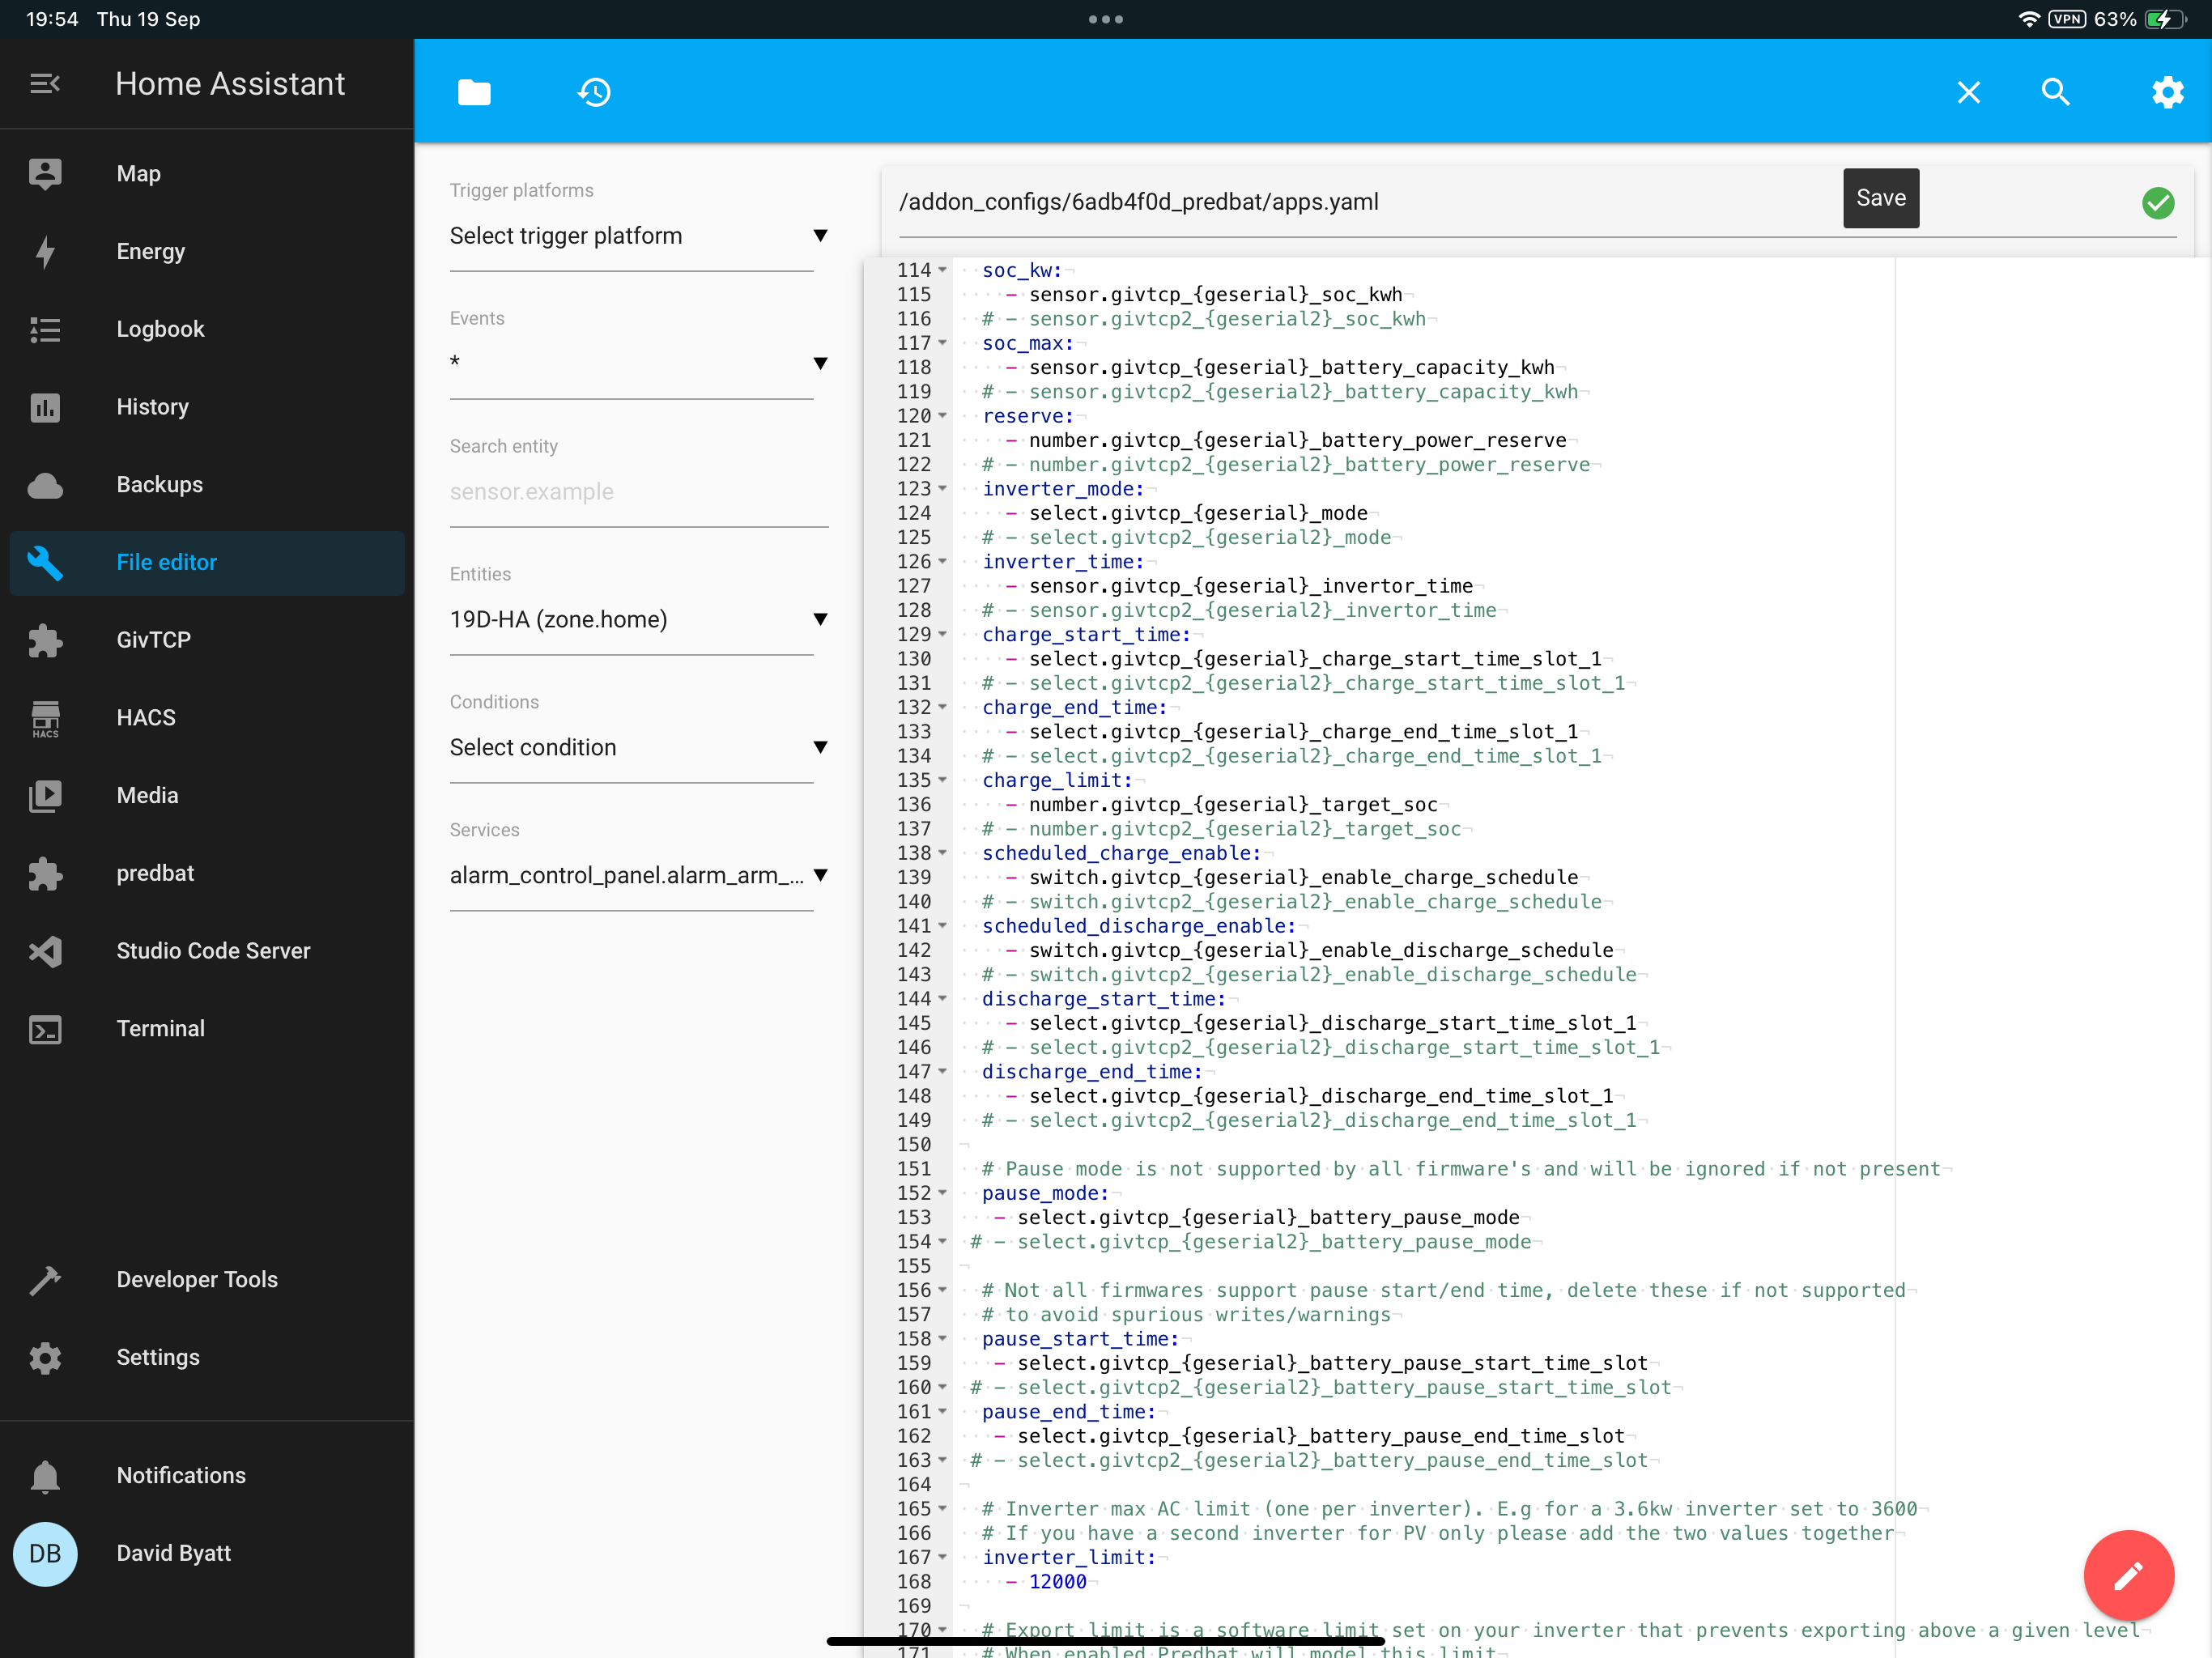
I can see three problems with your config in the screen shot above:

If you have a Gateway and two AIO’s then you ONLY need to configure Predbat to communicate to the Gateway as the gateway is what controls the multiple AIO’s. All the lines with geserial2 should be commented out
Similarly your inverter_limit should only have 1 entry not two and it should be the sum of your AIO’s max capability
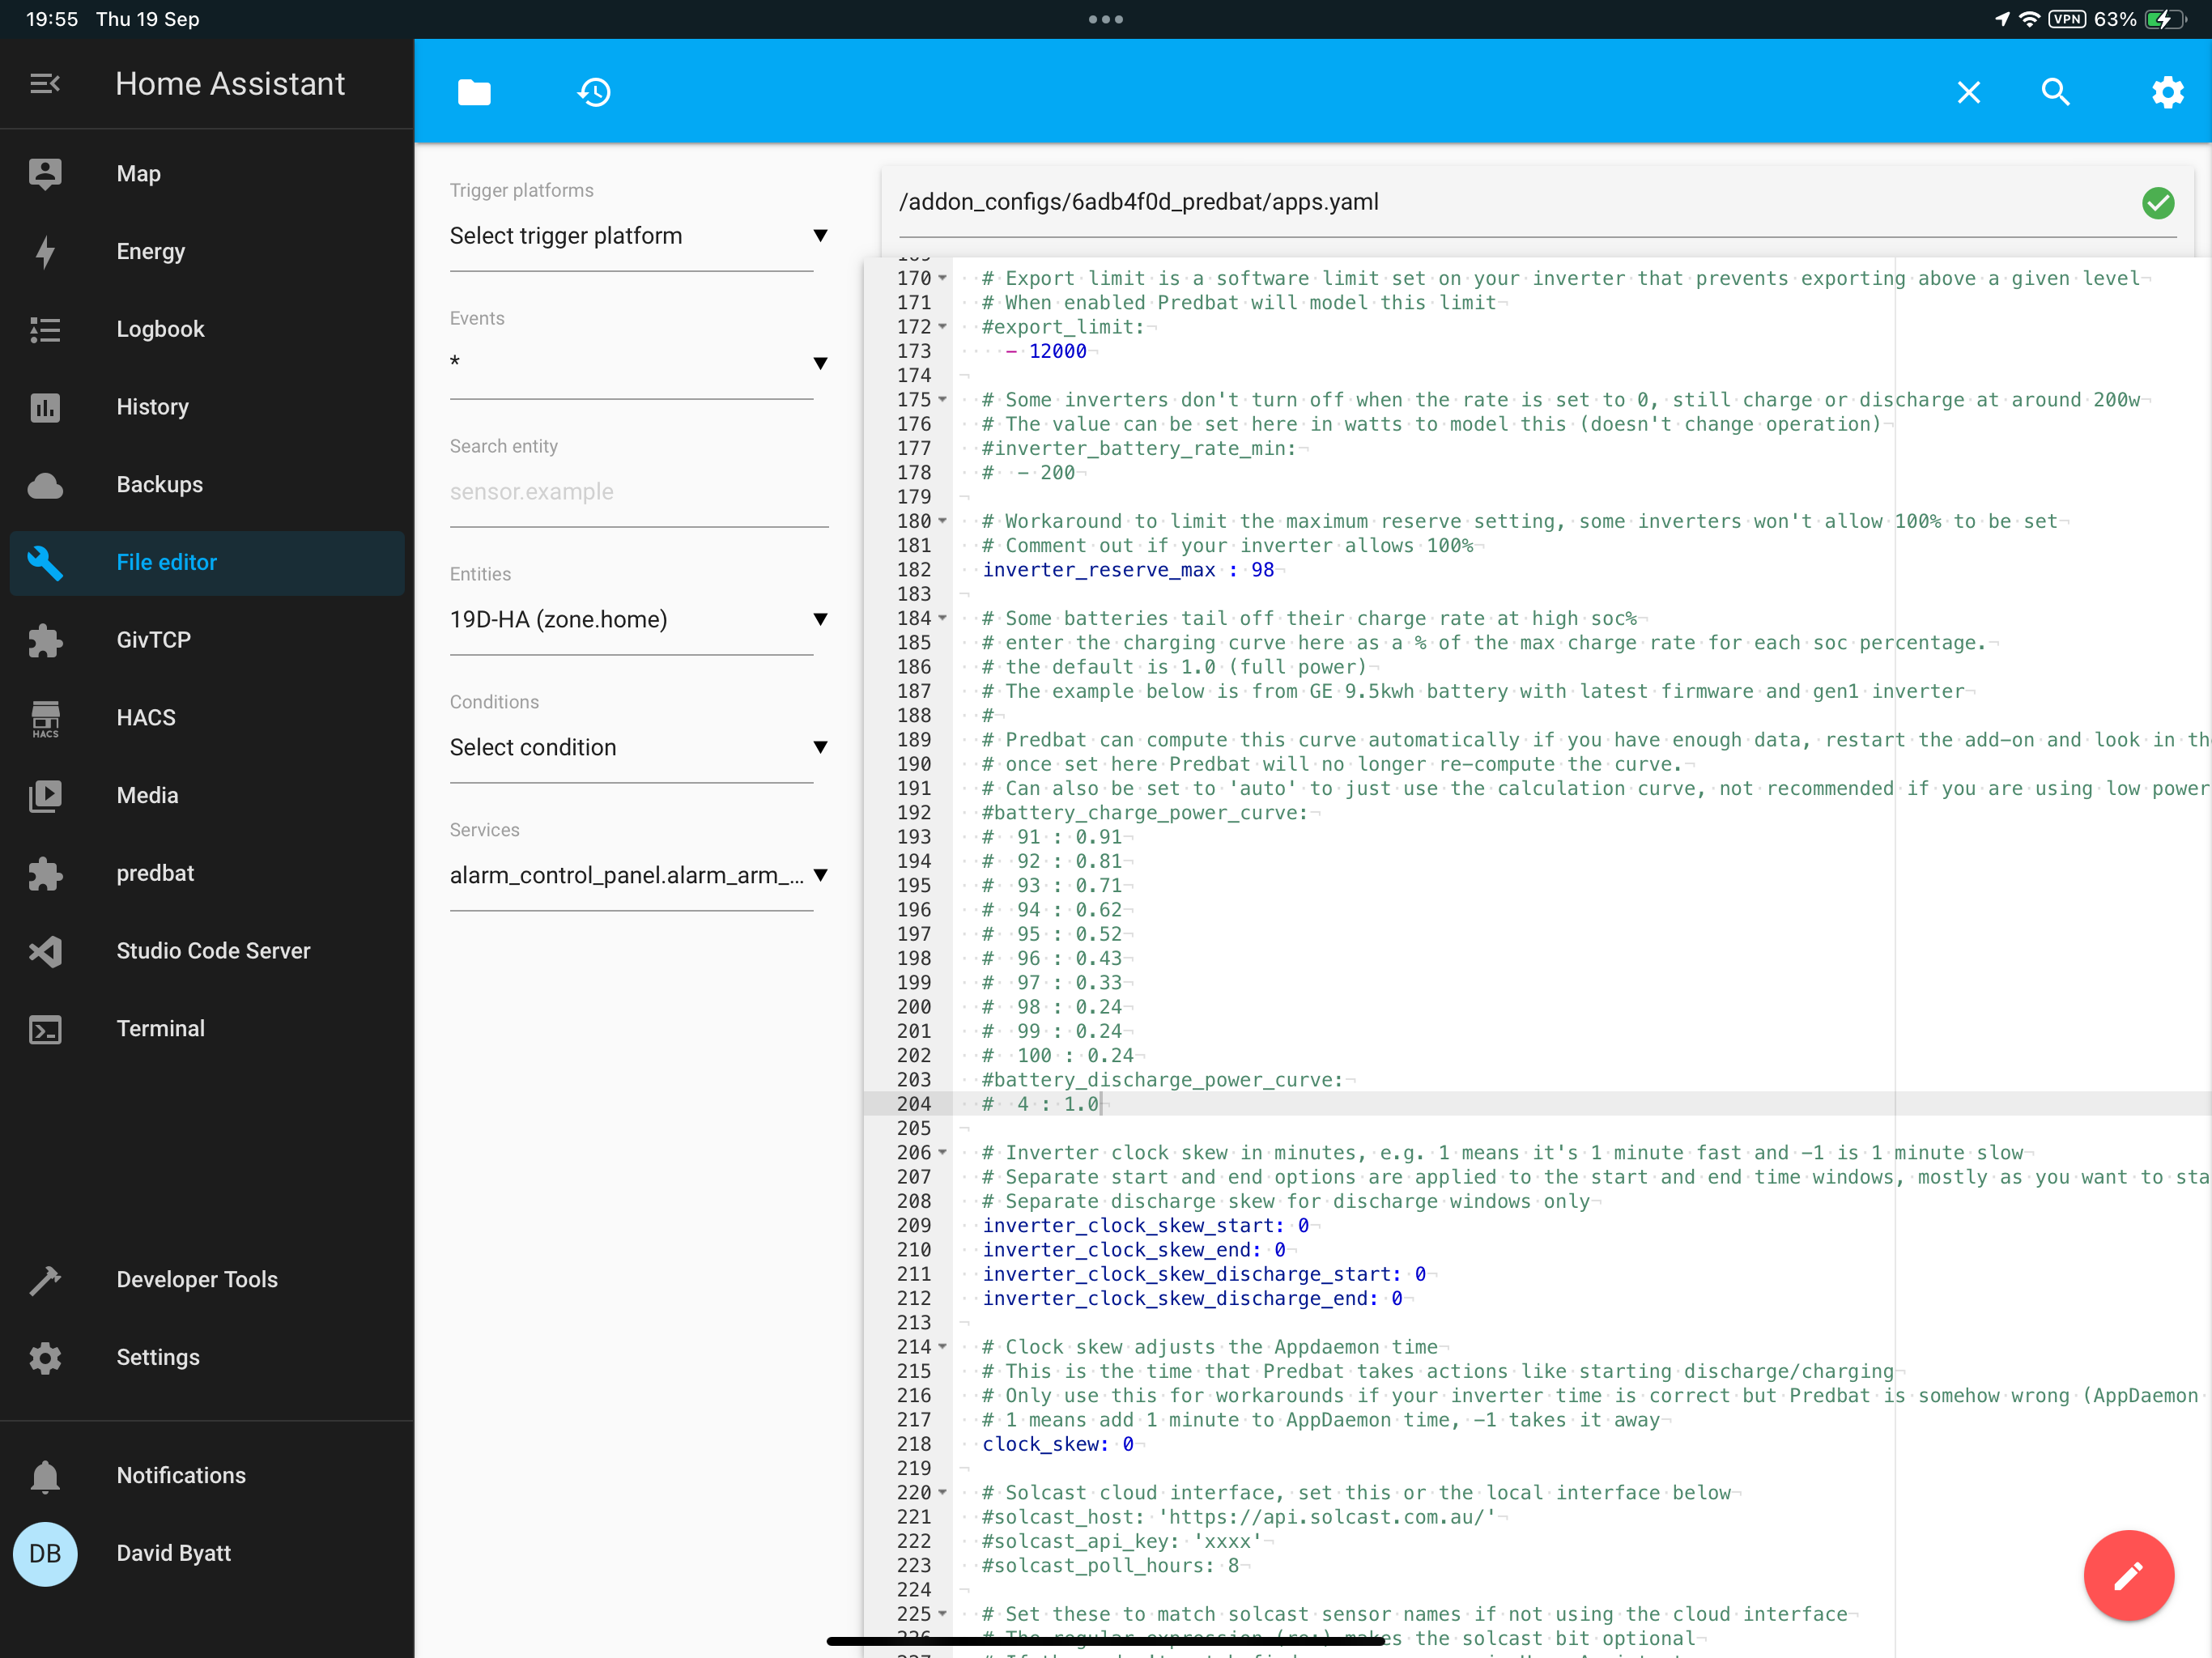
You have a rogue line in your yaml; inverter_battery_min_rate is commented out but ‘- 100’ is not commented out. This may cause you problems as that - 100 will get tagged to the previous node (inverter_limit). Unless you specially need this I recommend you comment both lines out
There isn’t much you need to configure specially for an AIO, but geserial must evaluate to your gateway serial number. When Predbat starts up it will tell you what it evaluates the regular expression to, just check it matches your gateway serial number, and if not, just hard code it in the apps.yaml

You do need to set battery_scaling for the AIO https://springfall2008.github.io/batpred/apps-yaml/#battery-size-scaling and inverter_reserve_max https://springfall2008.github.io/batpred/apps-yaml/#inverter-reserve-maximum

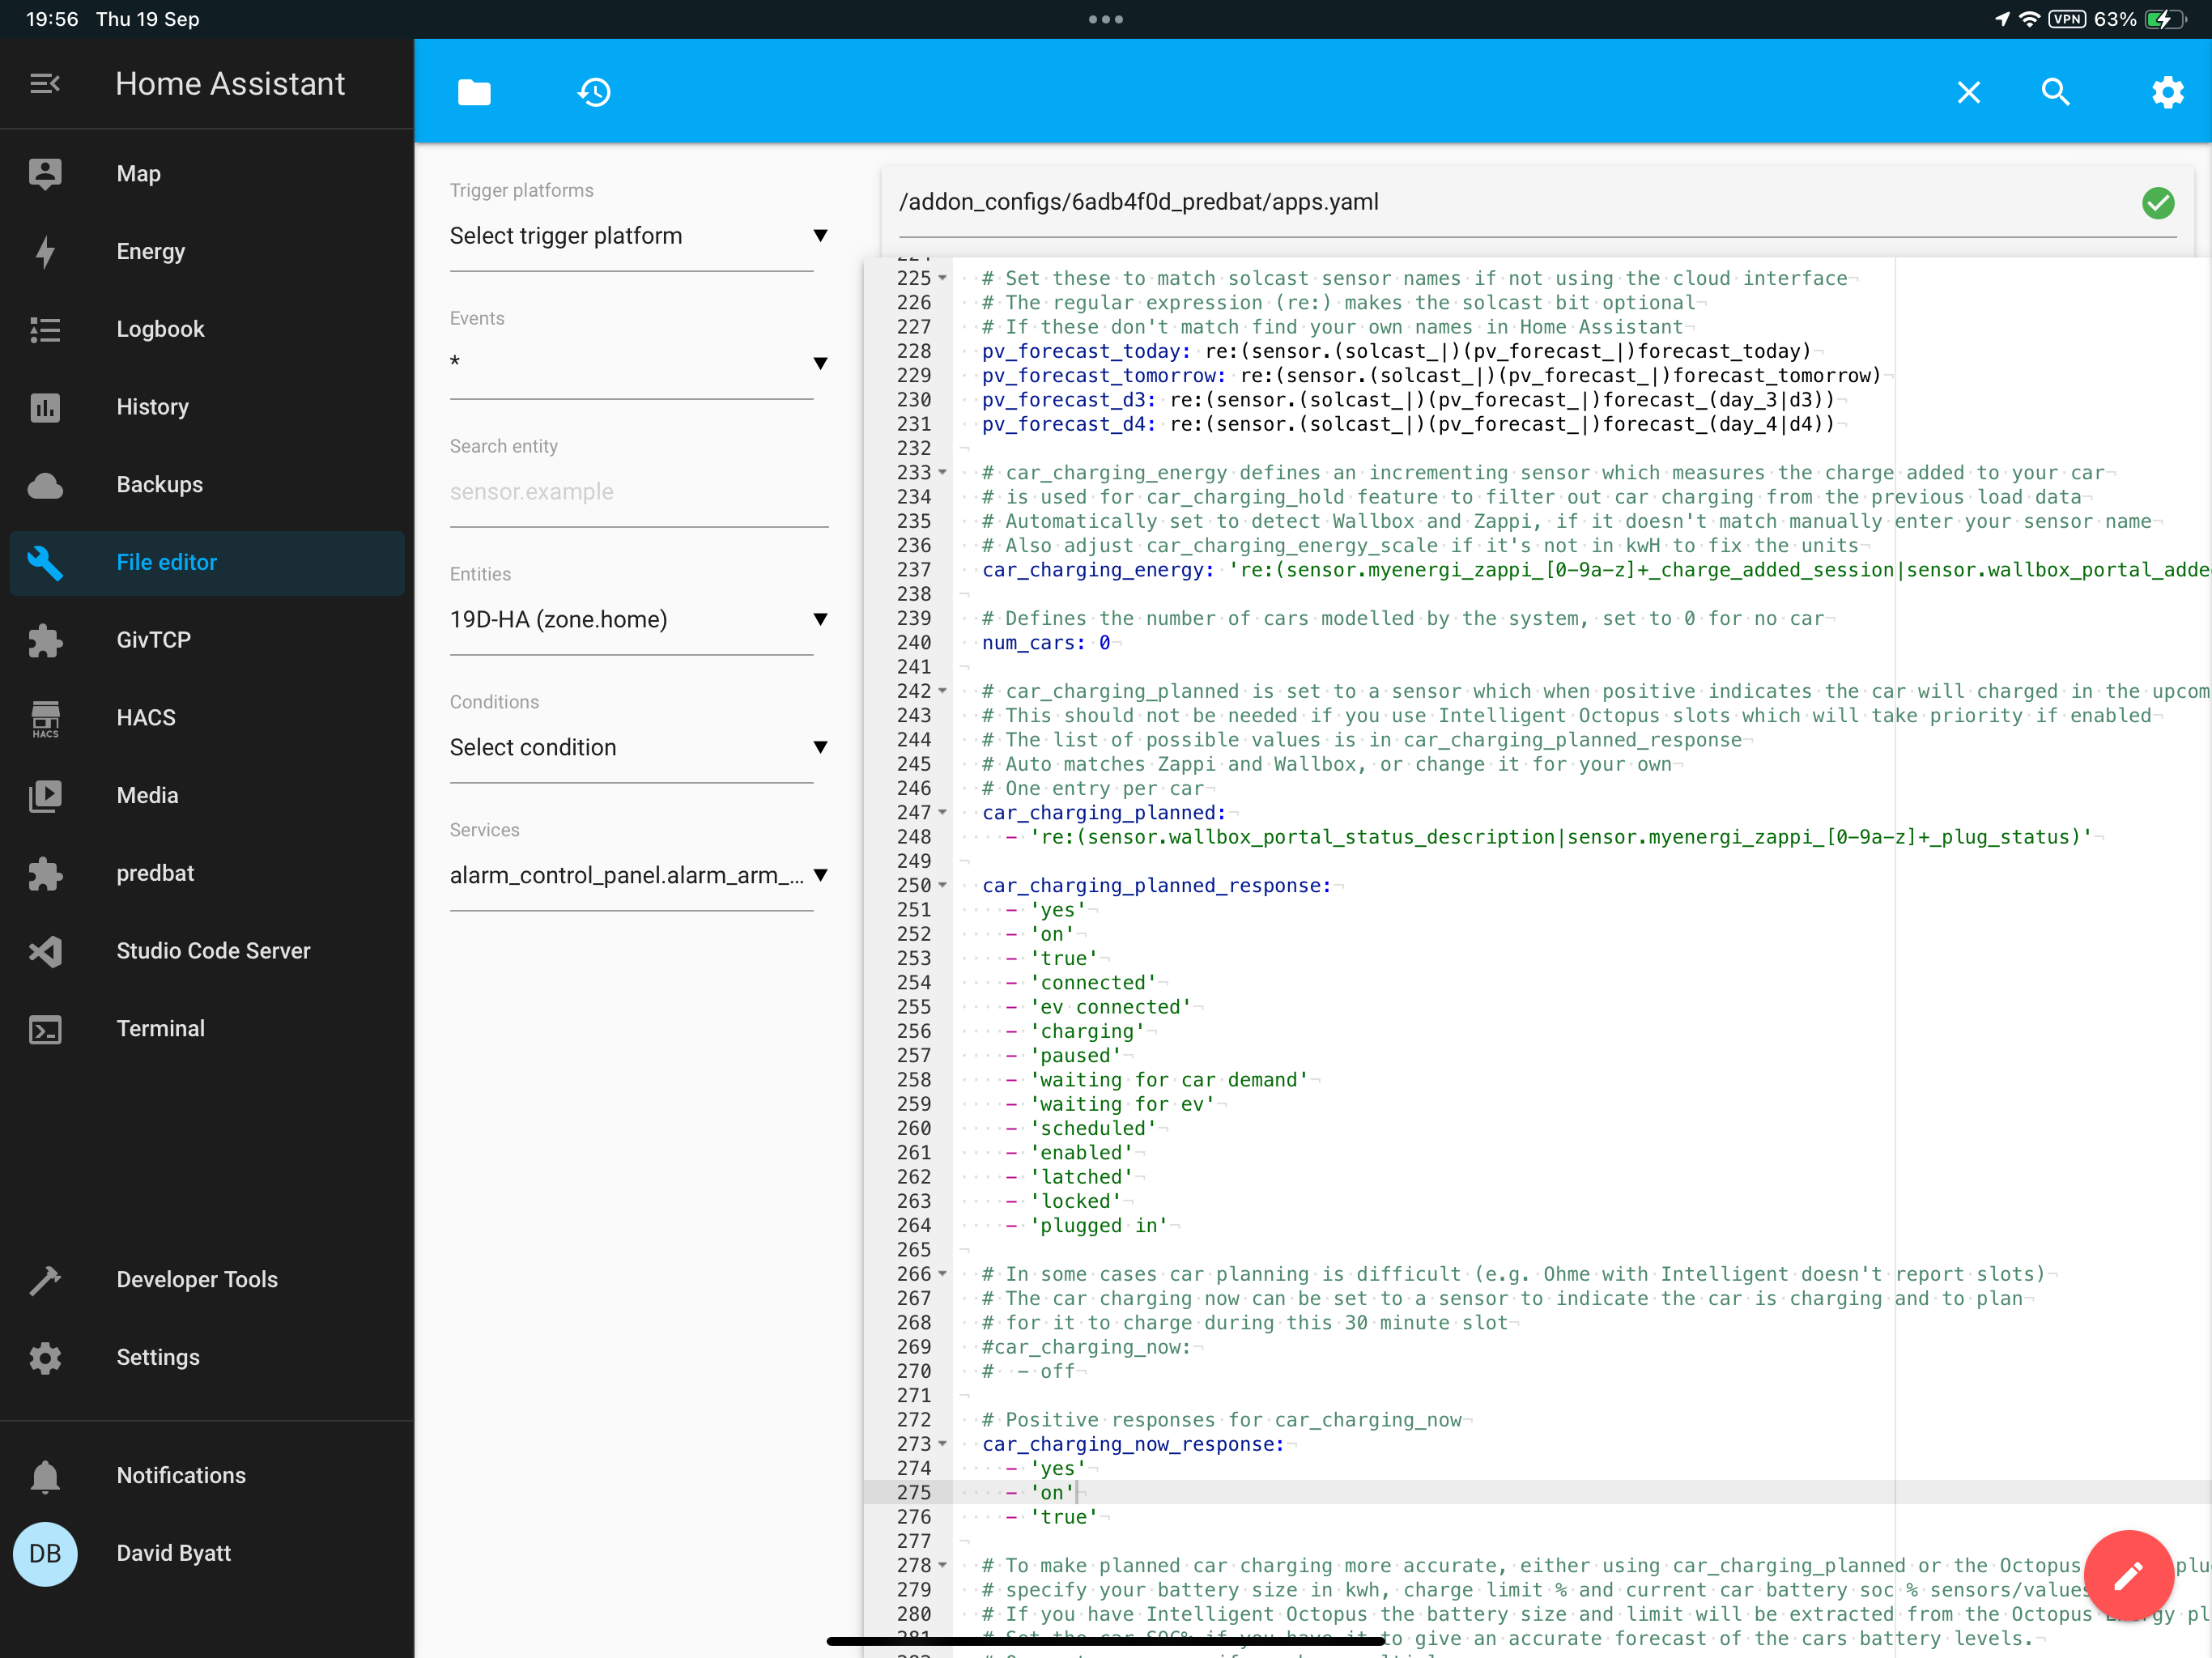
I also see in your logfile you have set num_cars to 1. Just to get things going and reduce the number of things to get right, set num_cars to 0 and once you get predbat working you can add it back in later.

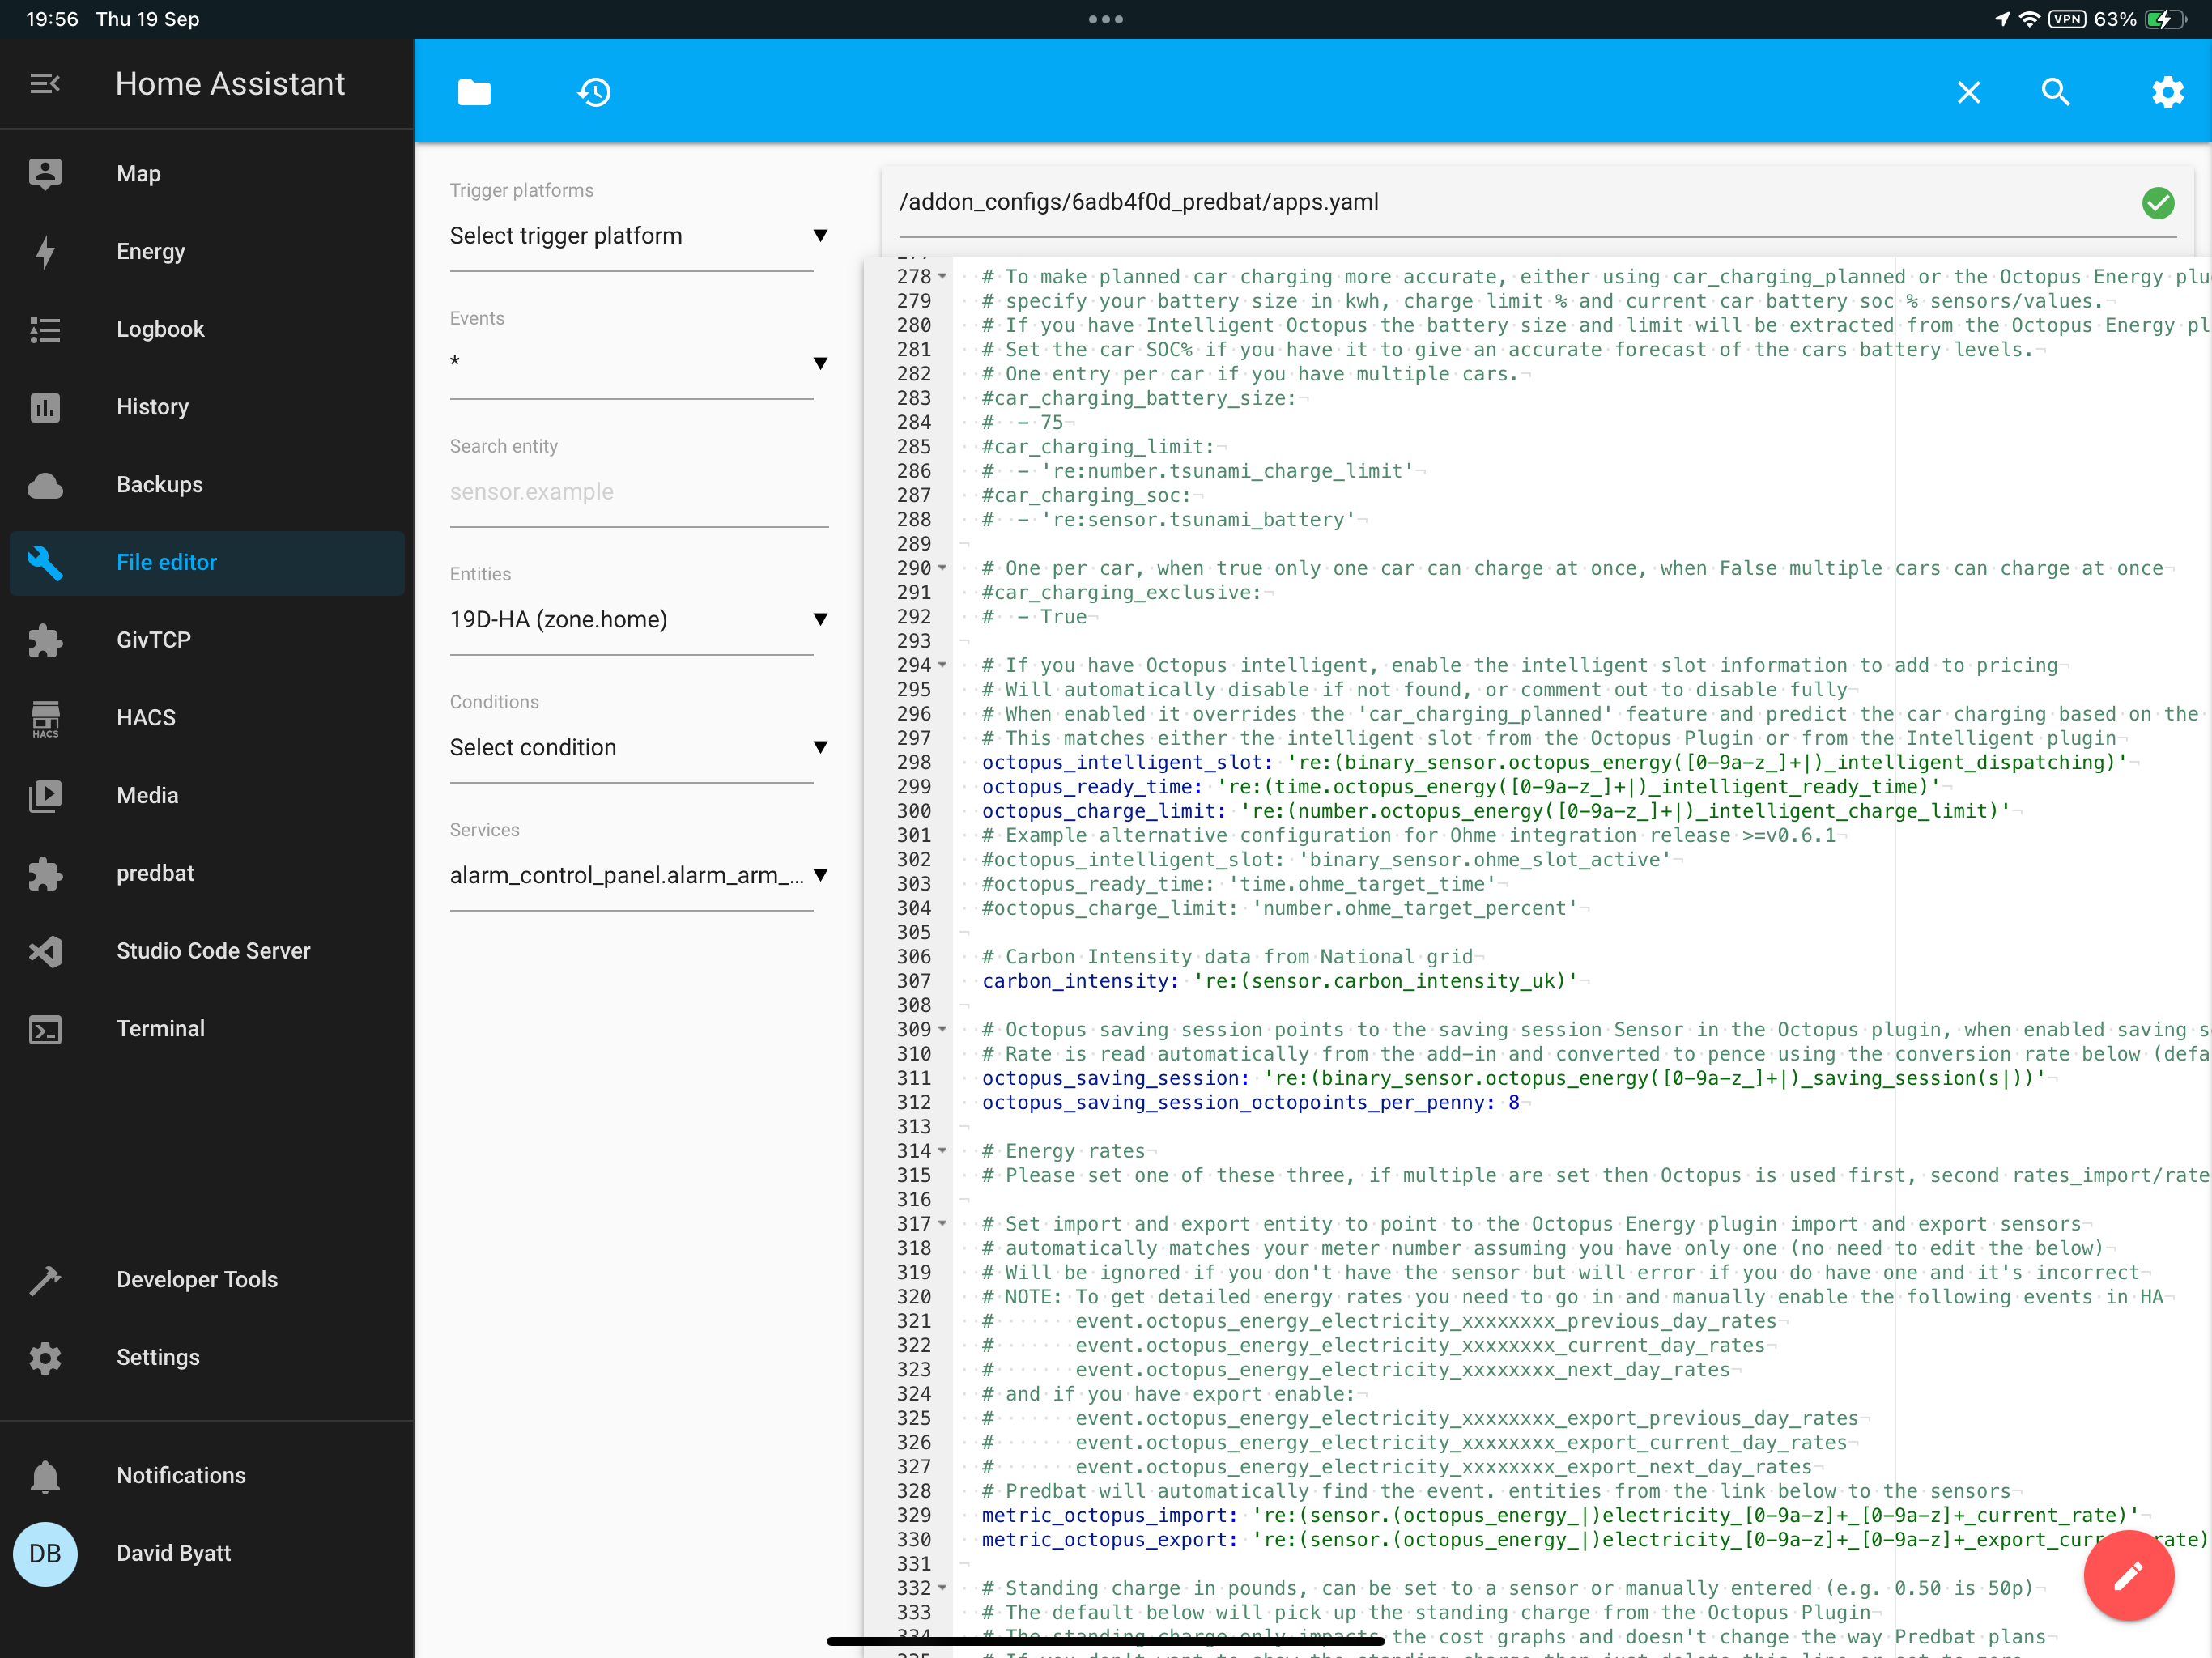
The errors you are getting in the logfile point to the metric_octopus_import not being set correctly. I think you said you were using the direct API for the rates not the Octopus integration. What is it set to in apps.yaml?

D
#4 Daveb01

Here is my first attempt at the config, loads of errors in the log.


D
#5 Daveb01

@geoffreycoan

So I have now got these when I select Predbat 👍😀 getting there (got some way to go yet)


G
#7 geoffreycoan

Daveb01 trying to answer the error messages in sequence:

  1. Warning about missing load data, that's fine, you can ignore it, its just saying that your historical load sensor doesn't have a full set of history. I see you have days_previous set to 7. If you are a new install then you may not have that much history present. Suggest you set days_previous to -2 and -3 (separately lines). But even in my own config I get gaps of 10-20 minutes reported almost every day as does Rob so there's something weird with predbat, but its not enough for me to worry about too much.

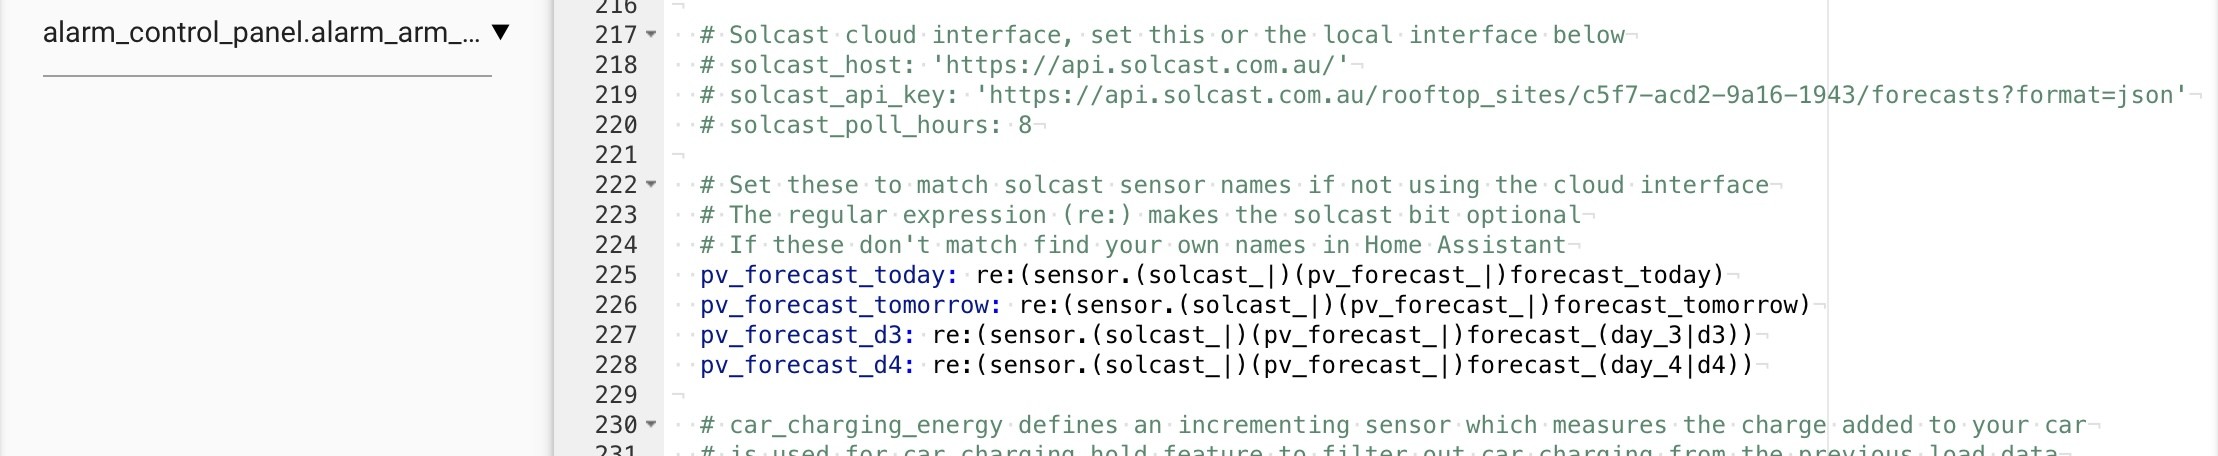
  2. The solar warnings. I can see in apps.yaml you have solcast configured. Have you created a free Solcast account and have the solcast integration installed and configured with your solcast API id? You will also need to create an automation to retrieve the solar forecast on a regular basis, say at 1am, 6am, 12noon, 6pm.
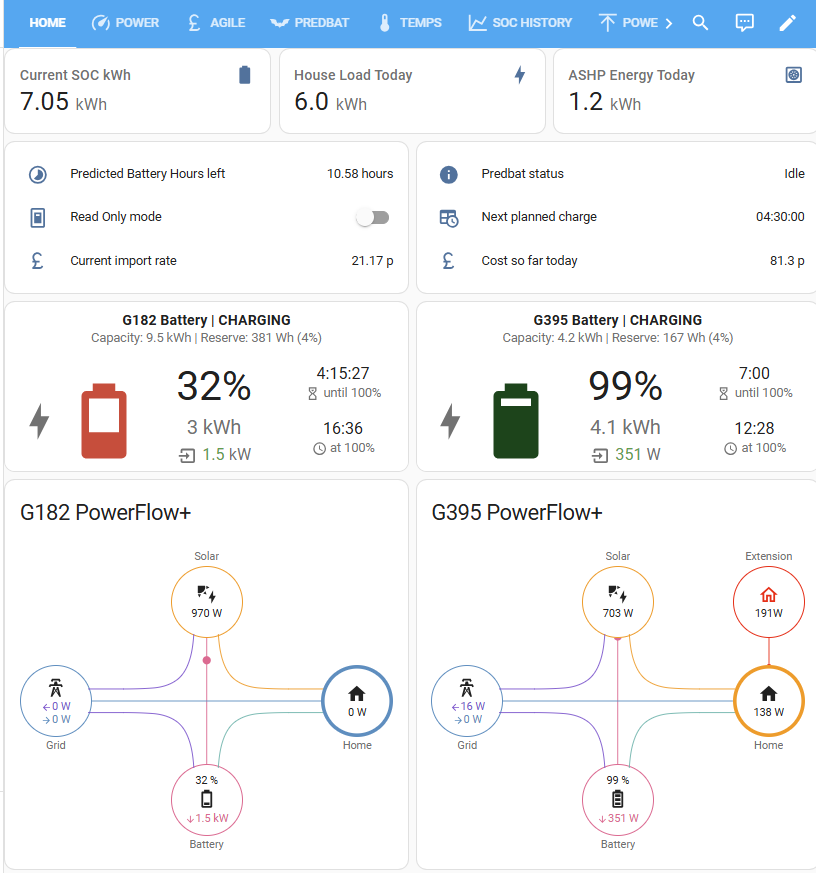
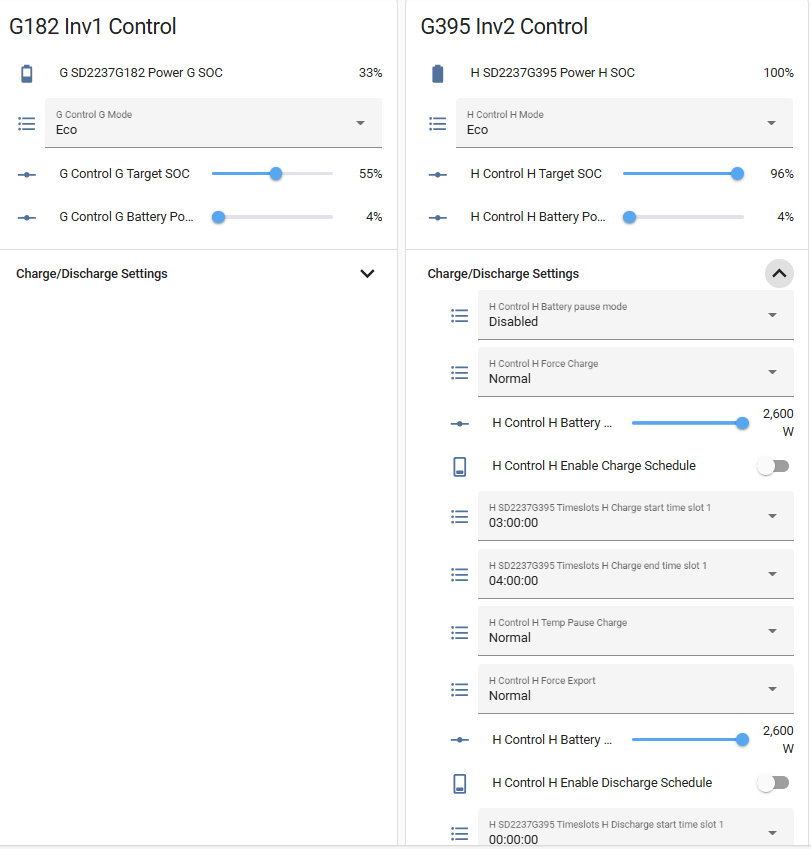
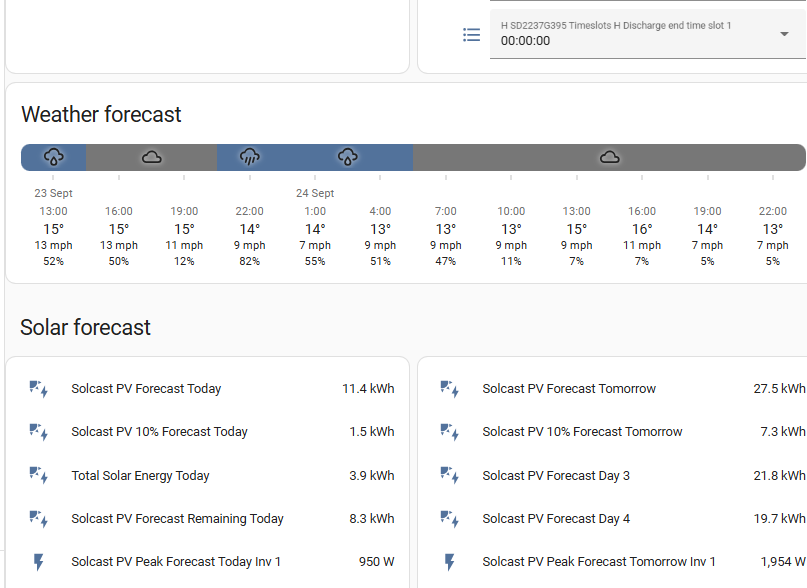
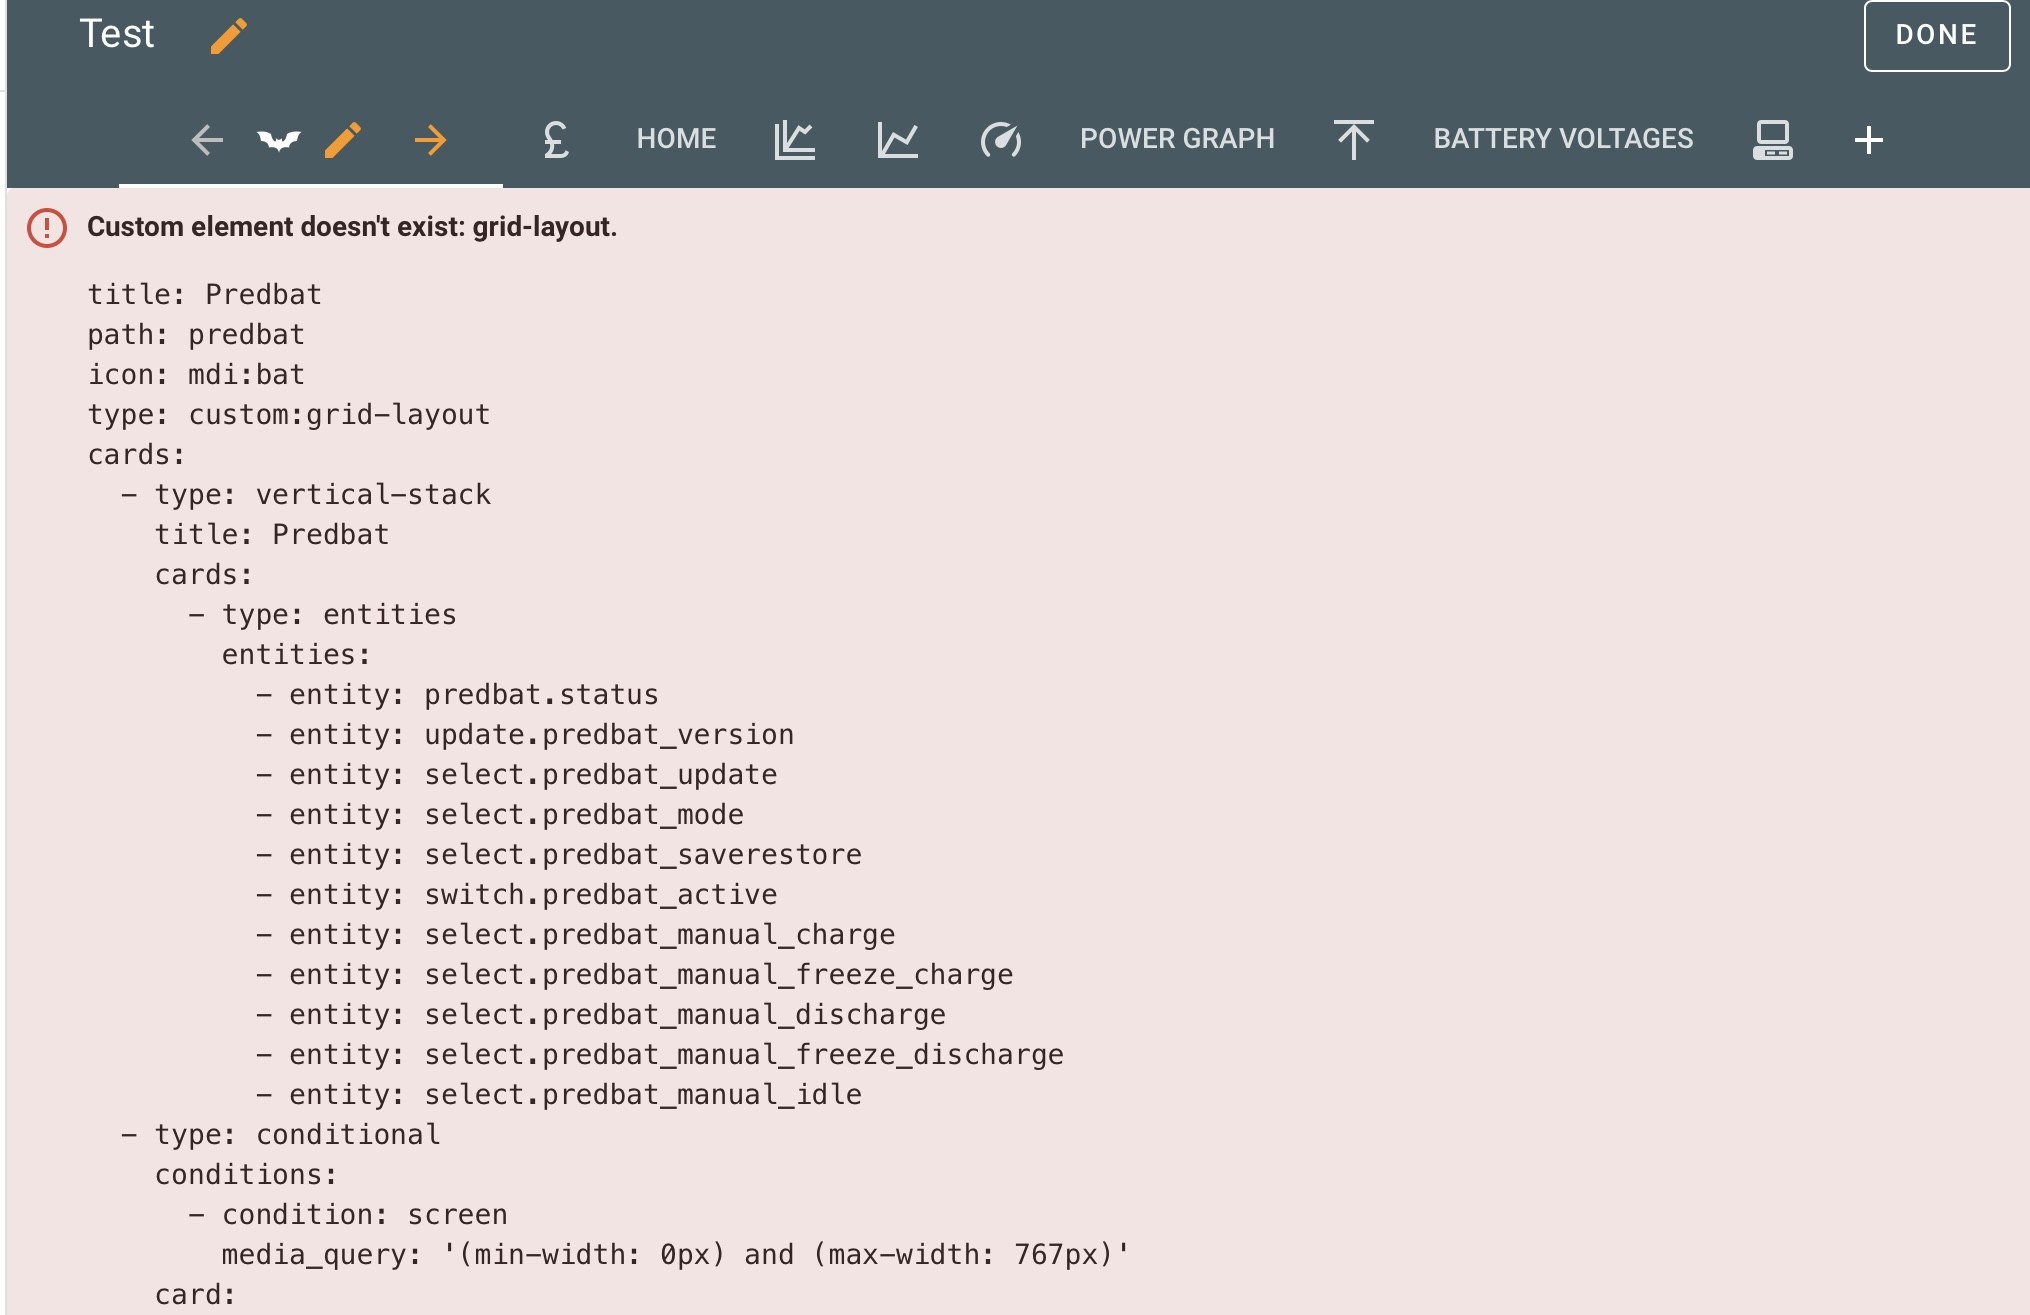
    This is covered in the install instructions.

  3. The rest failures are predbat failing to talk to GivTCP. I see you have givtcp_rest set to 10.0.130.60:6345 - is this the IP address of your HA server (it needs to be)? Assuming its correct then GivTCP is either not running or not working properly. This would explain why there is nothing flowing on the power chart.
    Need to check the GivTCP logs

  4. Warning about Carbon intensity sensor. Do you have the carbon intensity integration installed? Personally I don't use this to optimise my plan so this is commented out of my apps.yaml

Sharing your full apps.yaml and error message like this does make it a lot easier to debug, thanks

D
#8 Daveb01

geoffreycoan

Thank you for the advice (I am very frustrated when it’s not obvious what to do)

  1. Ok thank you will disregard as you say
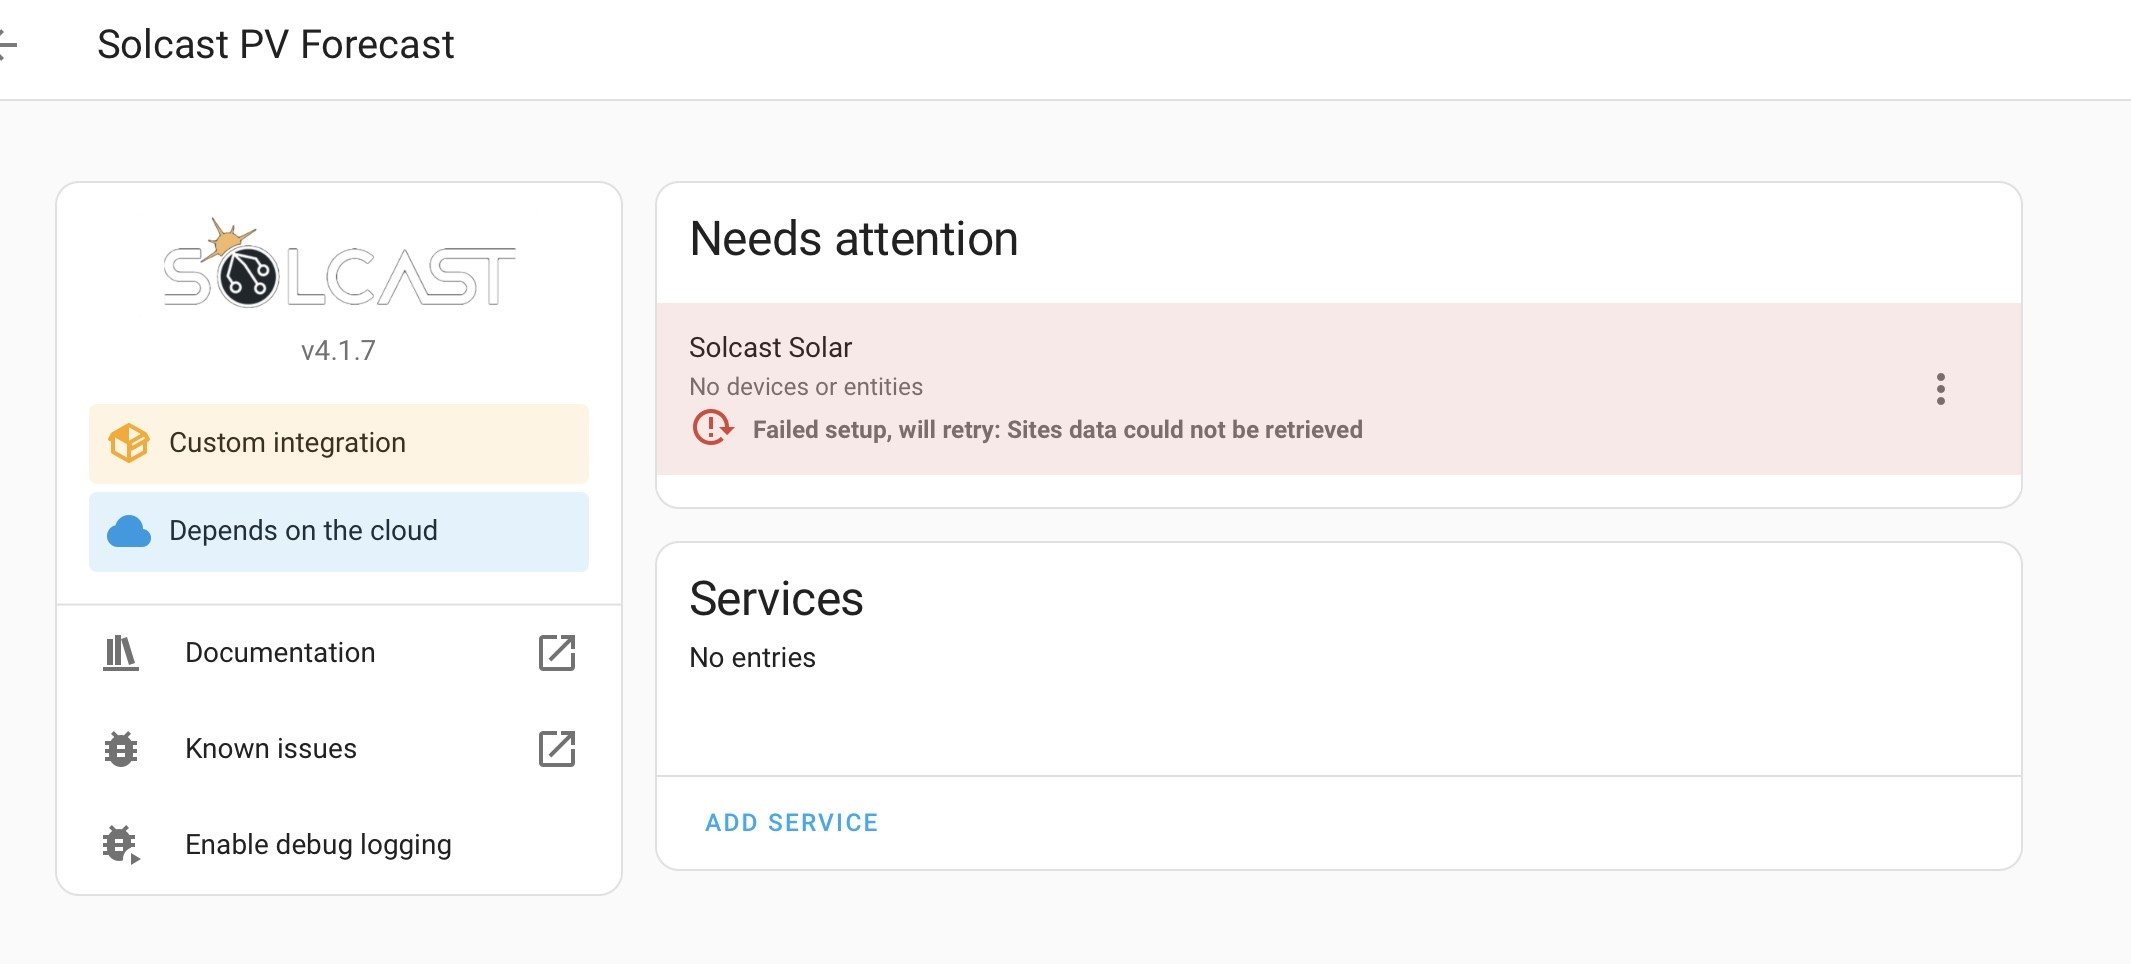
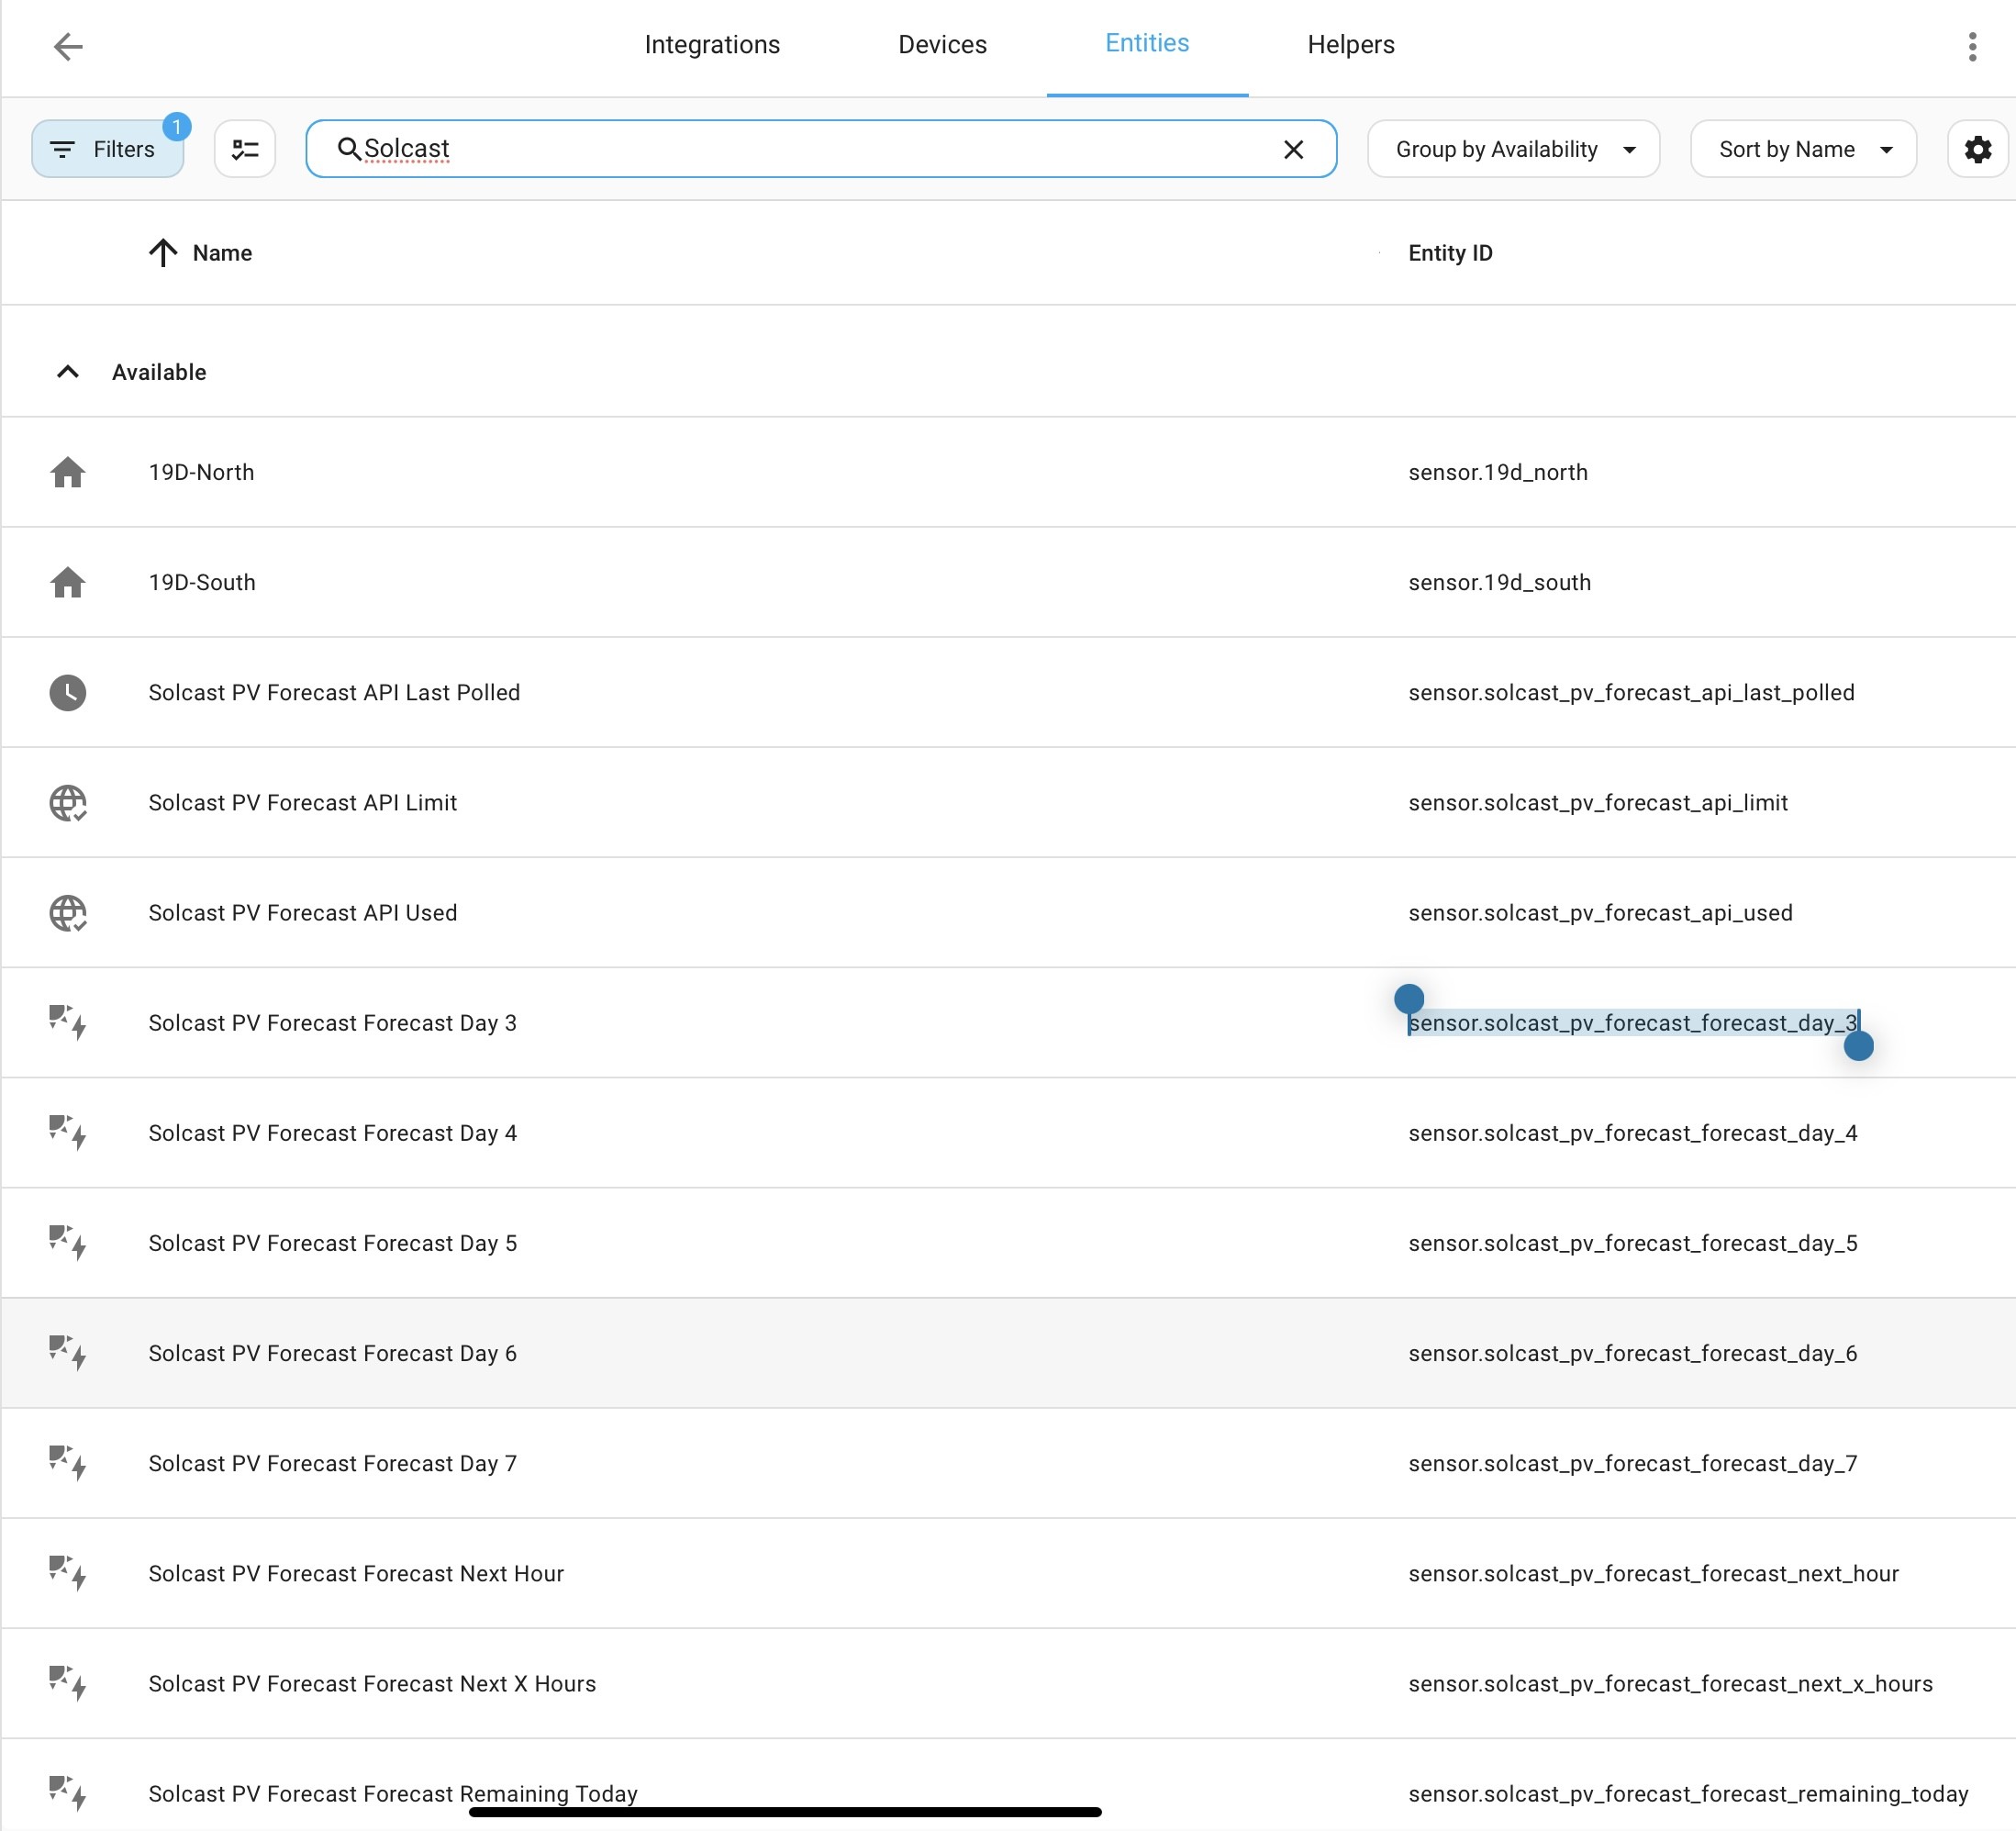
  2. I have followed the instructions and I get this (see pic). I also checked the yaml (see pic), I have tried to set up the automation and think because Solcast is not working I can not sort that either, your expert advice needed please
  3. I don’t know how to sort this either (will 2 above be affected as well if this is not working.
  4. Commented out (easy one to do)


G
#9 geoffreycoan

Daveb01

  1. Solcast isn’t setup correctly so thats why you are getting the no solar forecast error in predbat. Did you click the three dots and configure and set your API key - see https://github.com/BJReplay/ha-solcast-solar?tab=readme-ov-file#Configuration ? Make sure you put the right API key in, its your account api key not the sites key.

If you go to settings / system / logs and click on ‘load full logs’ you should see more detailed information from the solcast integration when it starts up.

  1. But solcast not working isn’t going to affect givtcp not working, thats a different issue.

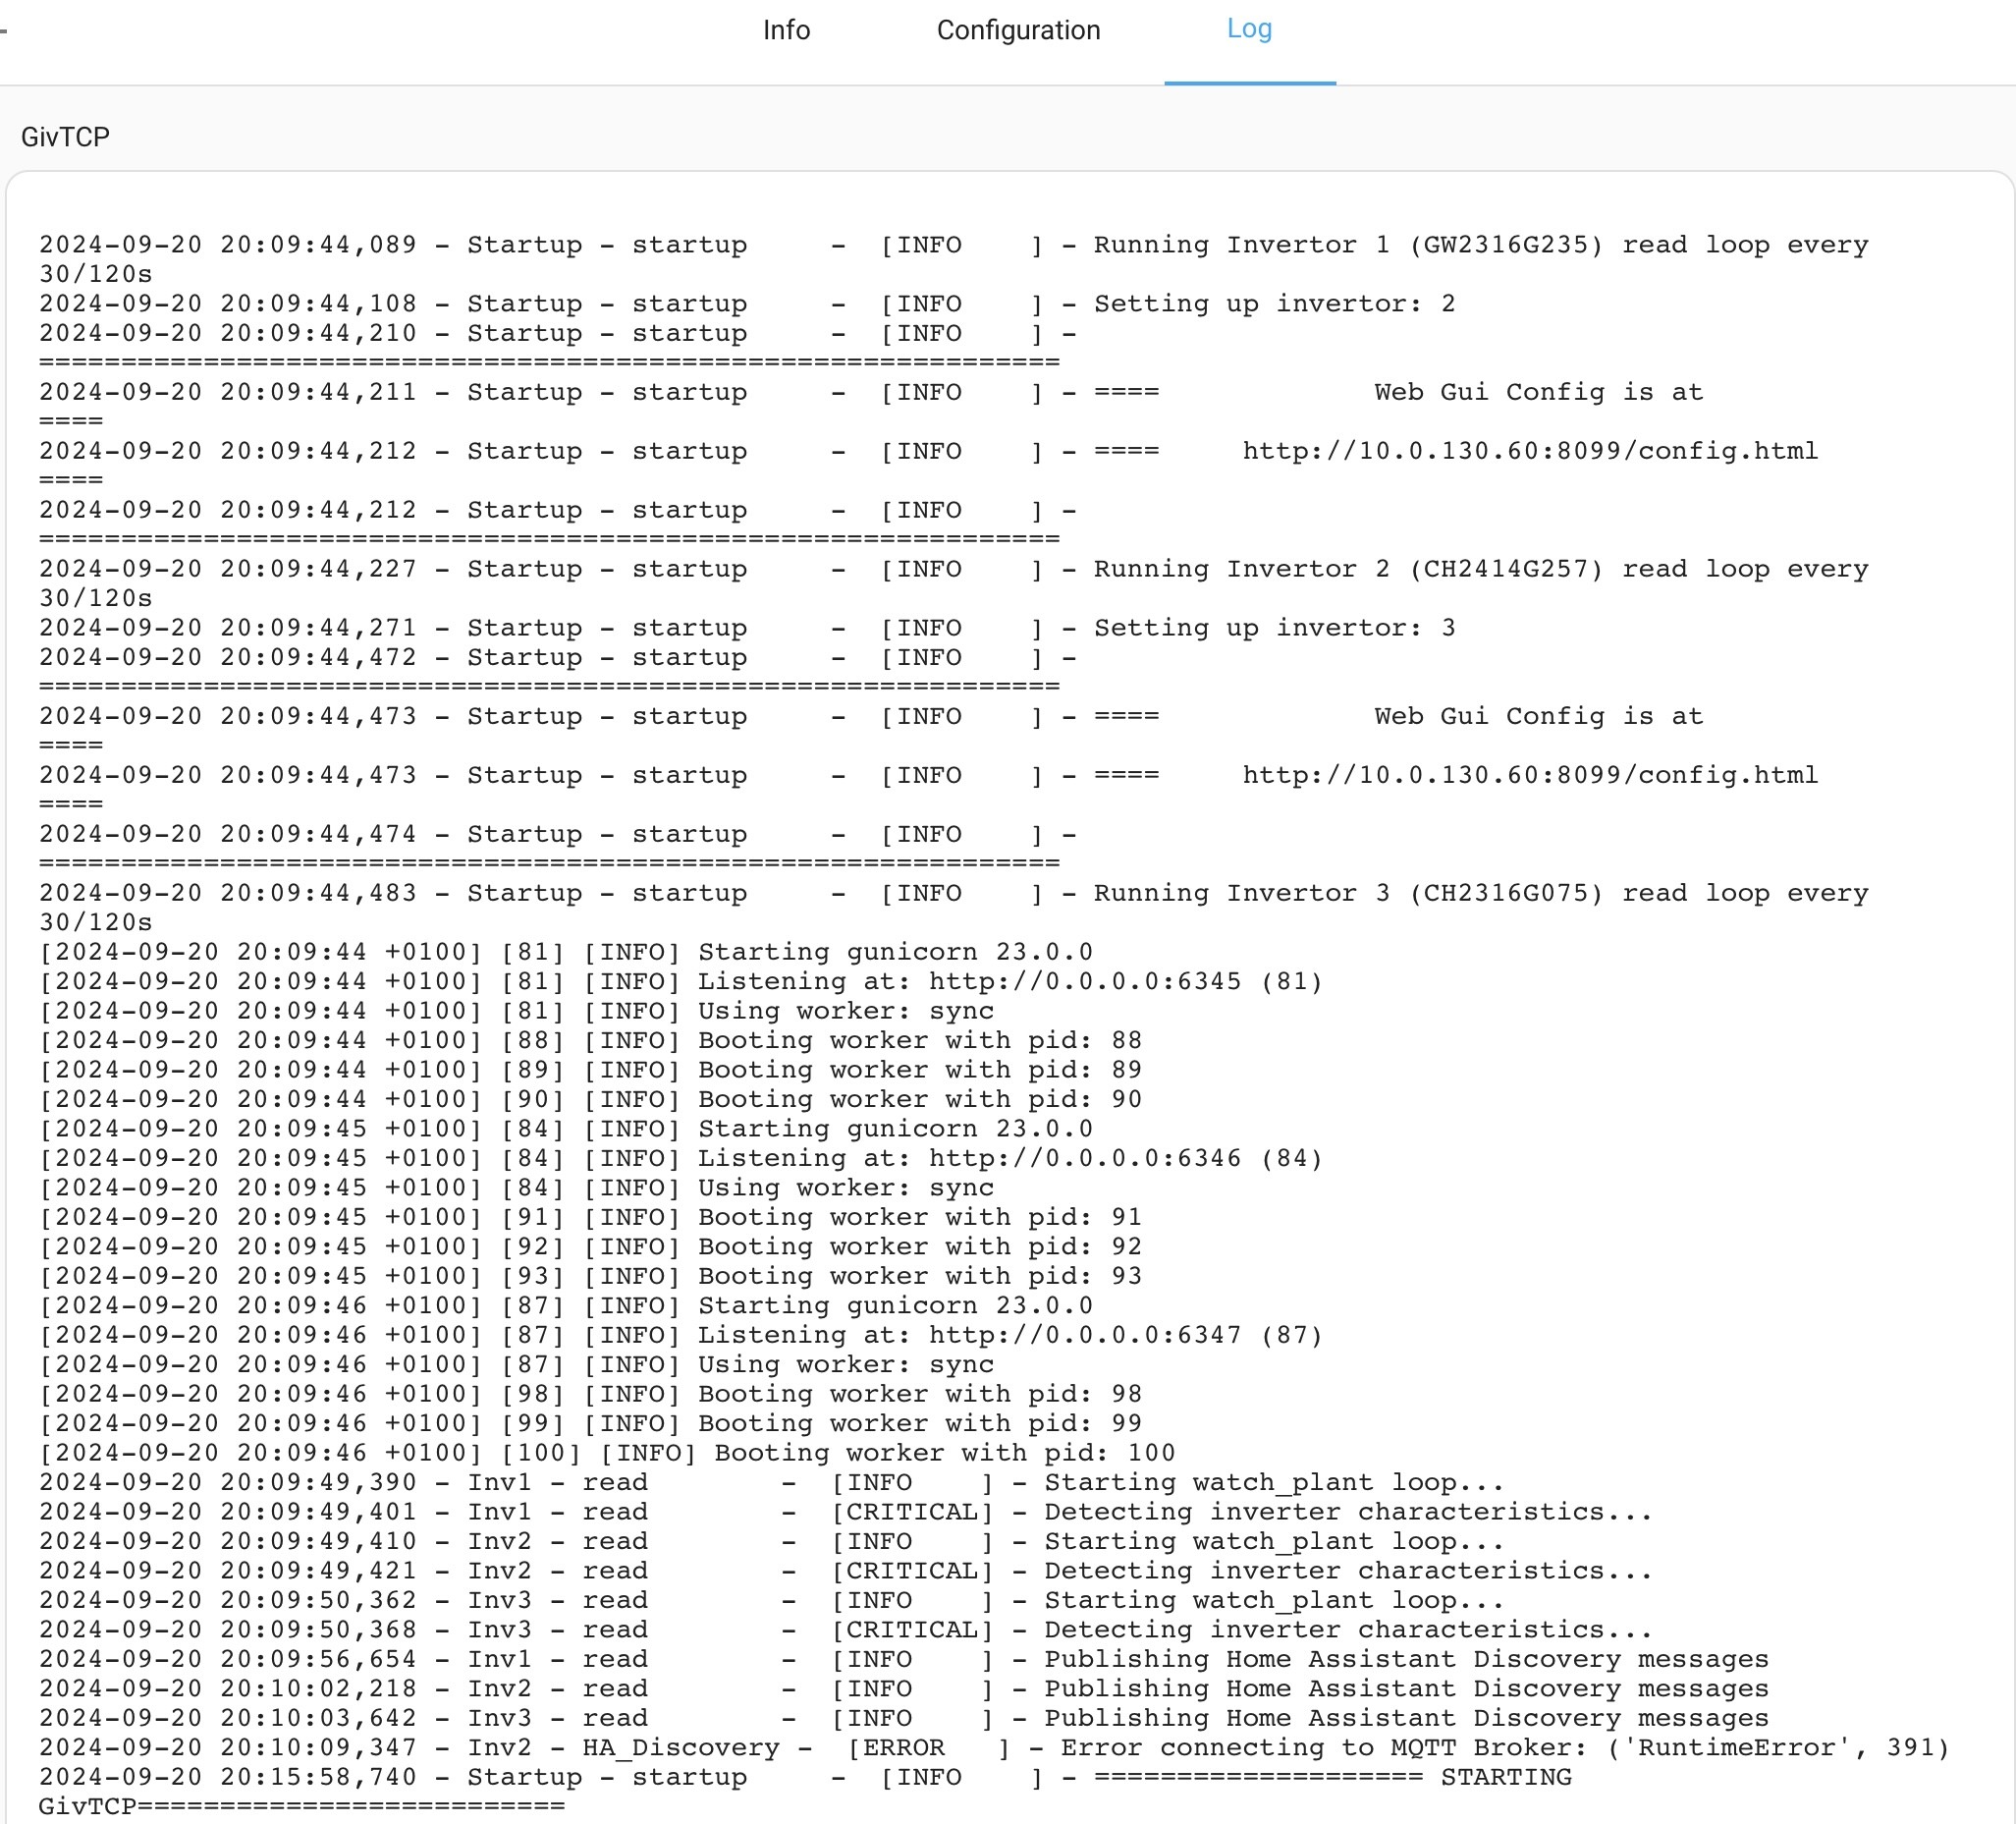
Go to Settings / addons / givtcp and click on the ‘log’ tab, what do you see? I’m guessing an error with givtcp running in some way

D
#10 Daveb01

geoffreycoan

Solcast now working, I did what you said I had done, wrong api.

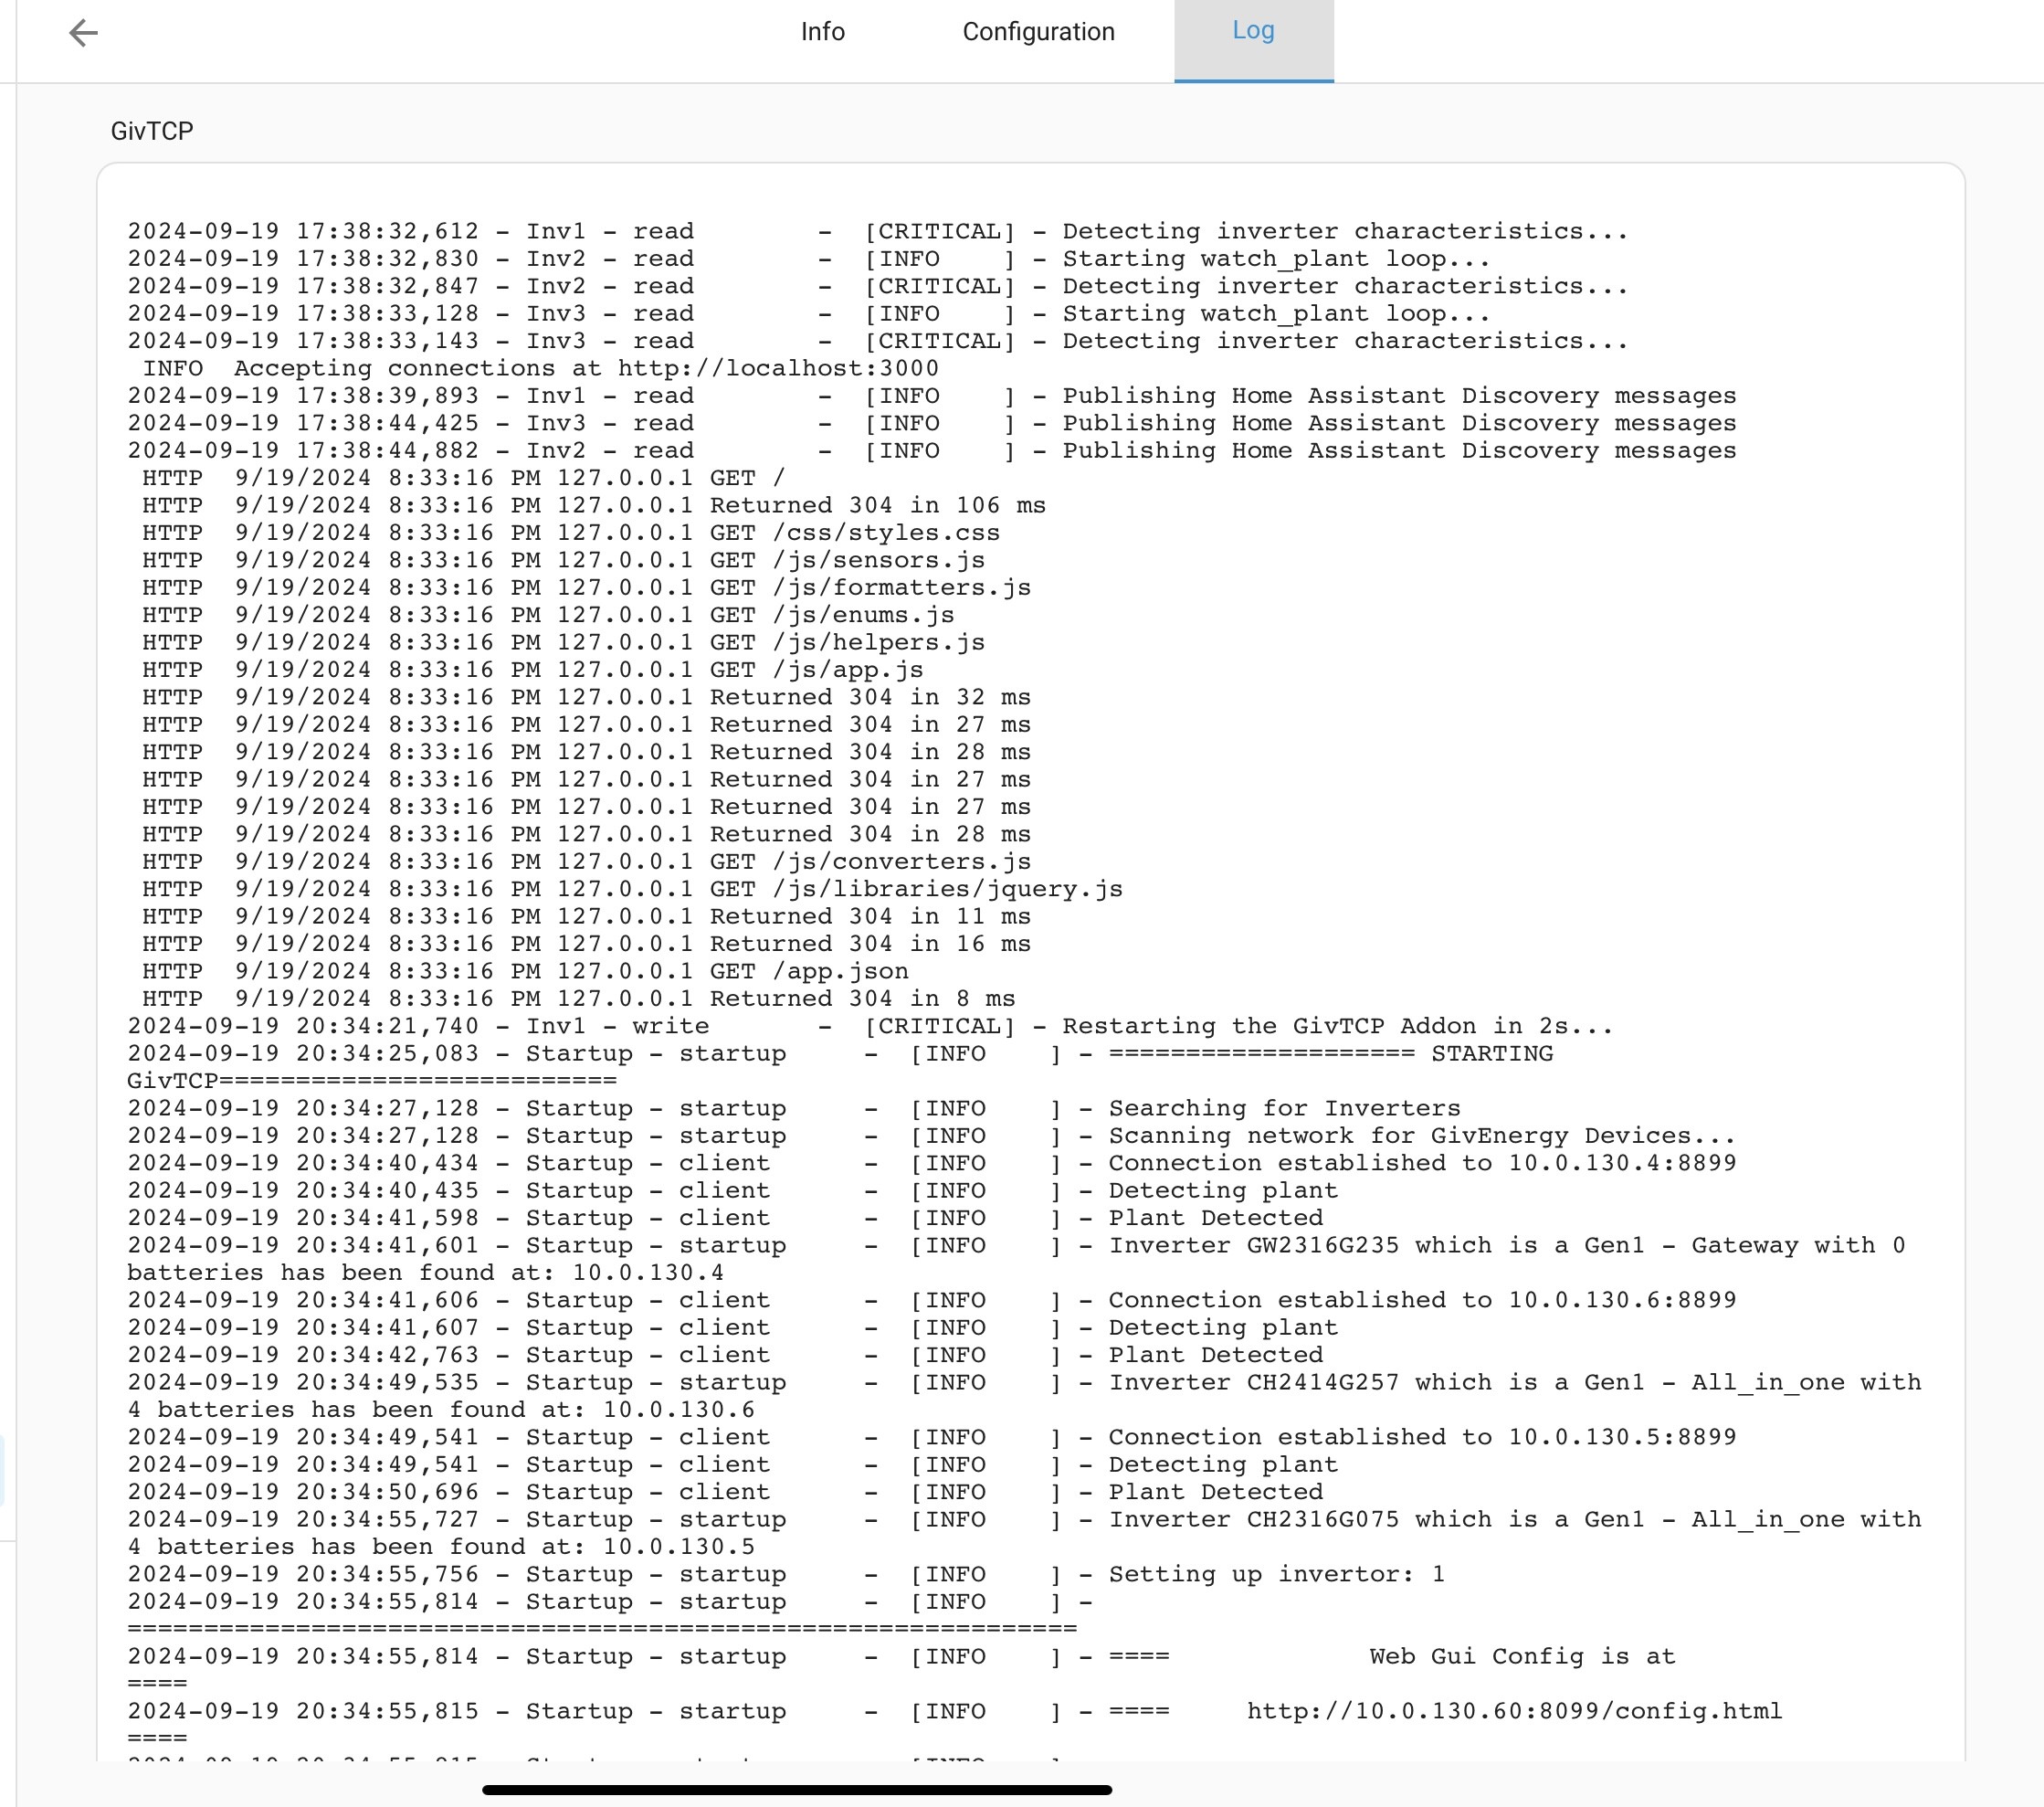
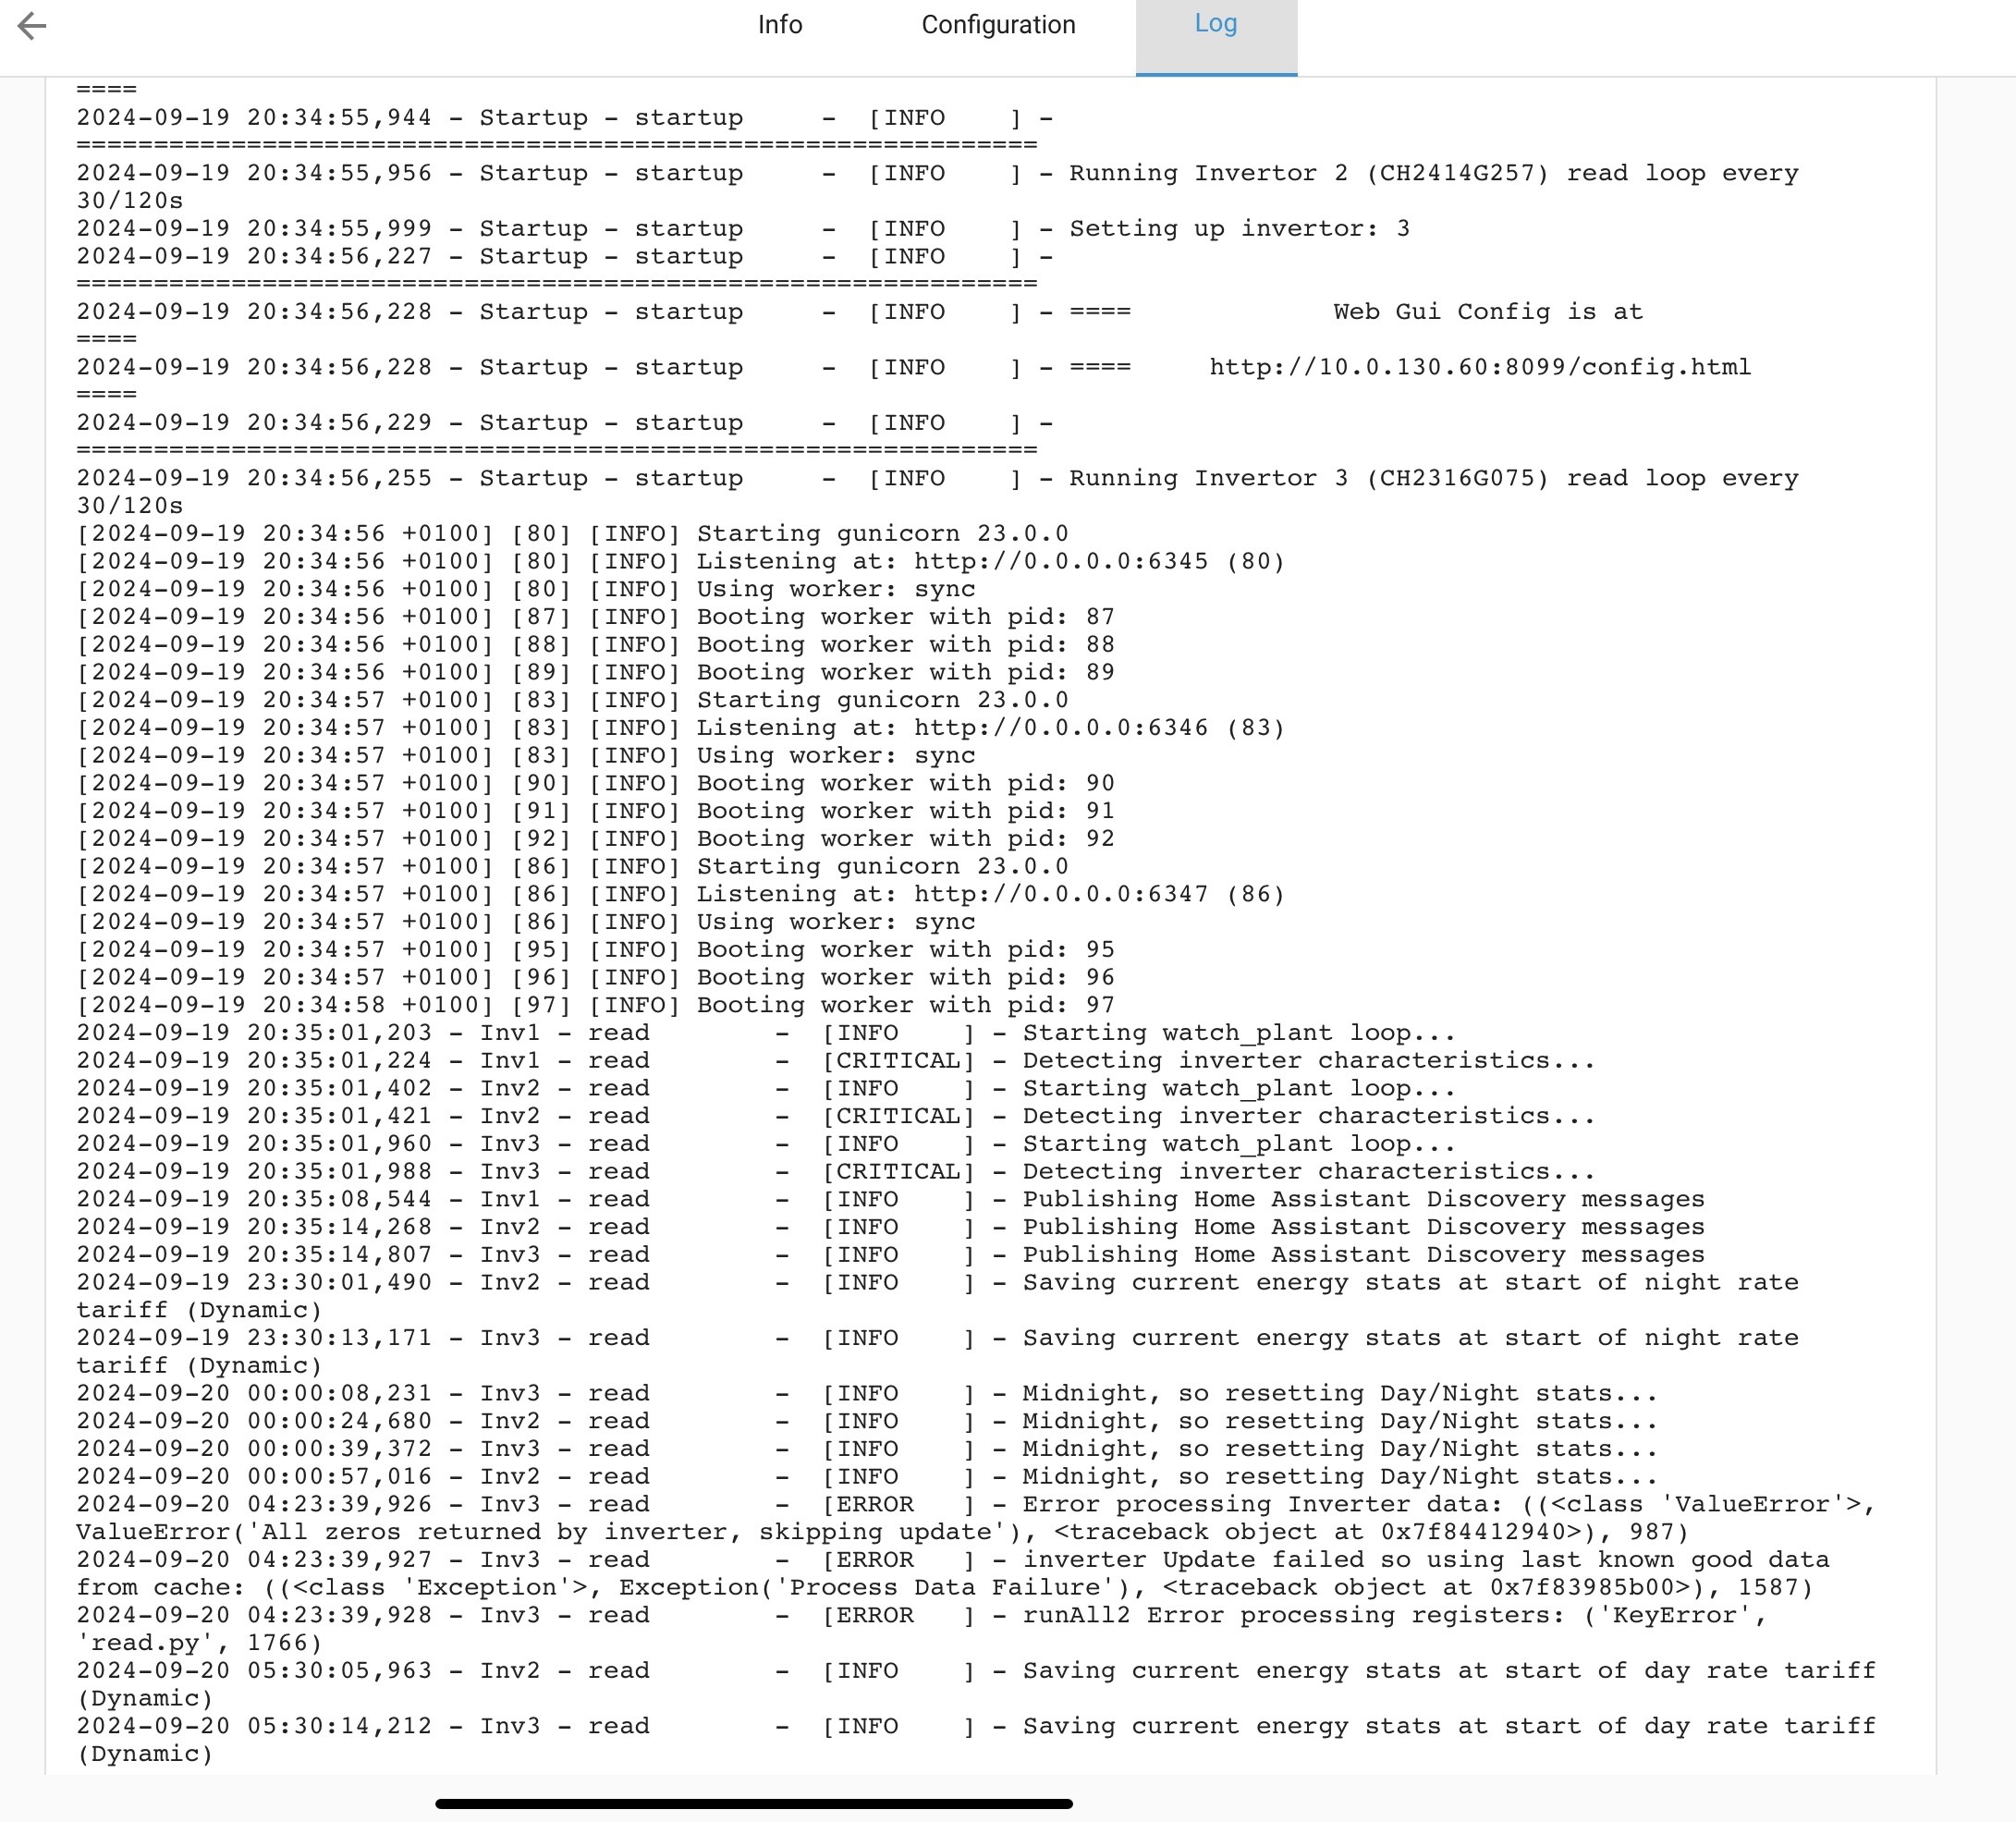
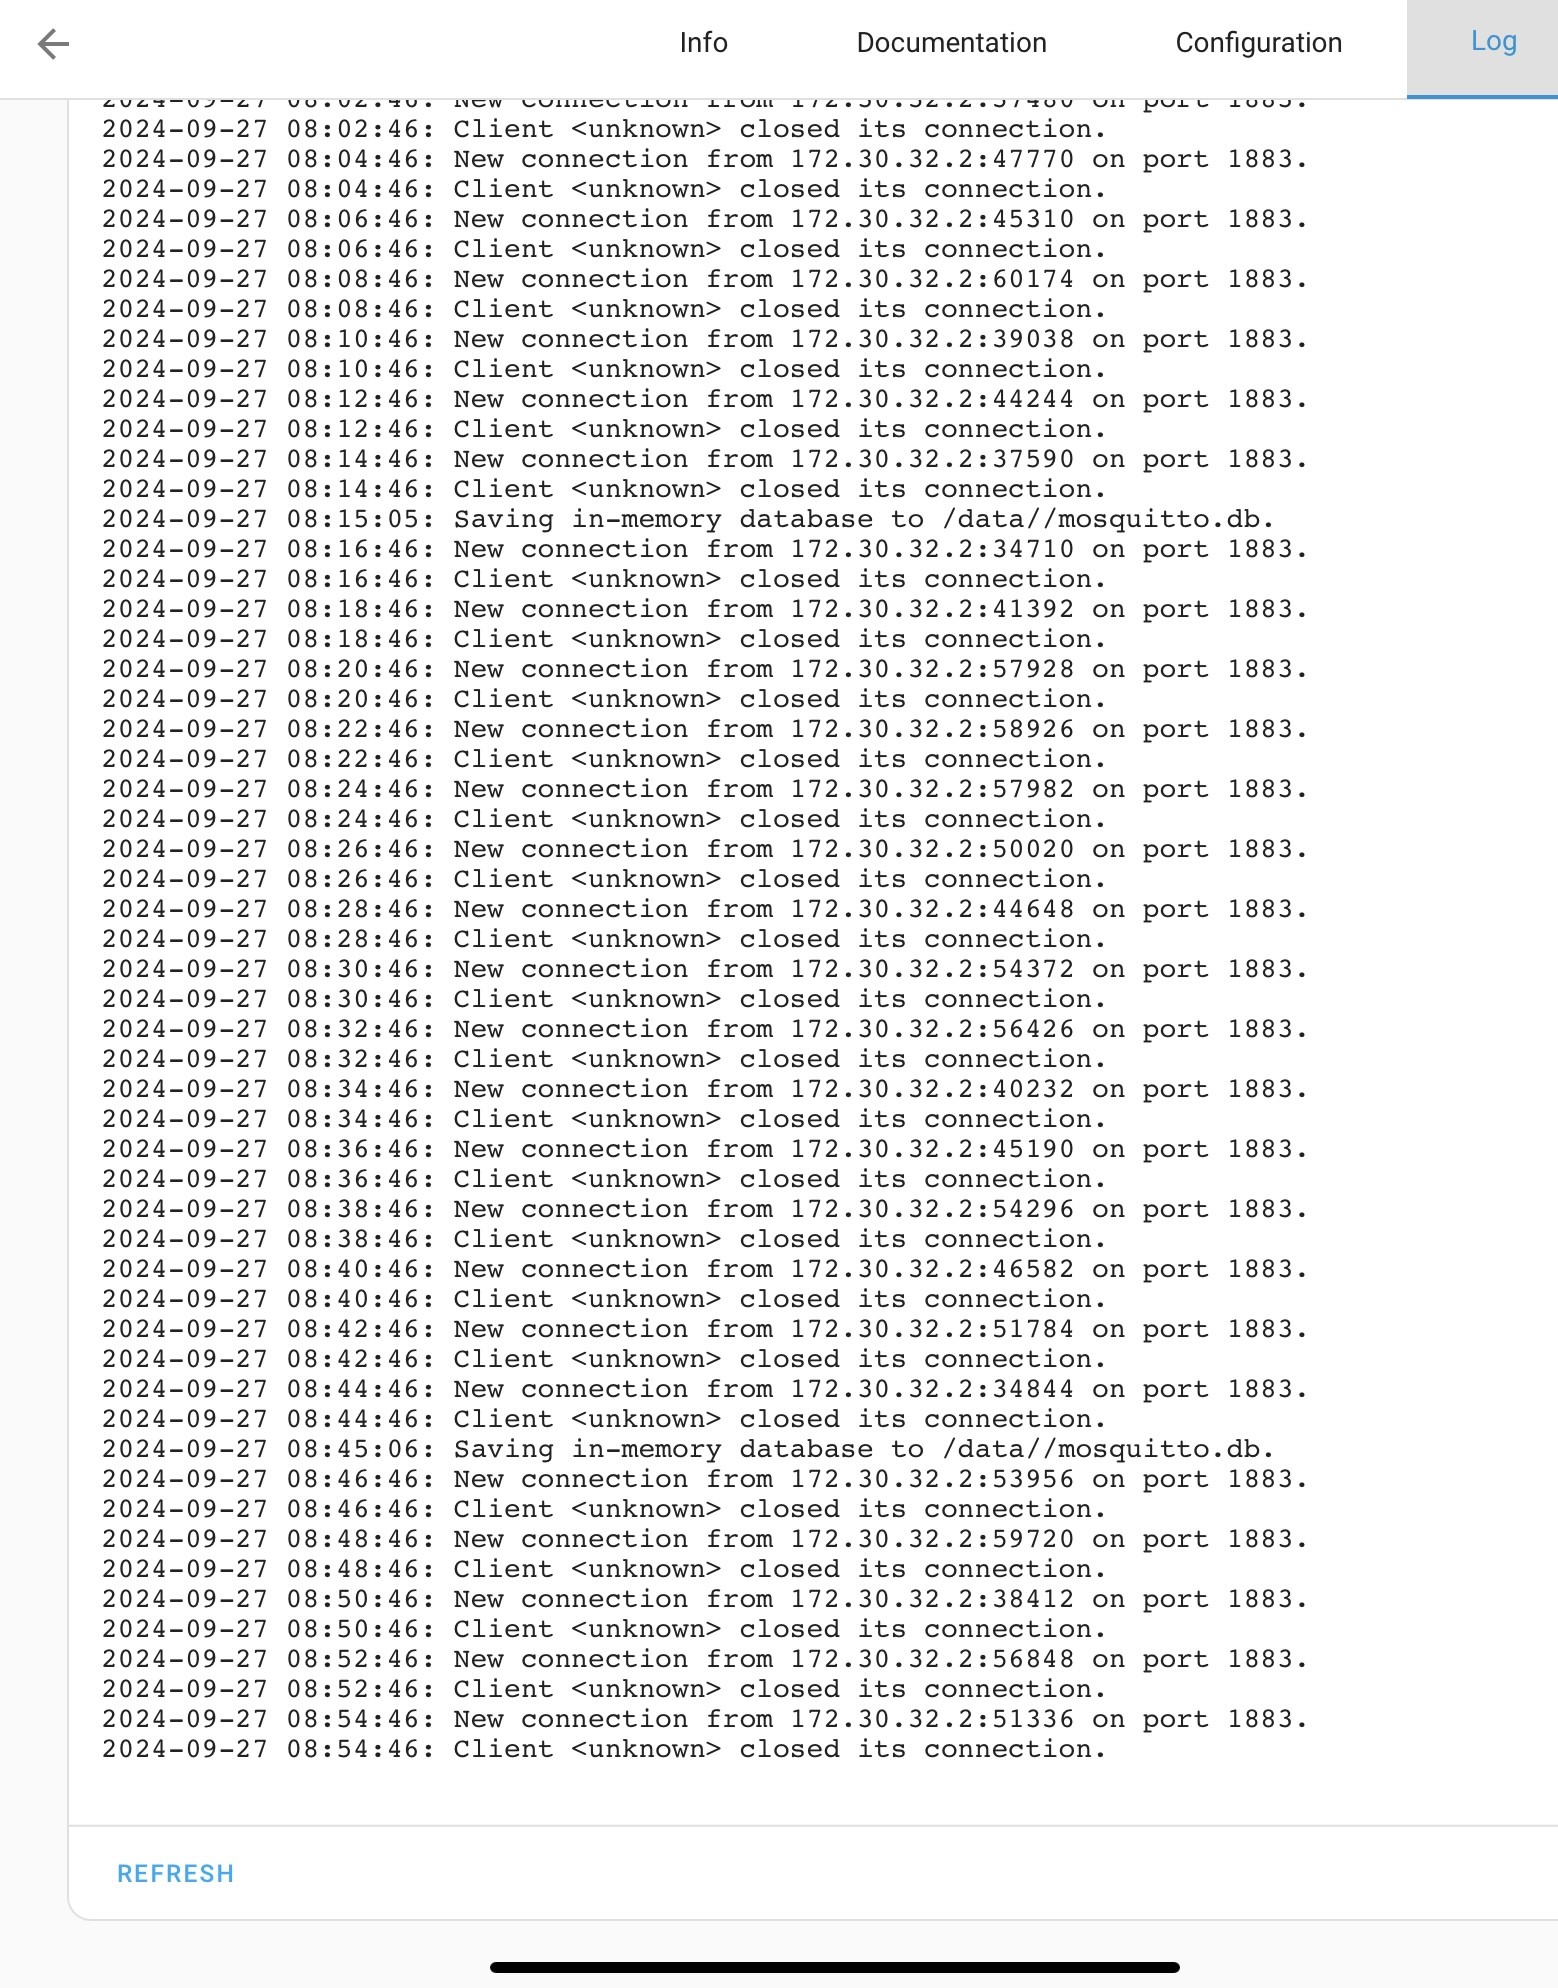
Here are the logs from GivTCP


G
#11 geoffreycoan

Daveb01 OK, the givtcp logs show a couple of errors but not a stream of them, which makes me think that it is working OK.

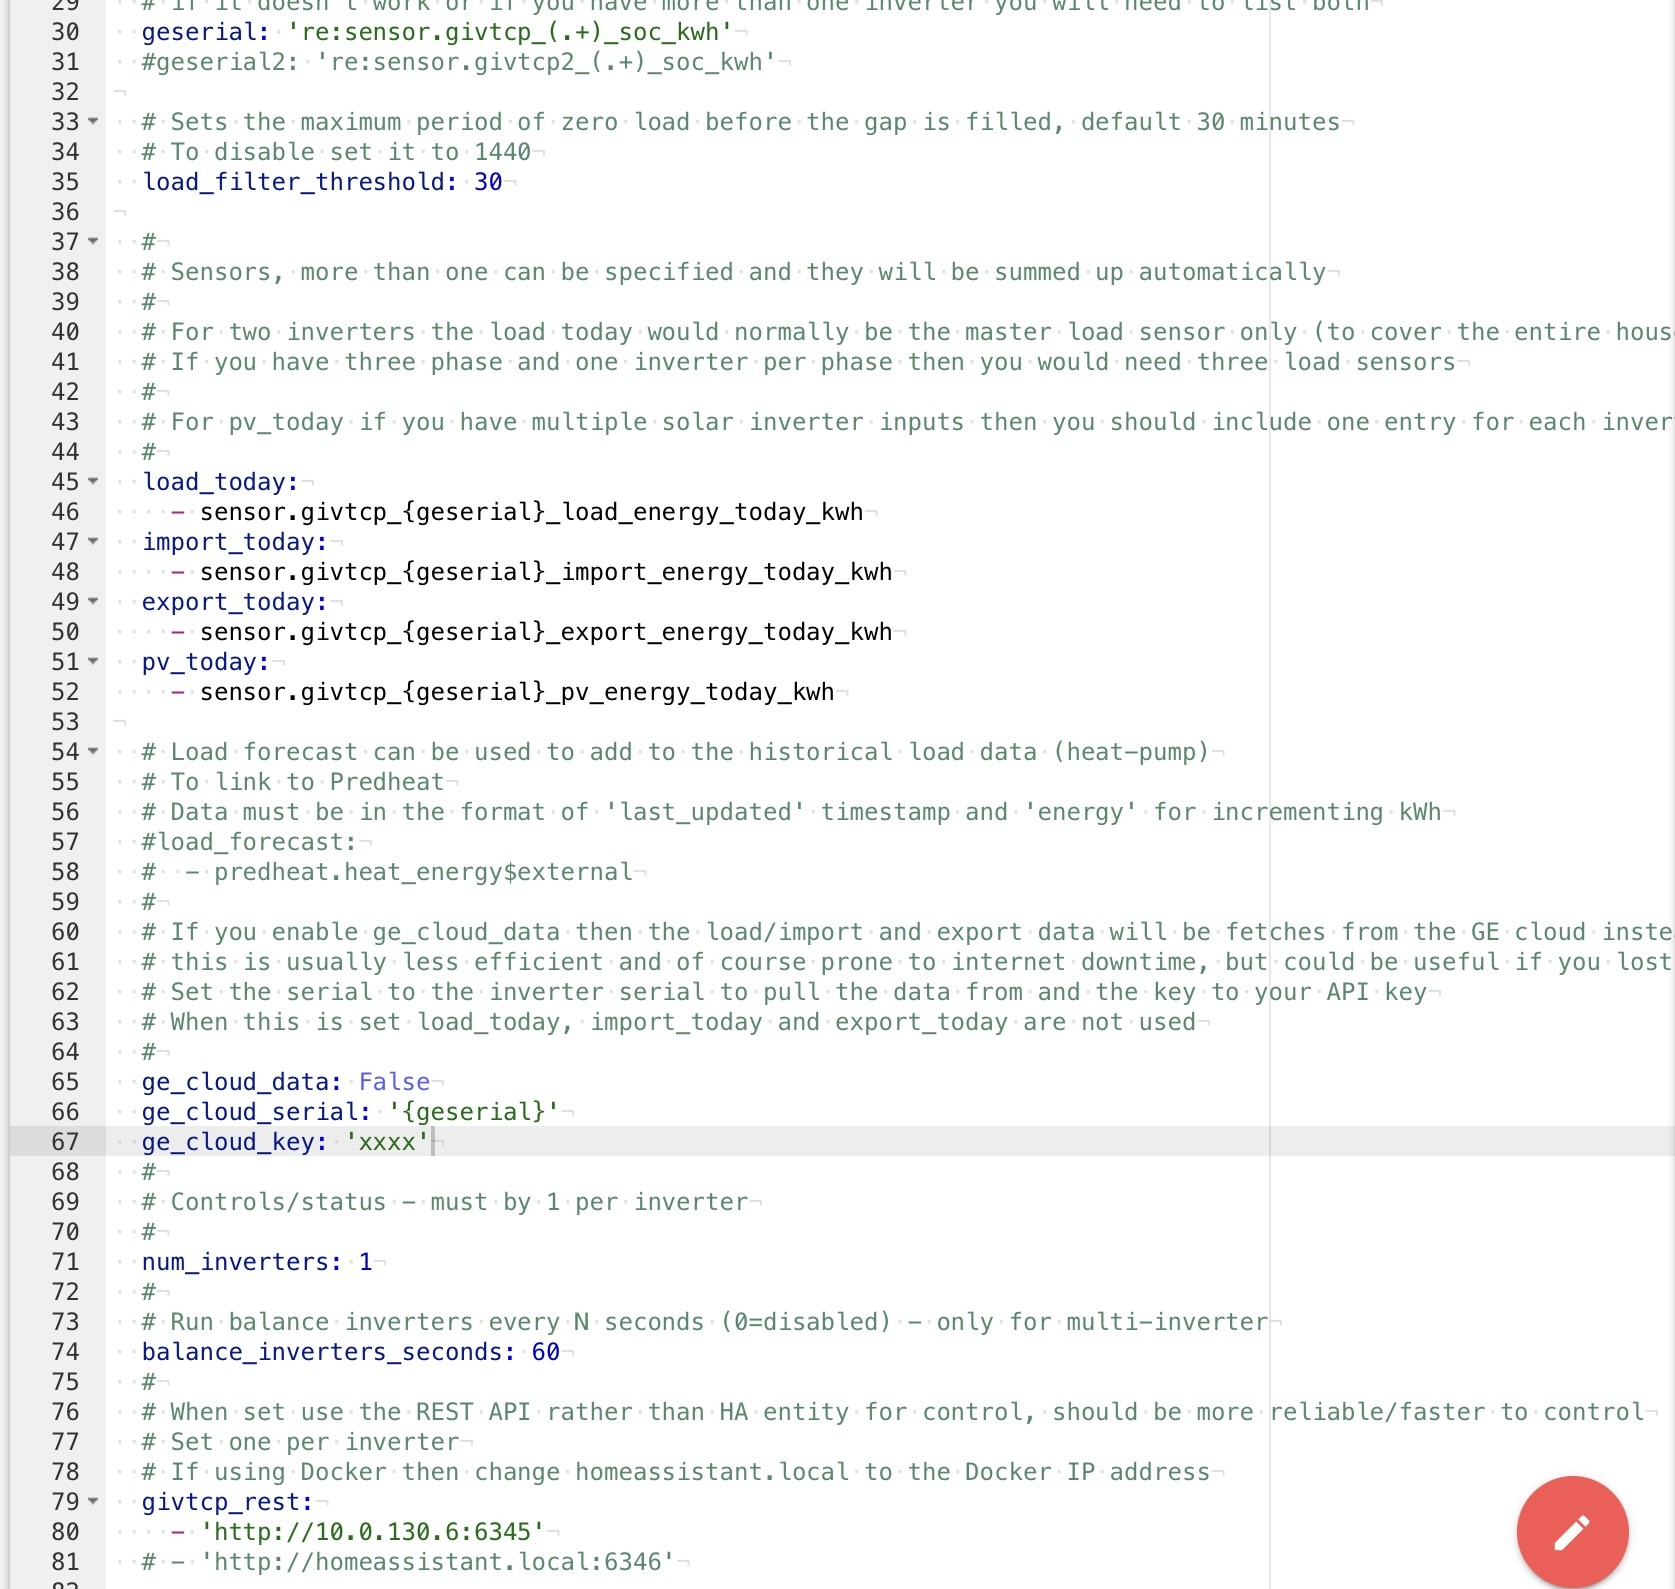
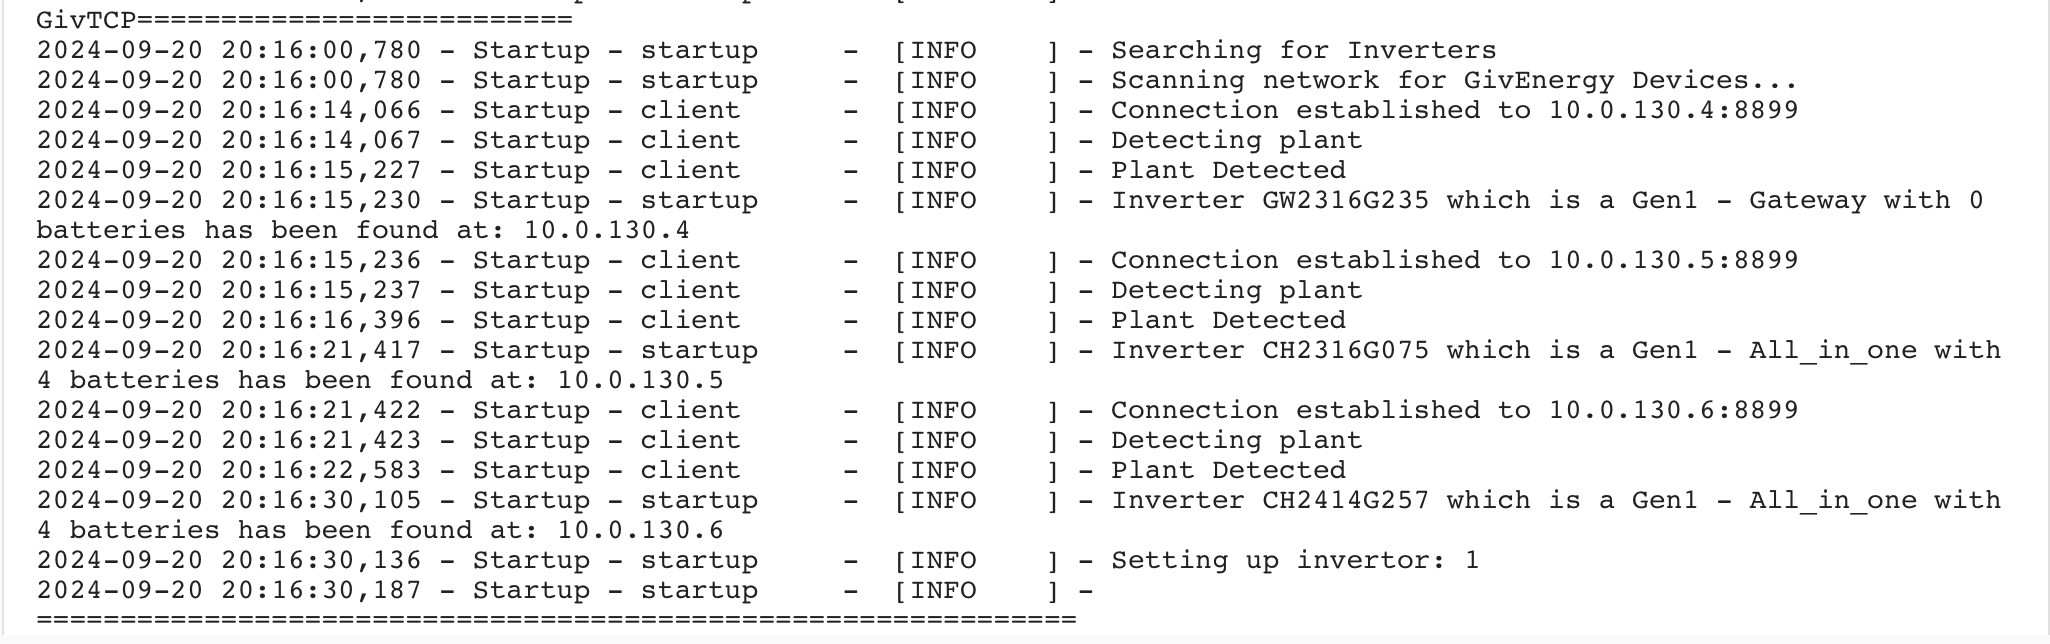
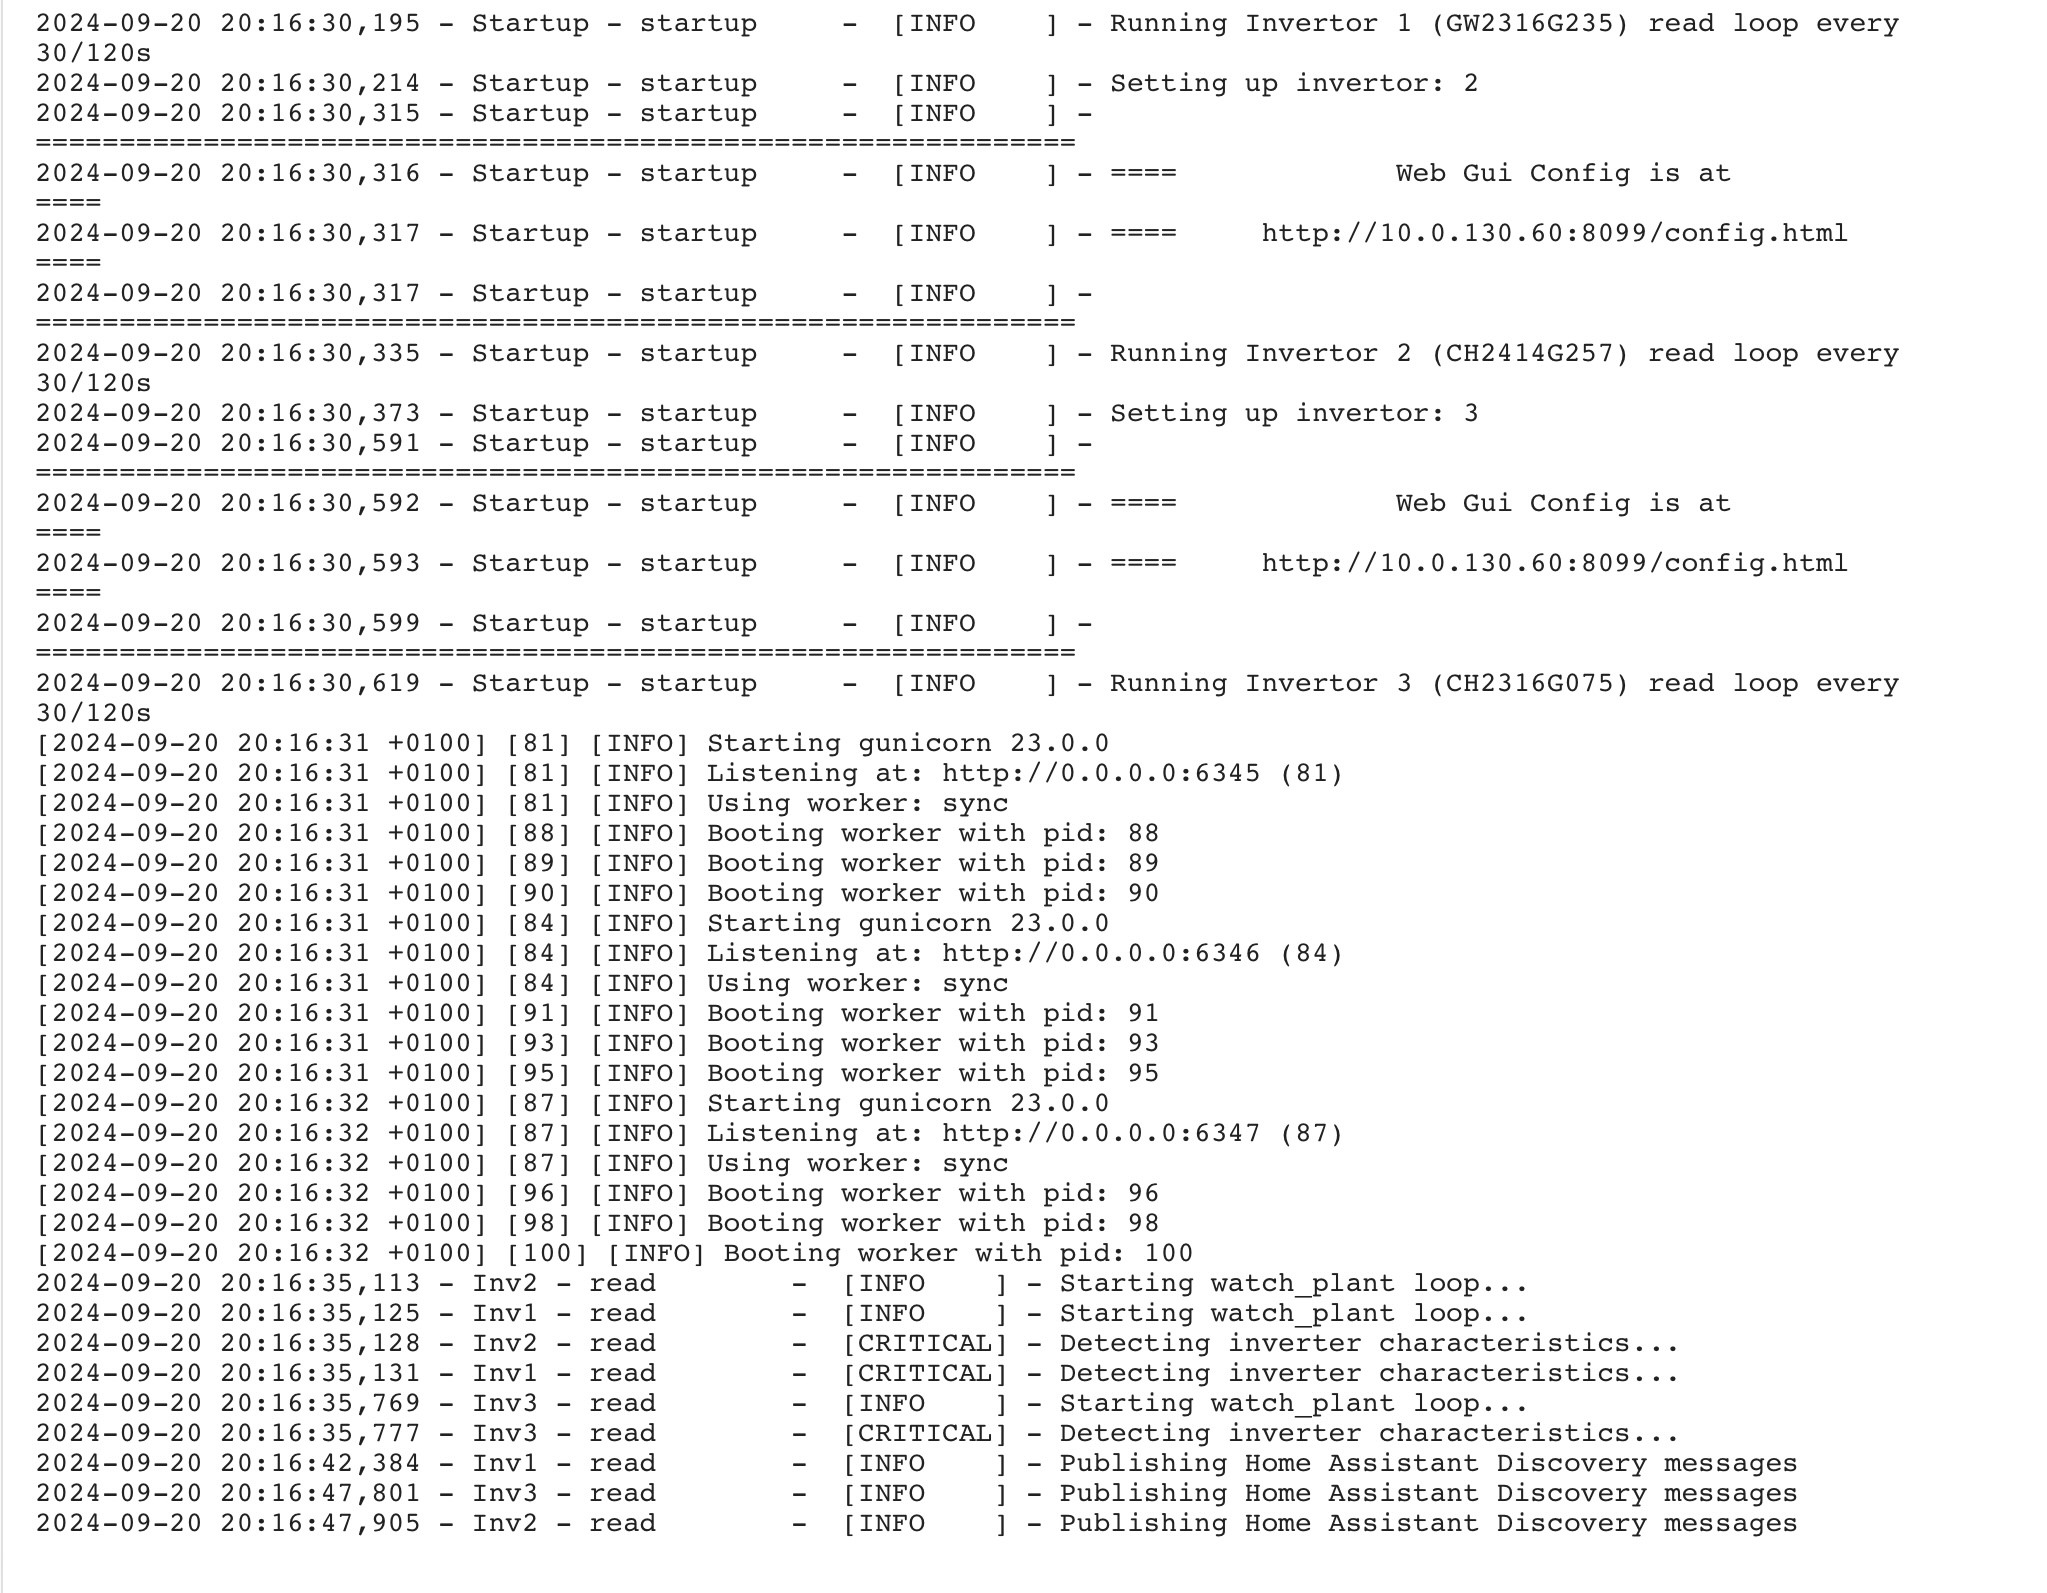
I can see why predbat is not talking to GivTCP, in apps.yaml the givtcp_rest config line 83, you have the address as 10.0.130.60, but in the GivTCP log it says that the gateway is at 10.0.130.6

Side question: Have you sent your AIO and gateway to fixed IP addresses on your wifi router? Recommended that you do so as it’ll keep your network consistent.

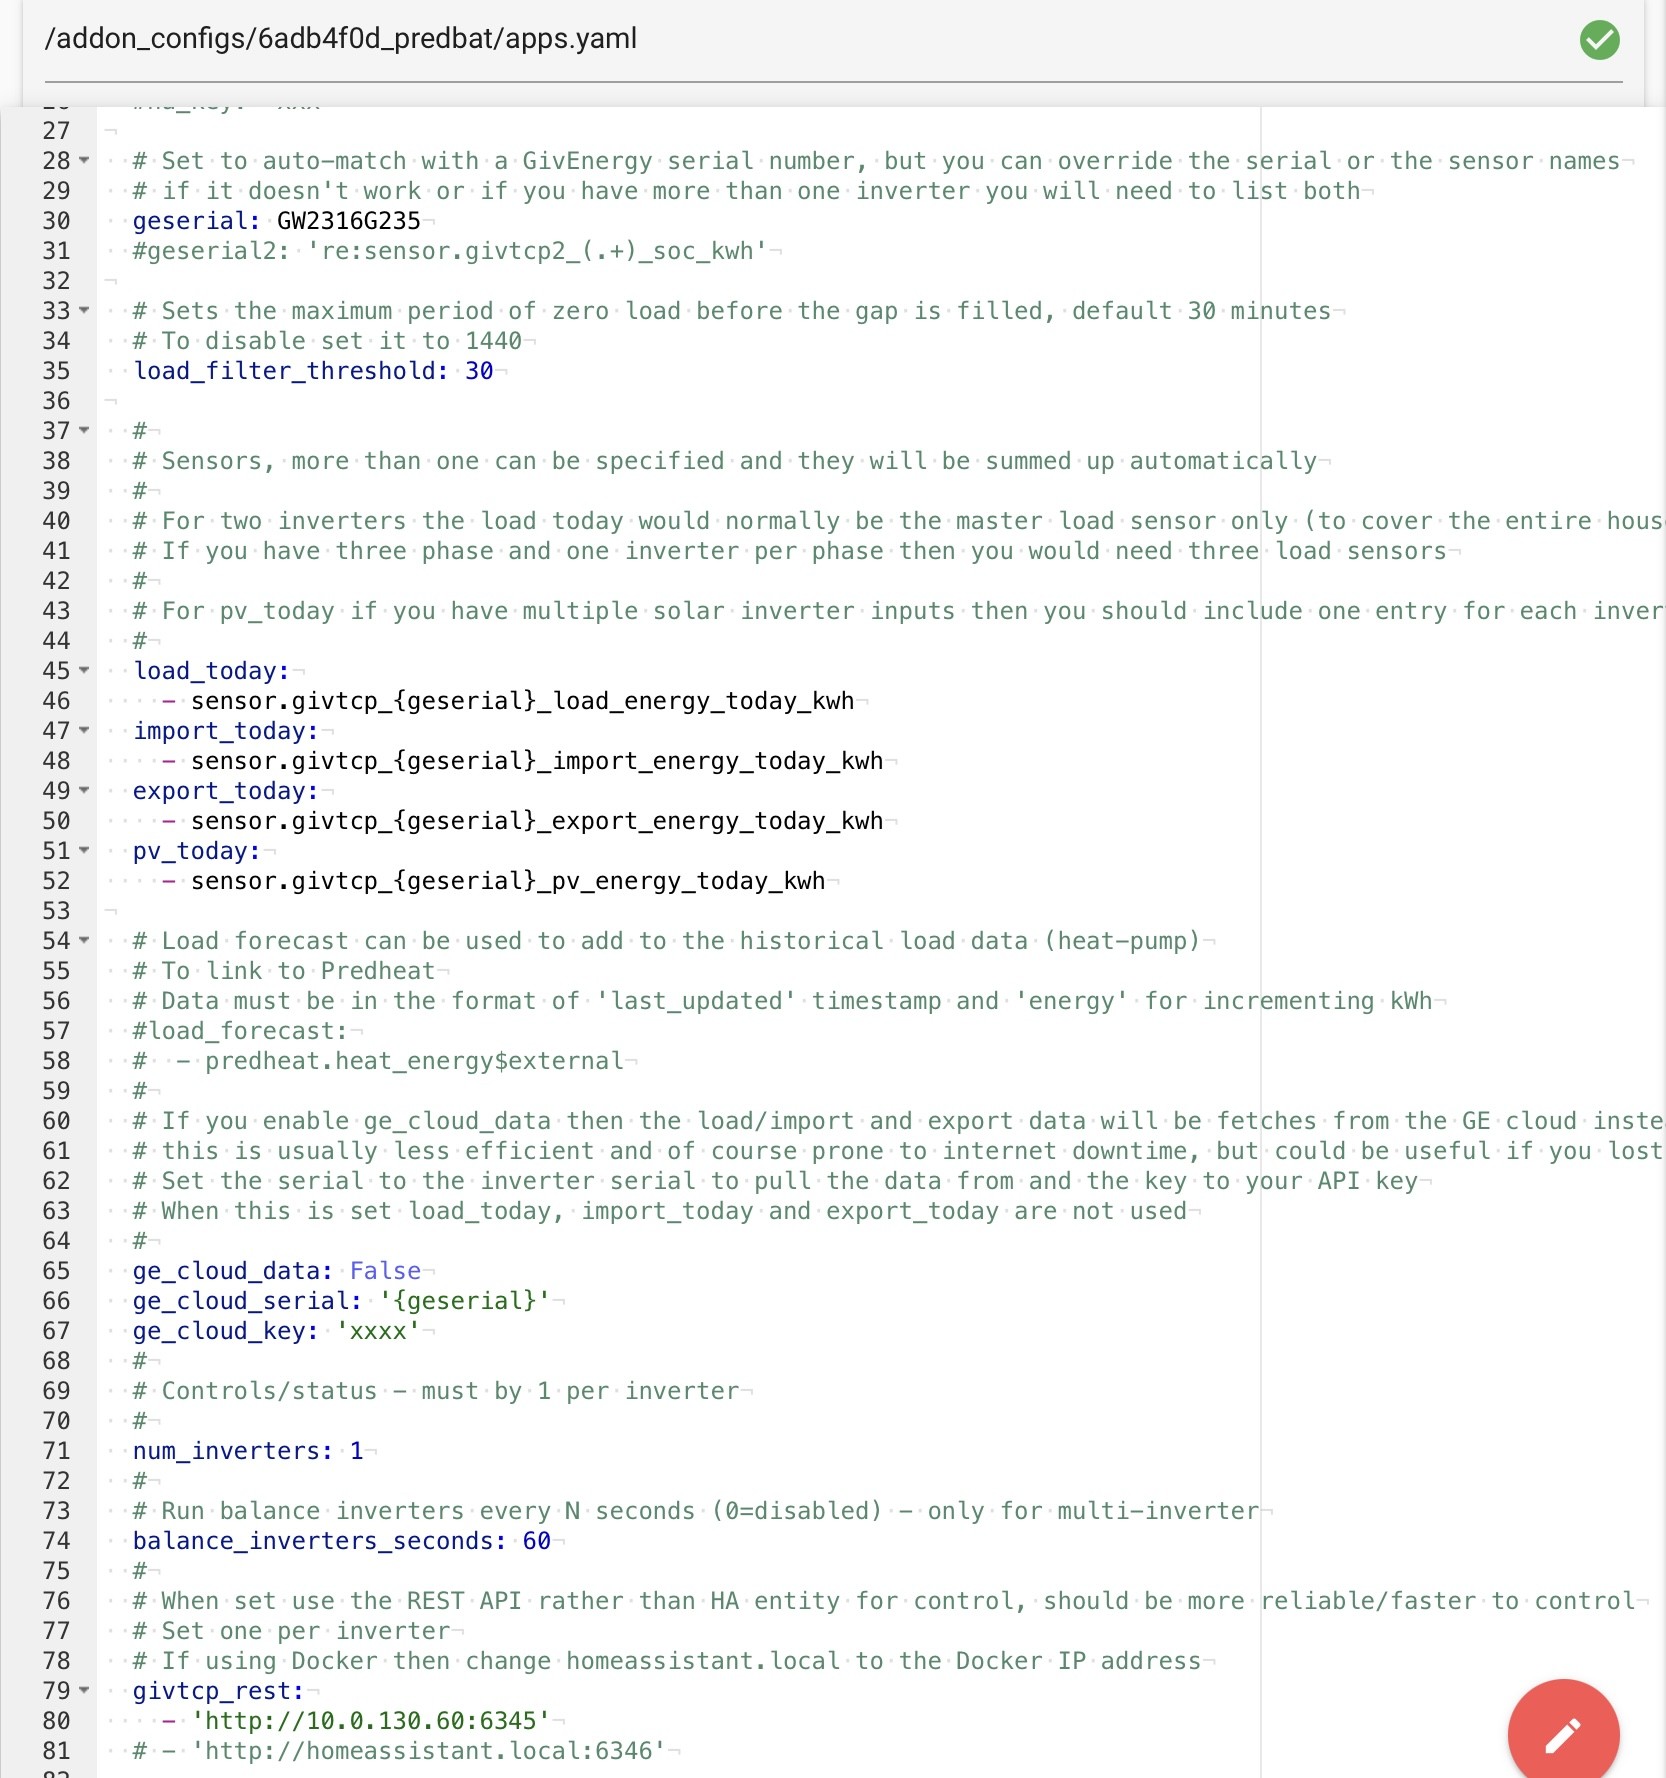
Suggest you change row 33 of apps.yaml. The template tries to work out the serial number of your inverter, but I suspect it won’t get your gateway serial number automatically and may well pick something up off an AIO. So just change it to set geserial to your gateway serial number (GW2316G235)

Change the IP address and geserial in apps.yaml and hopefully predbat should start talking to your AIO.

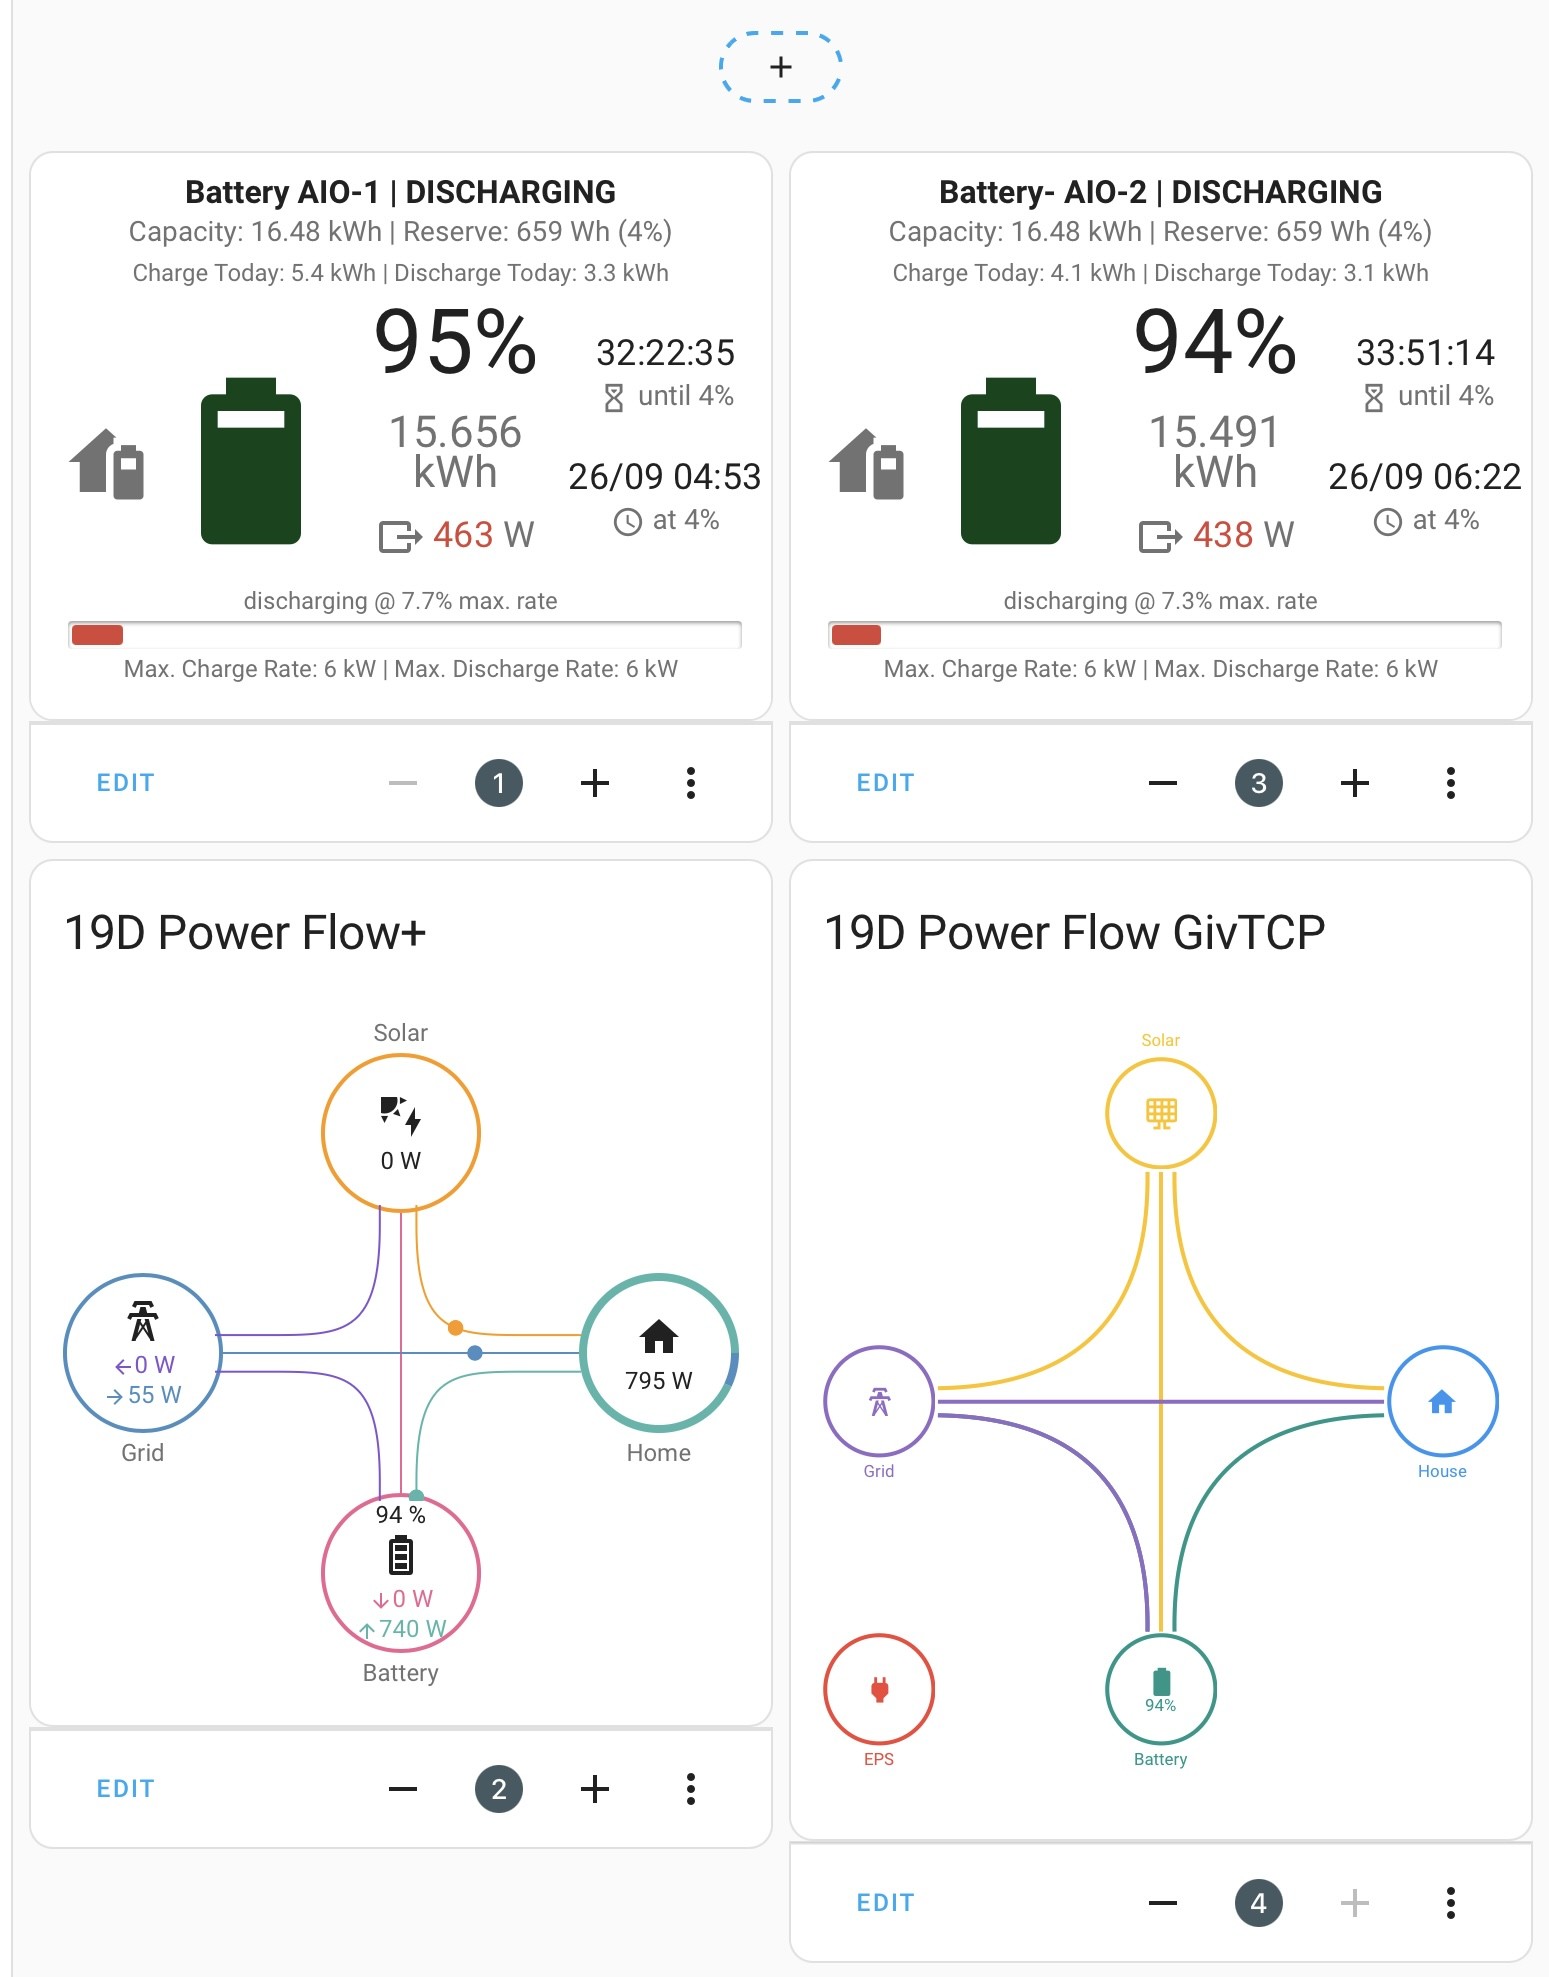
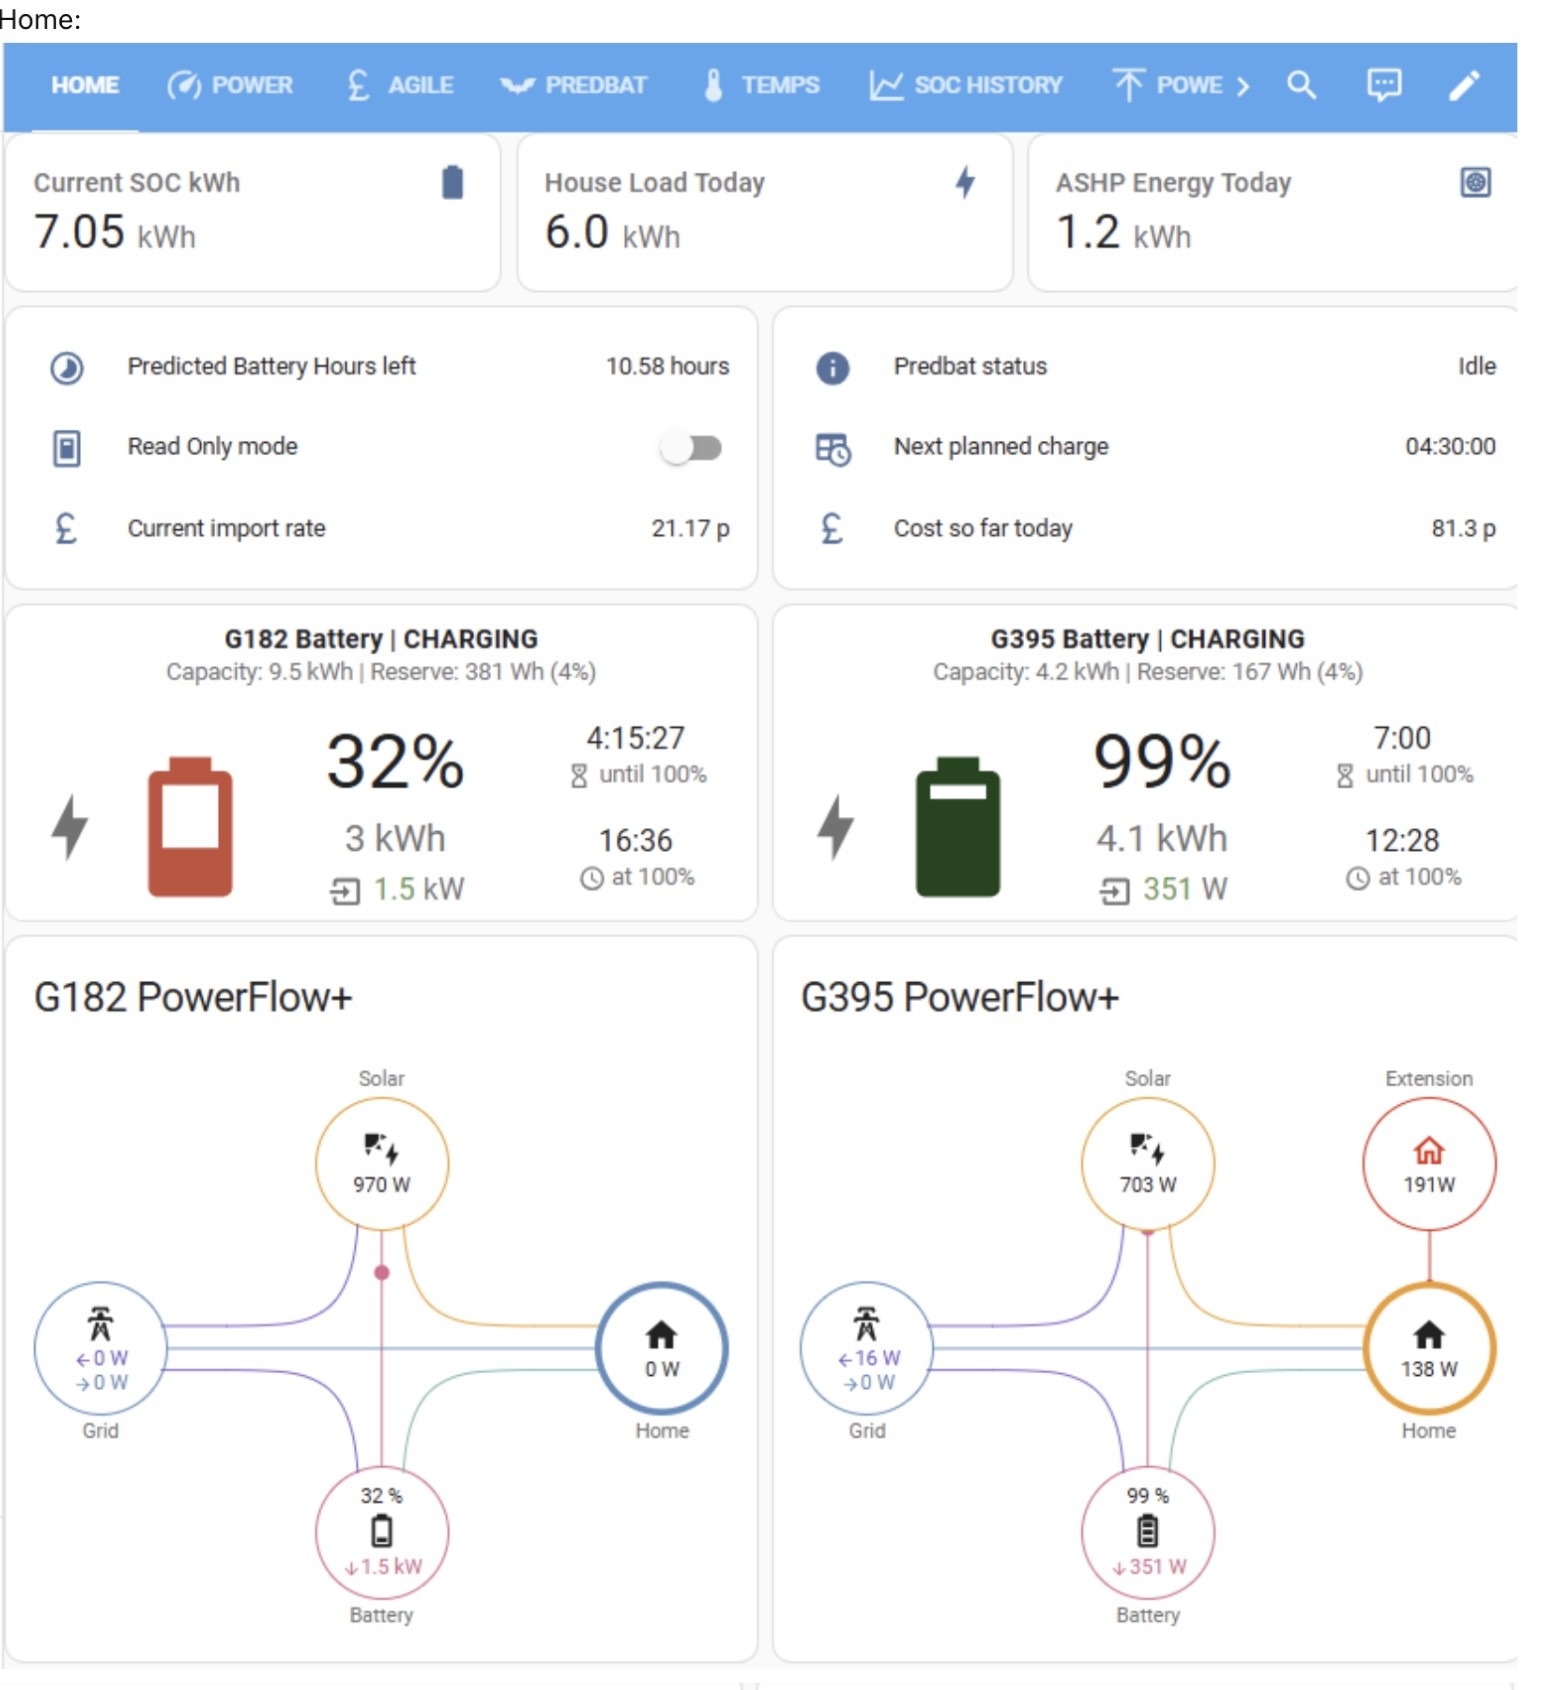
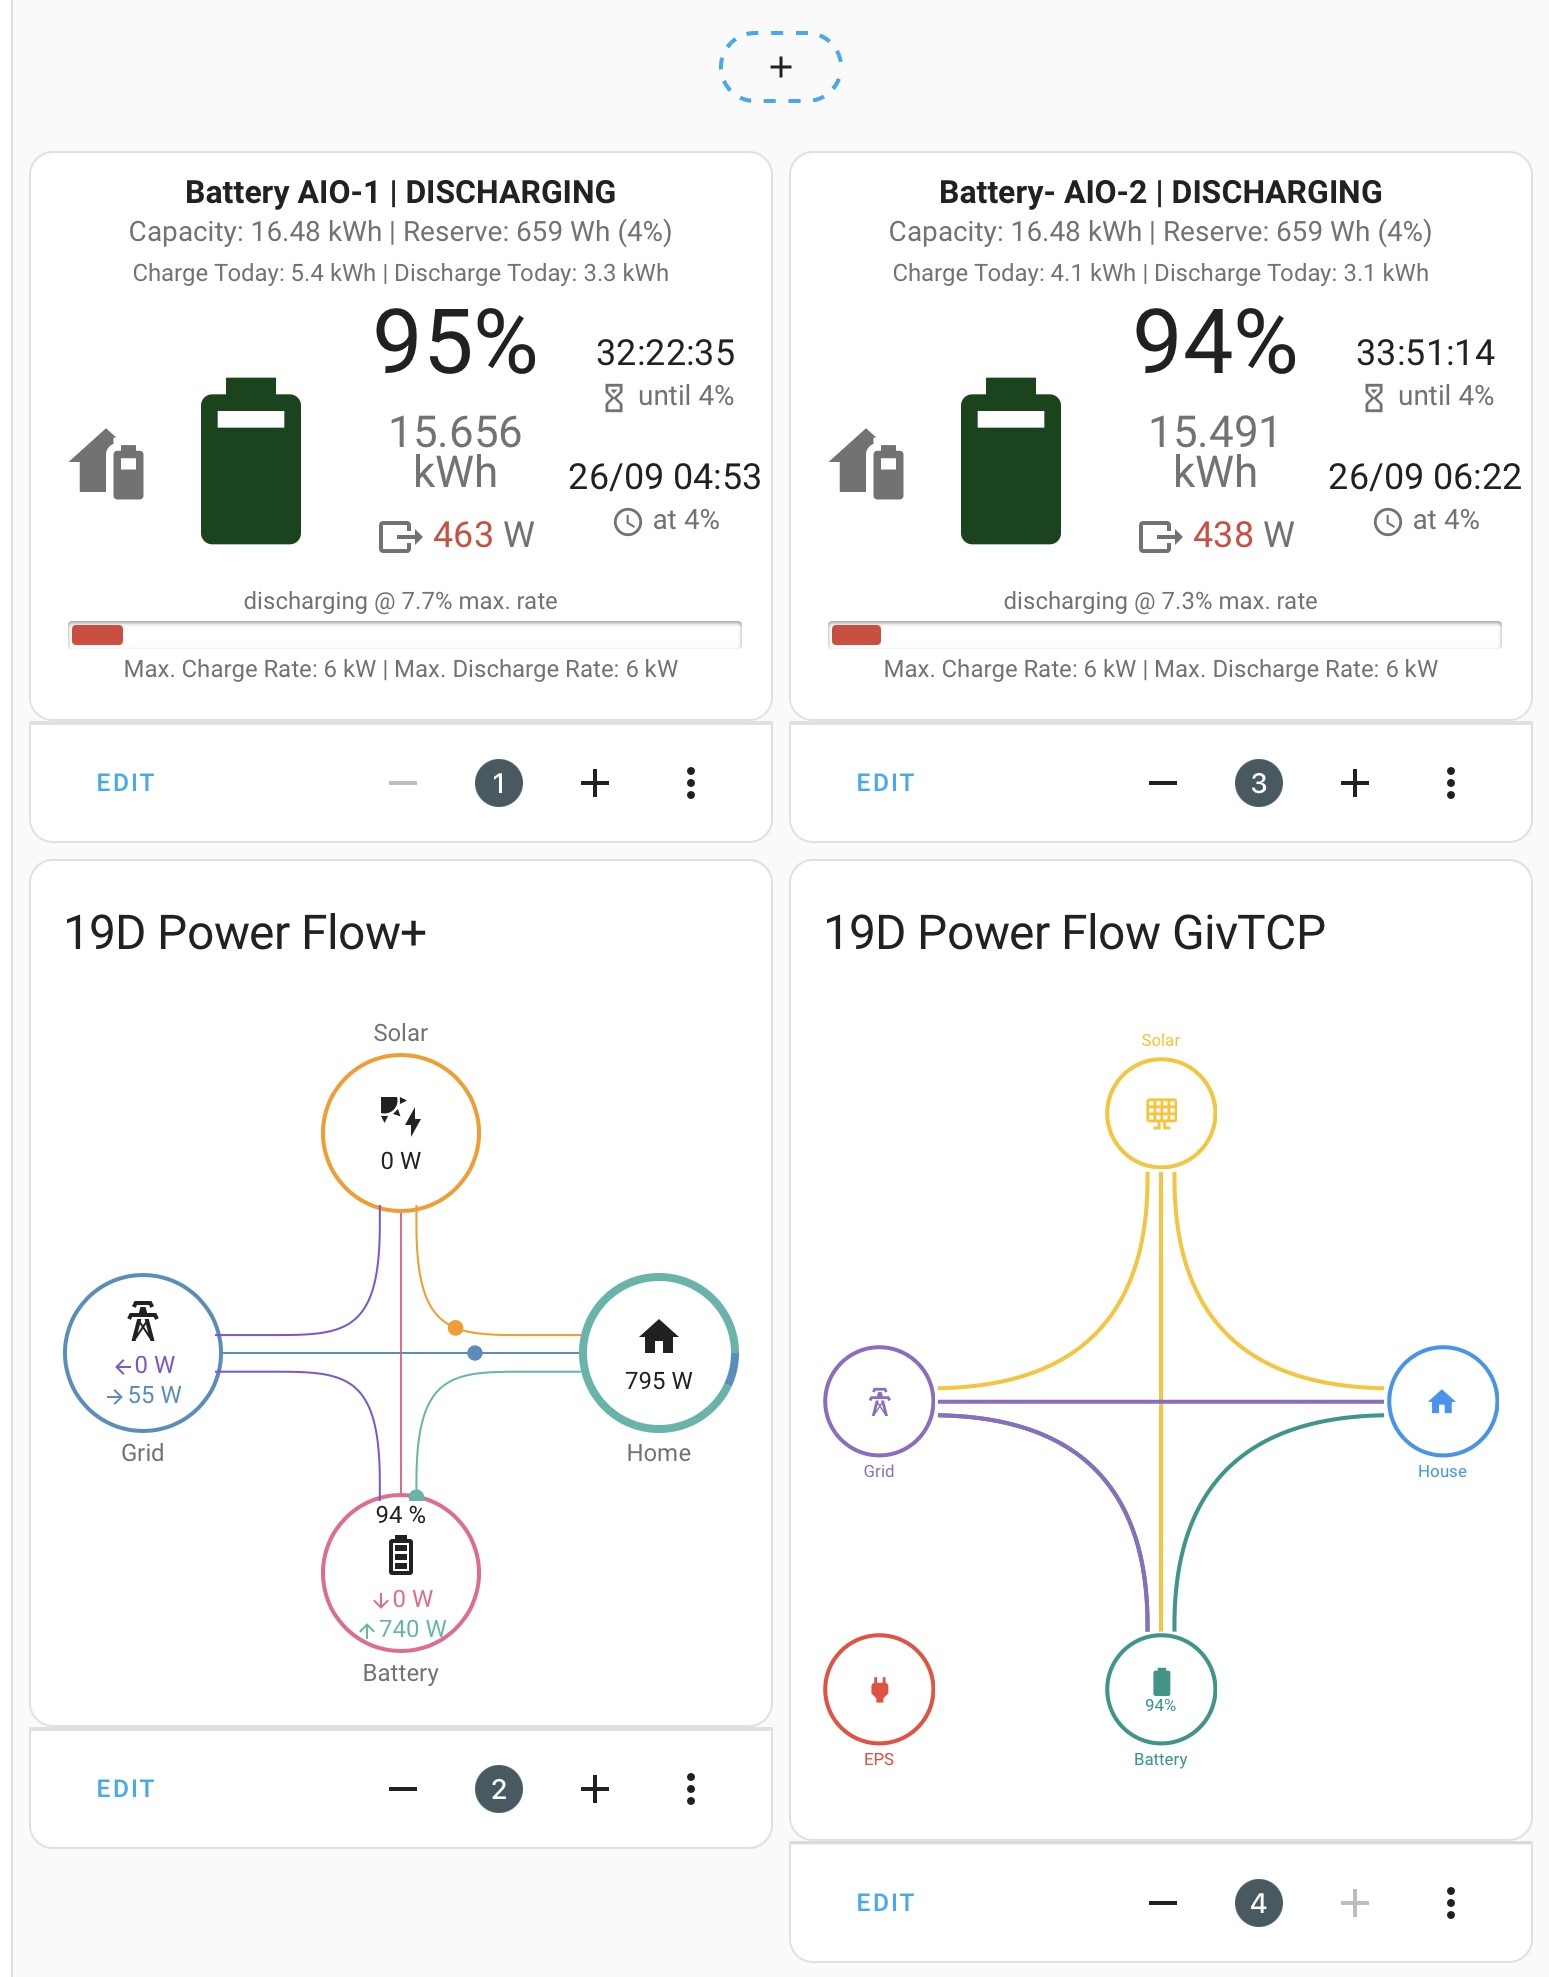
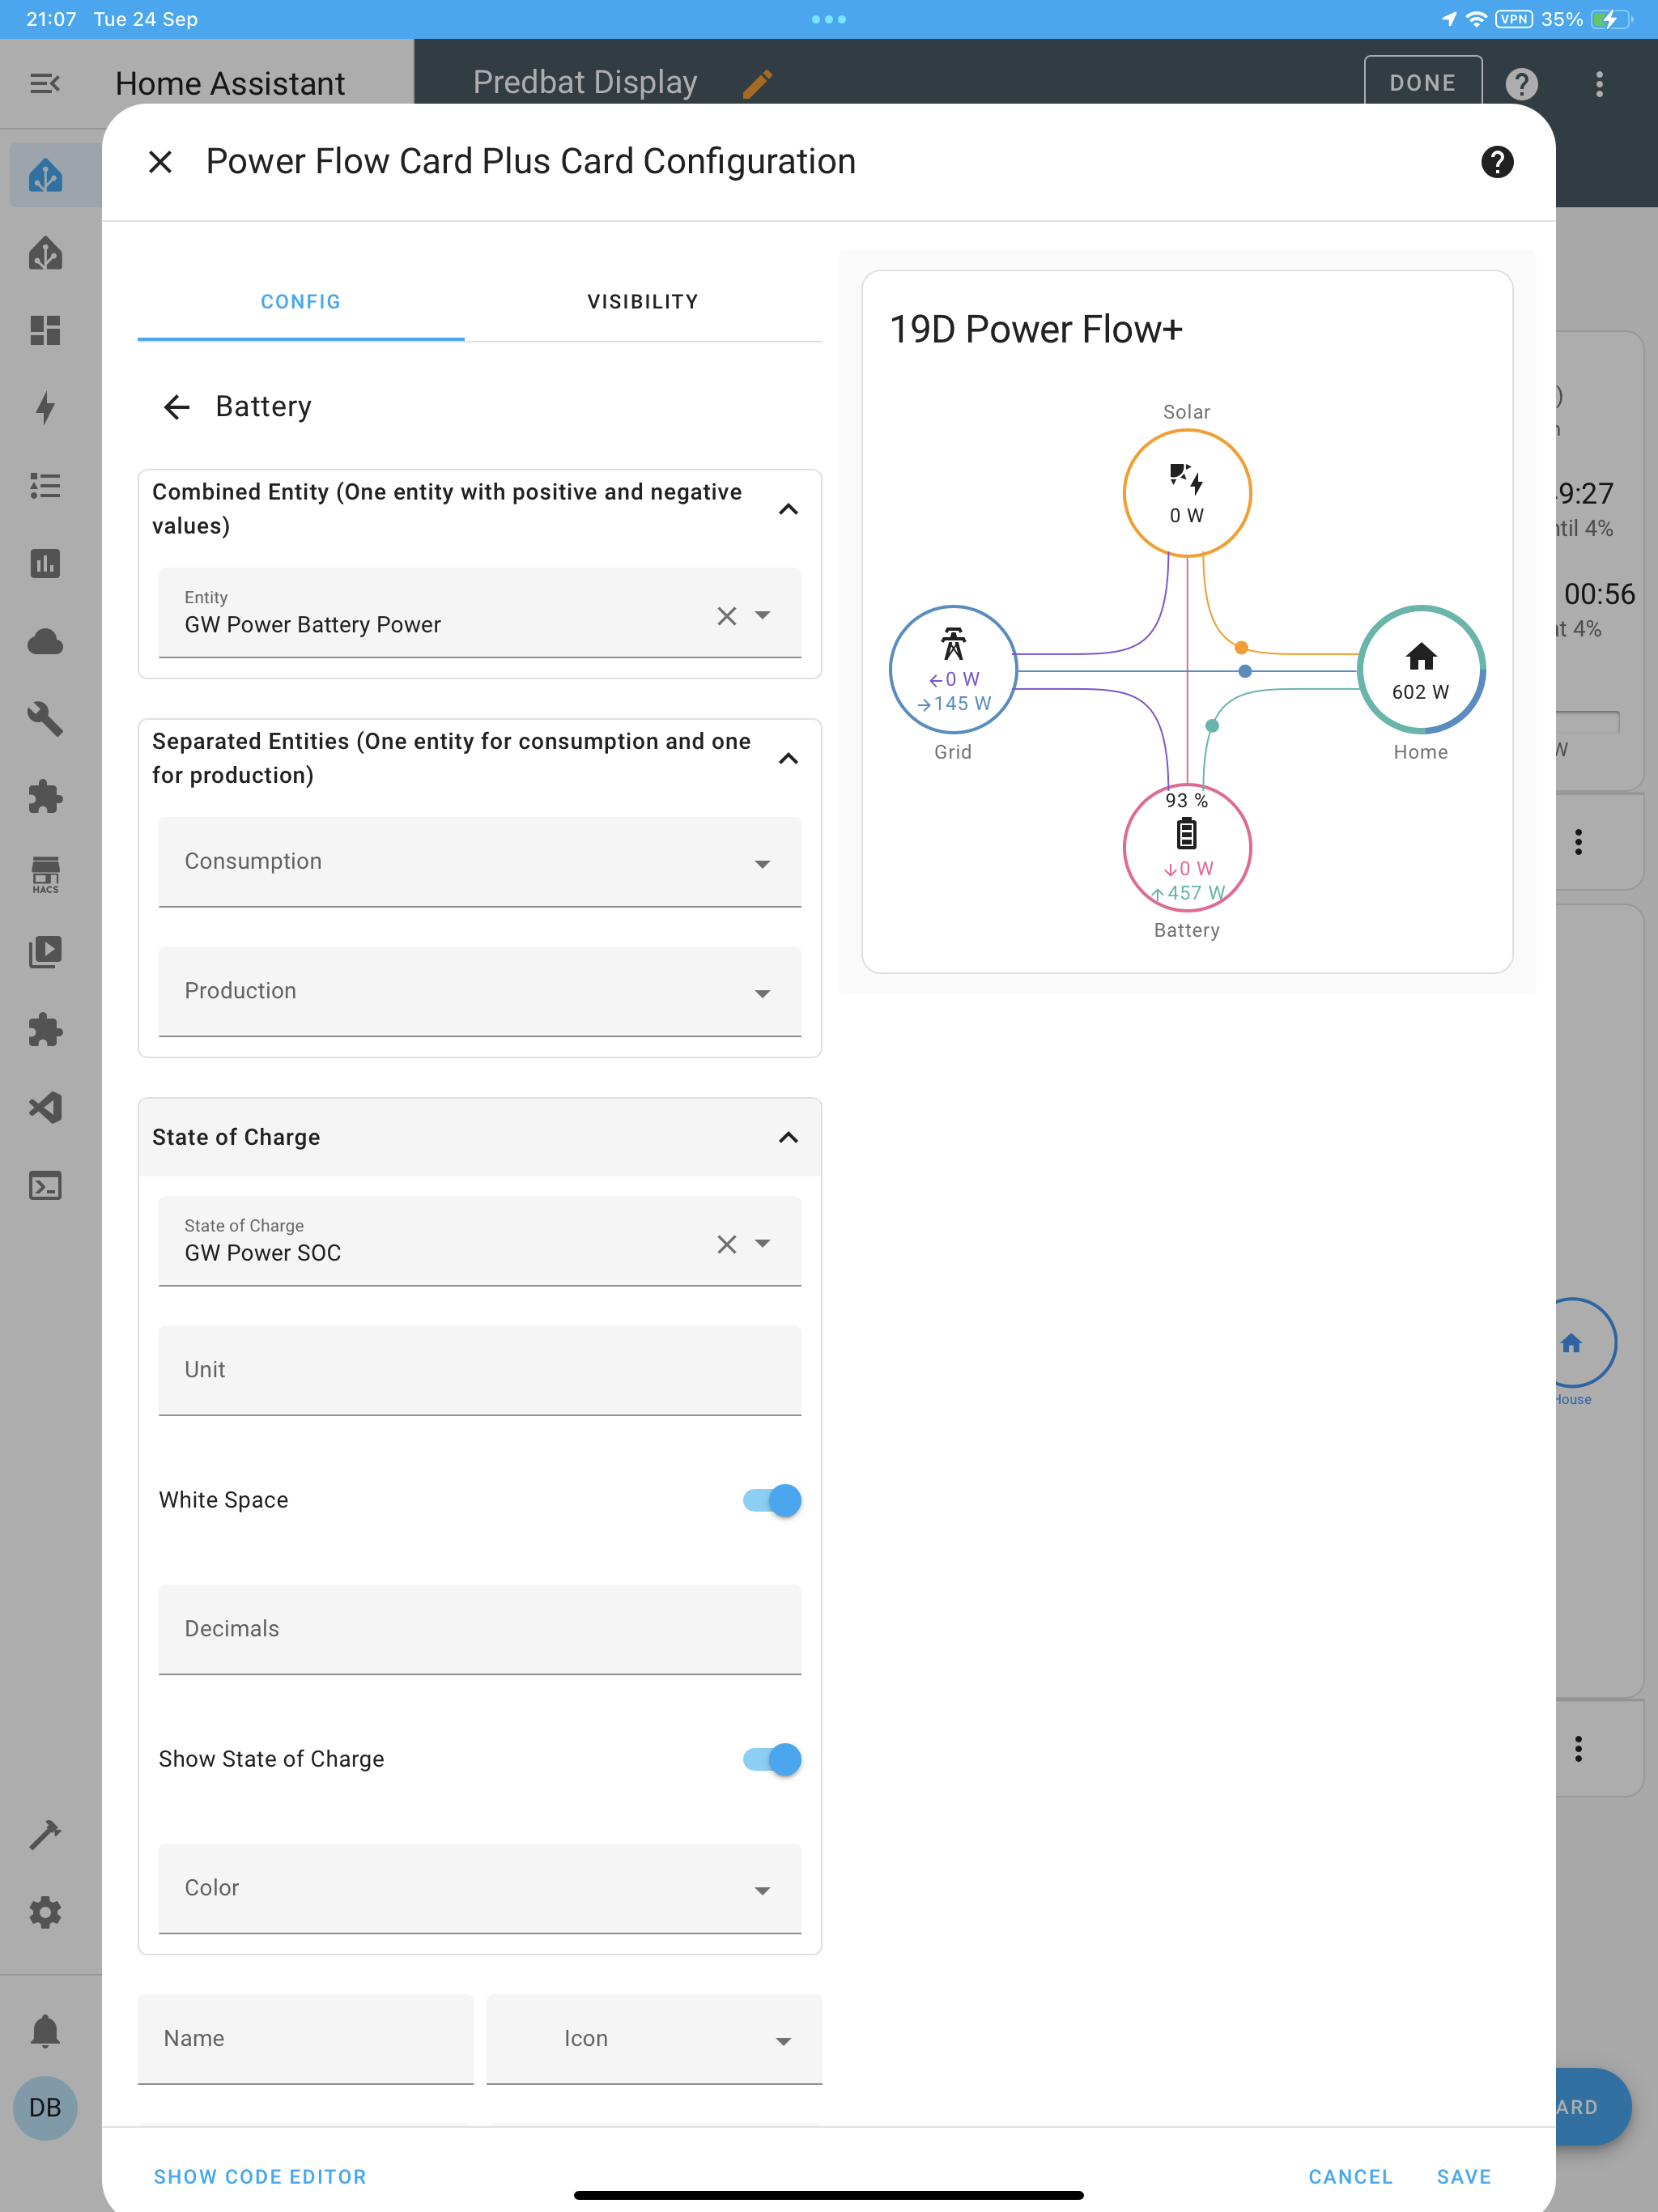
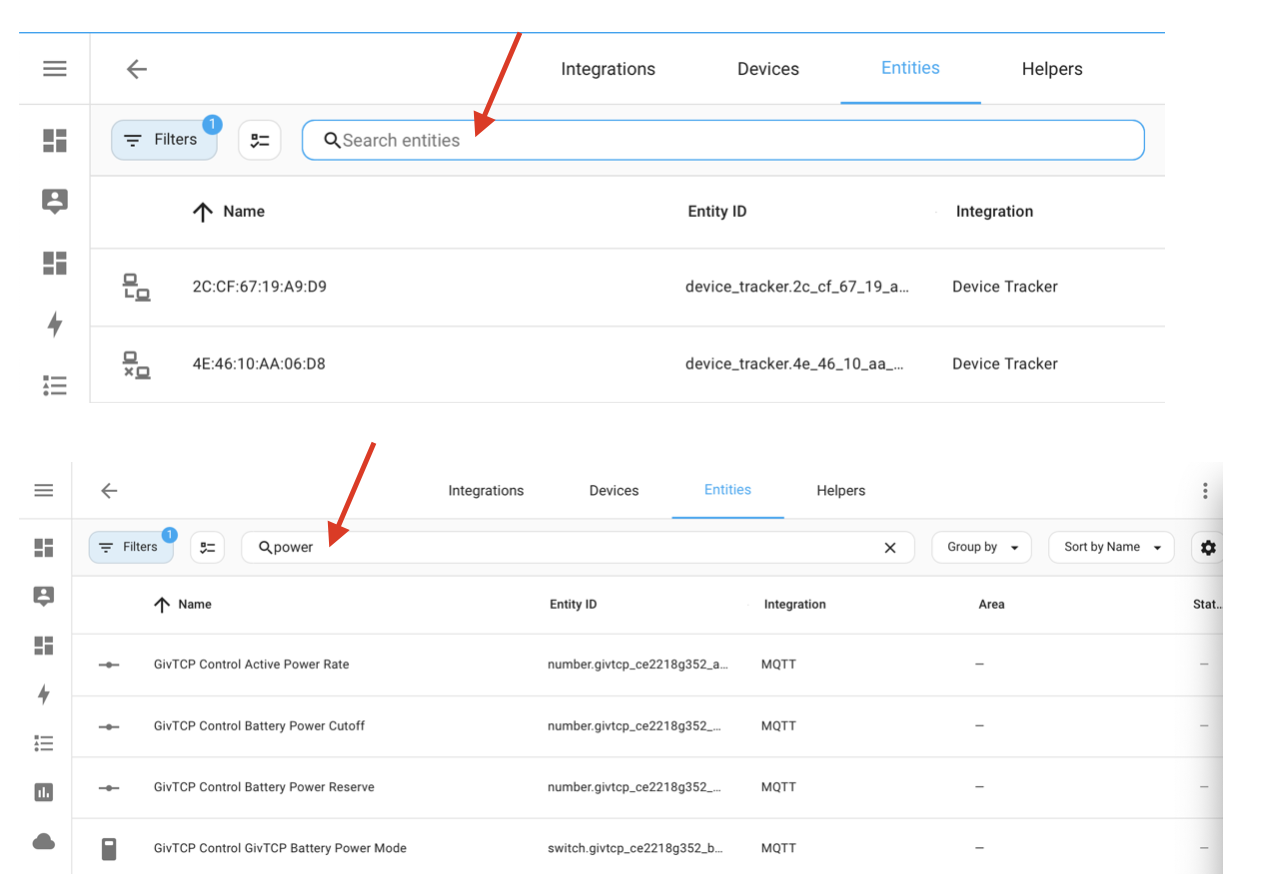
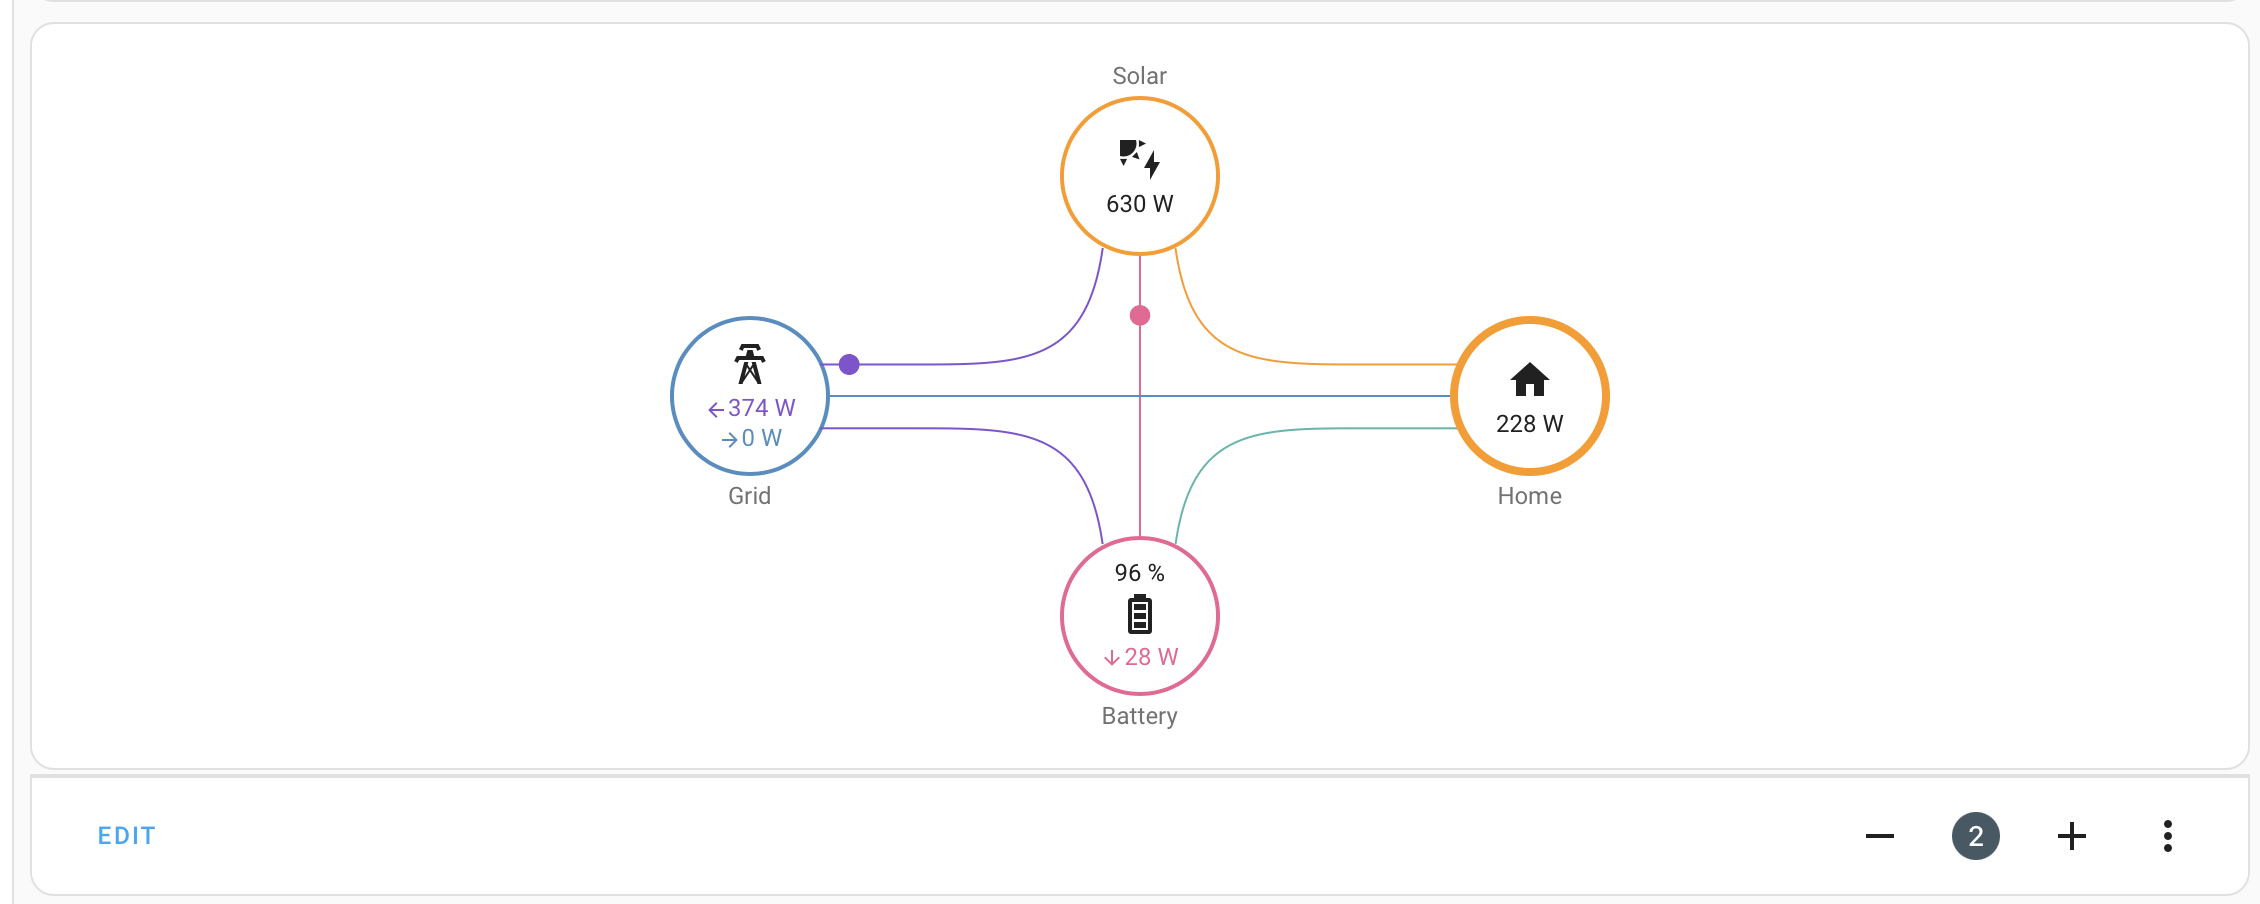
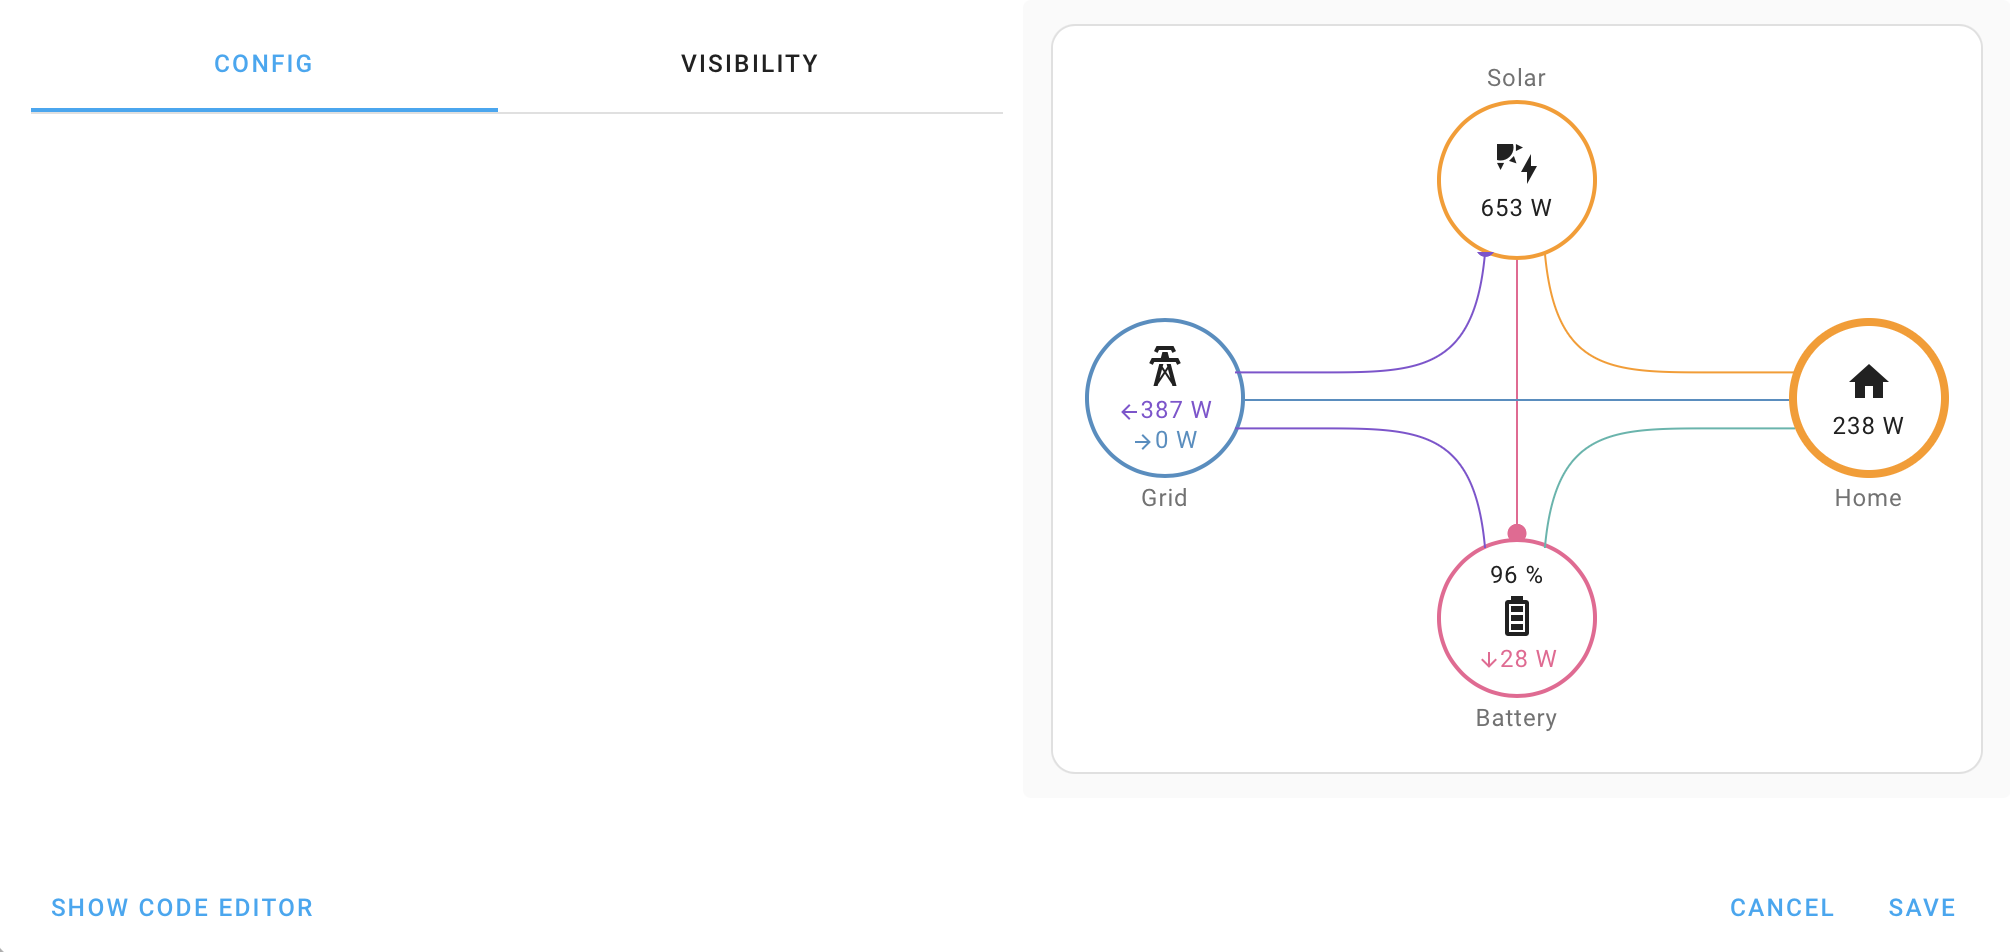
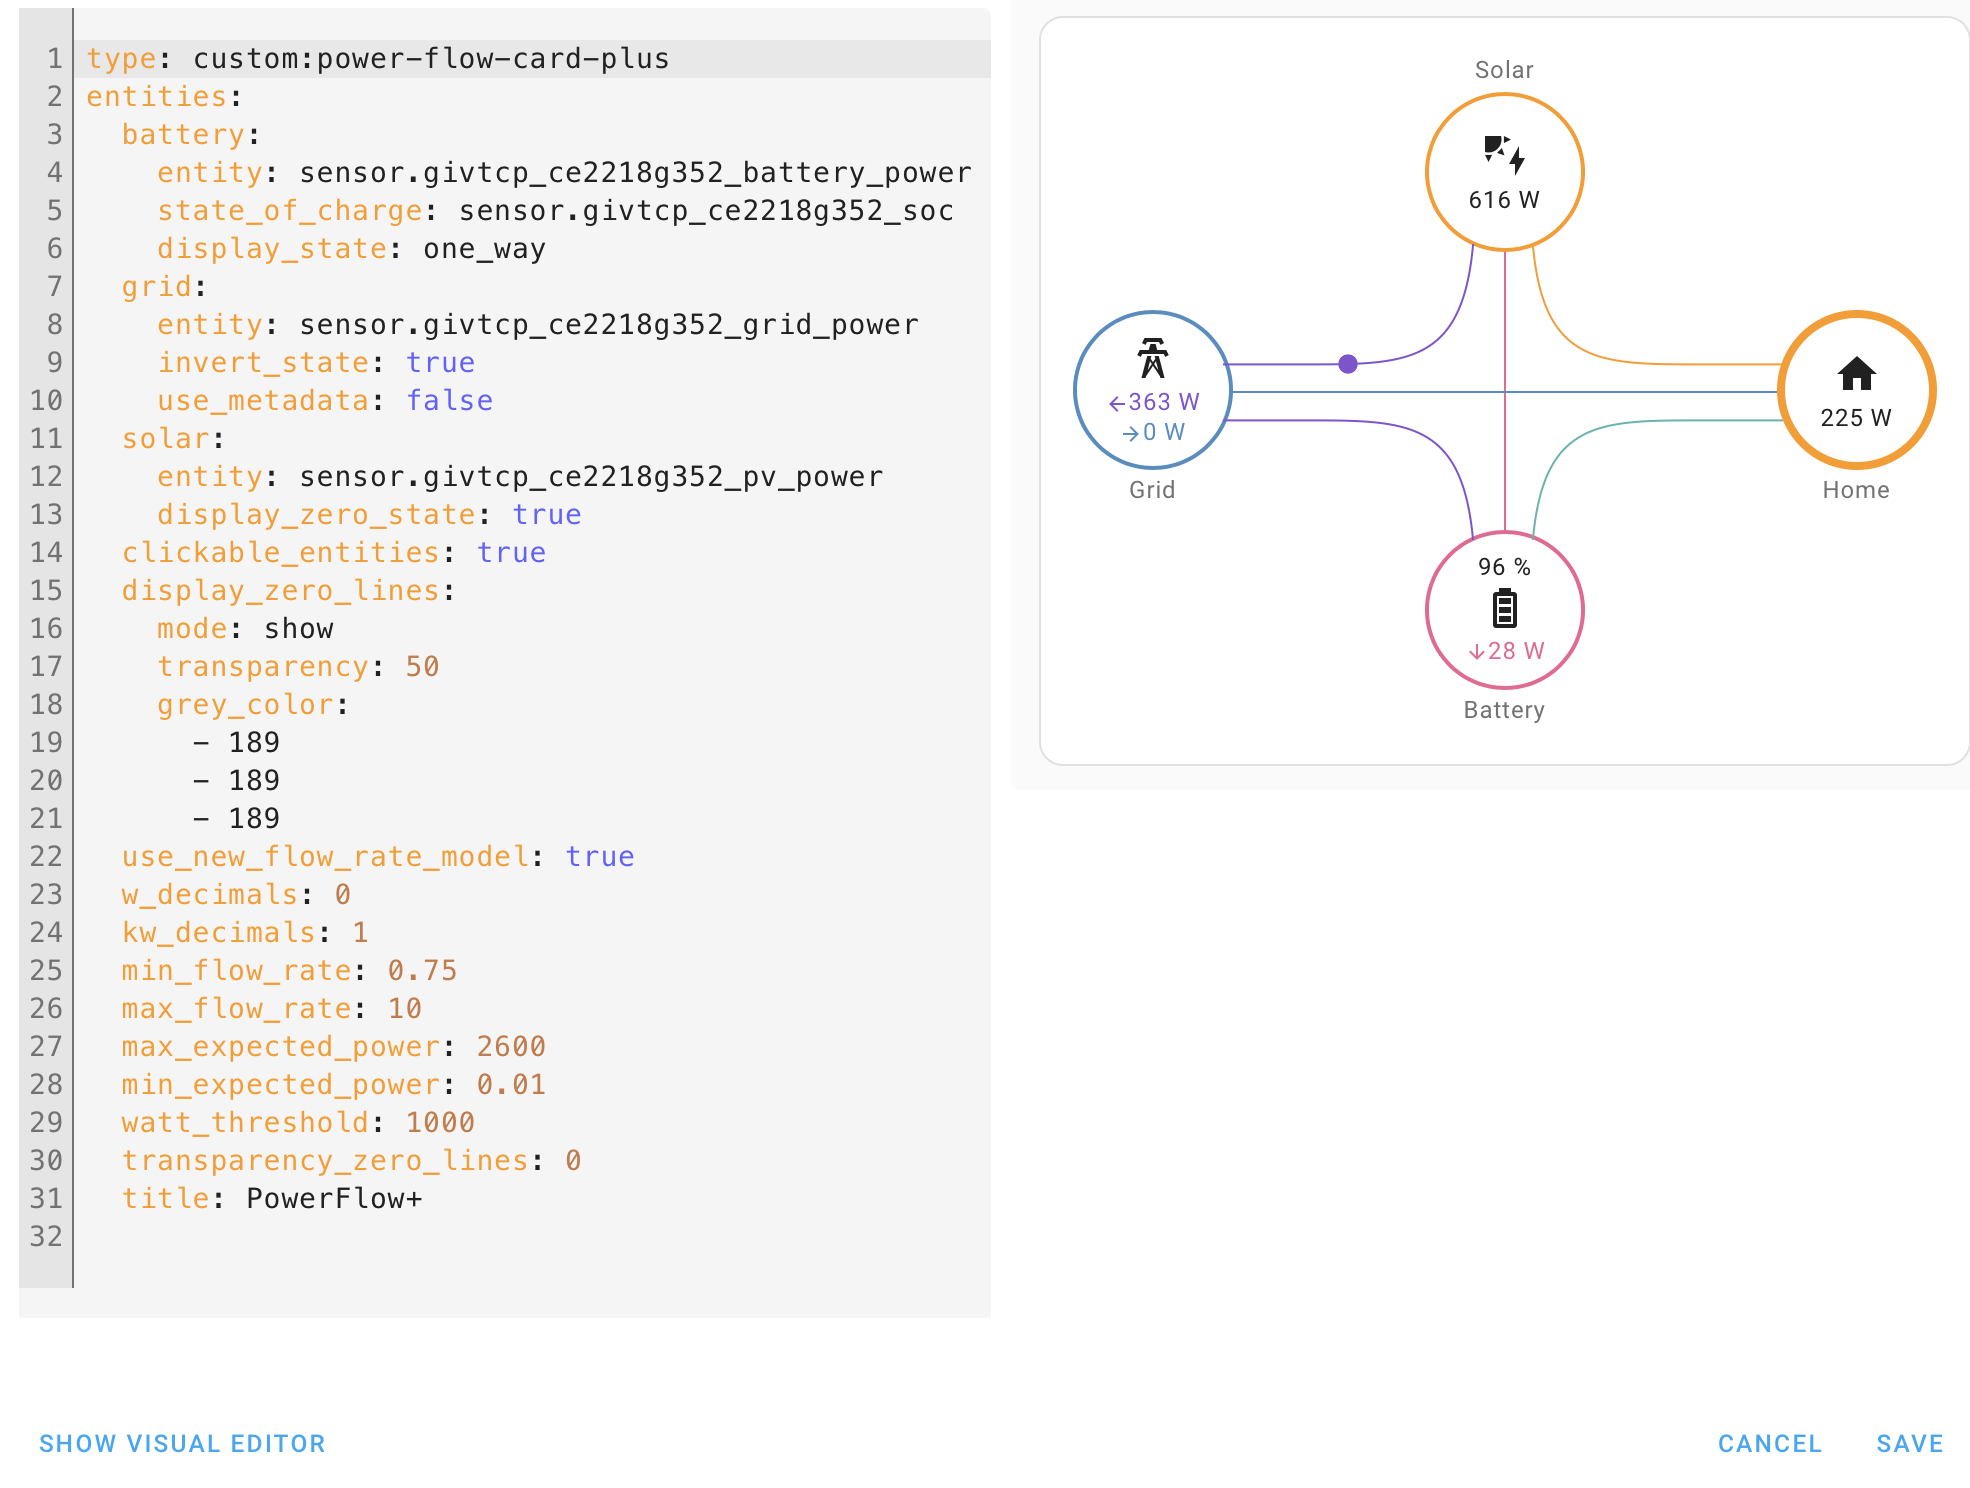
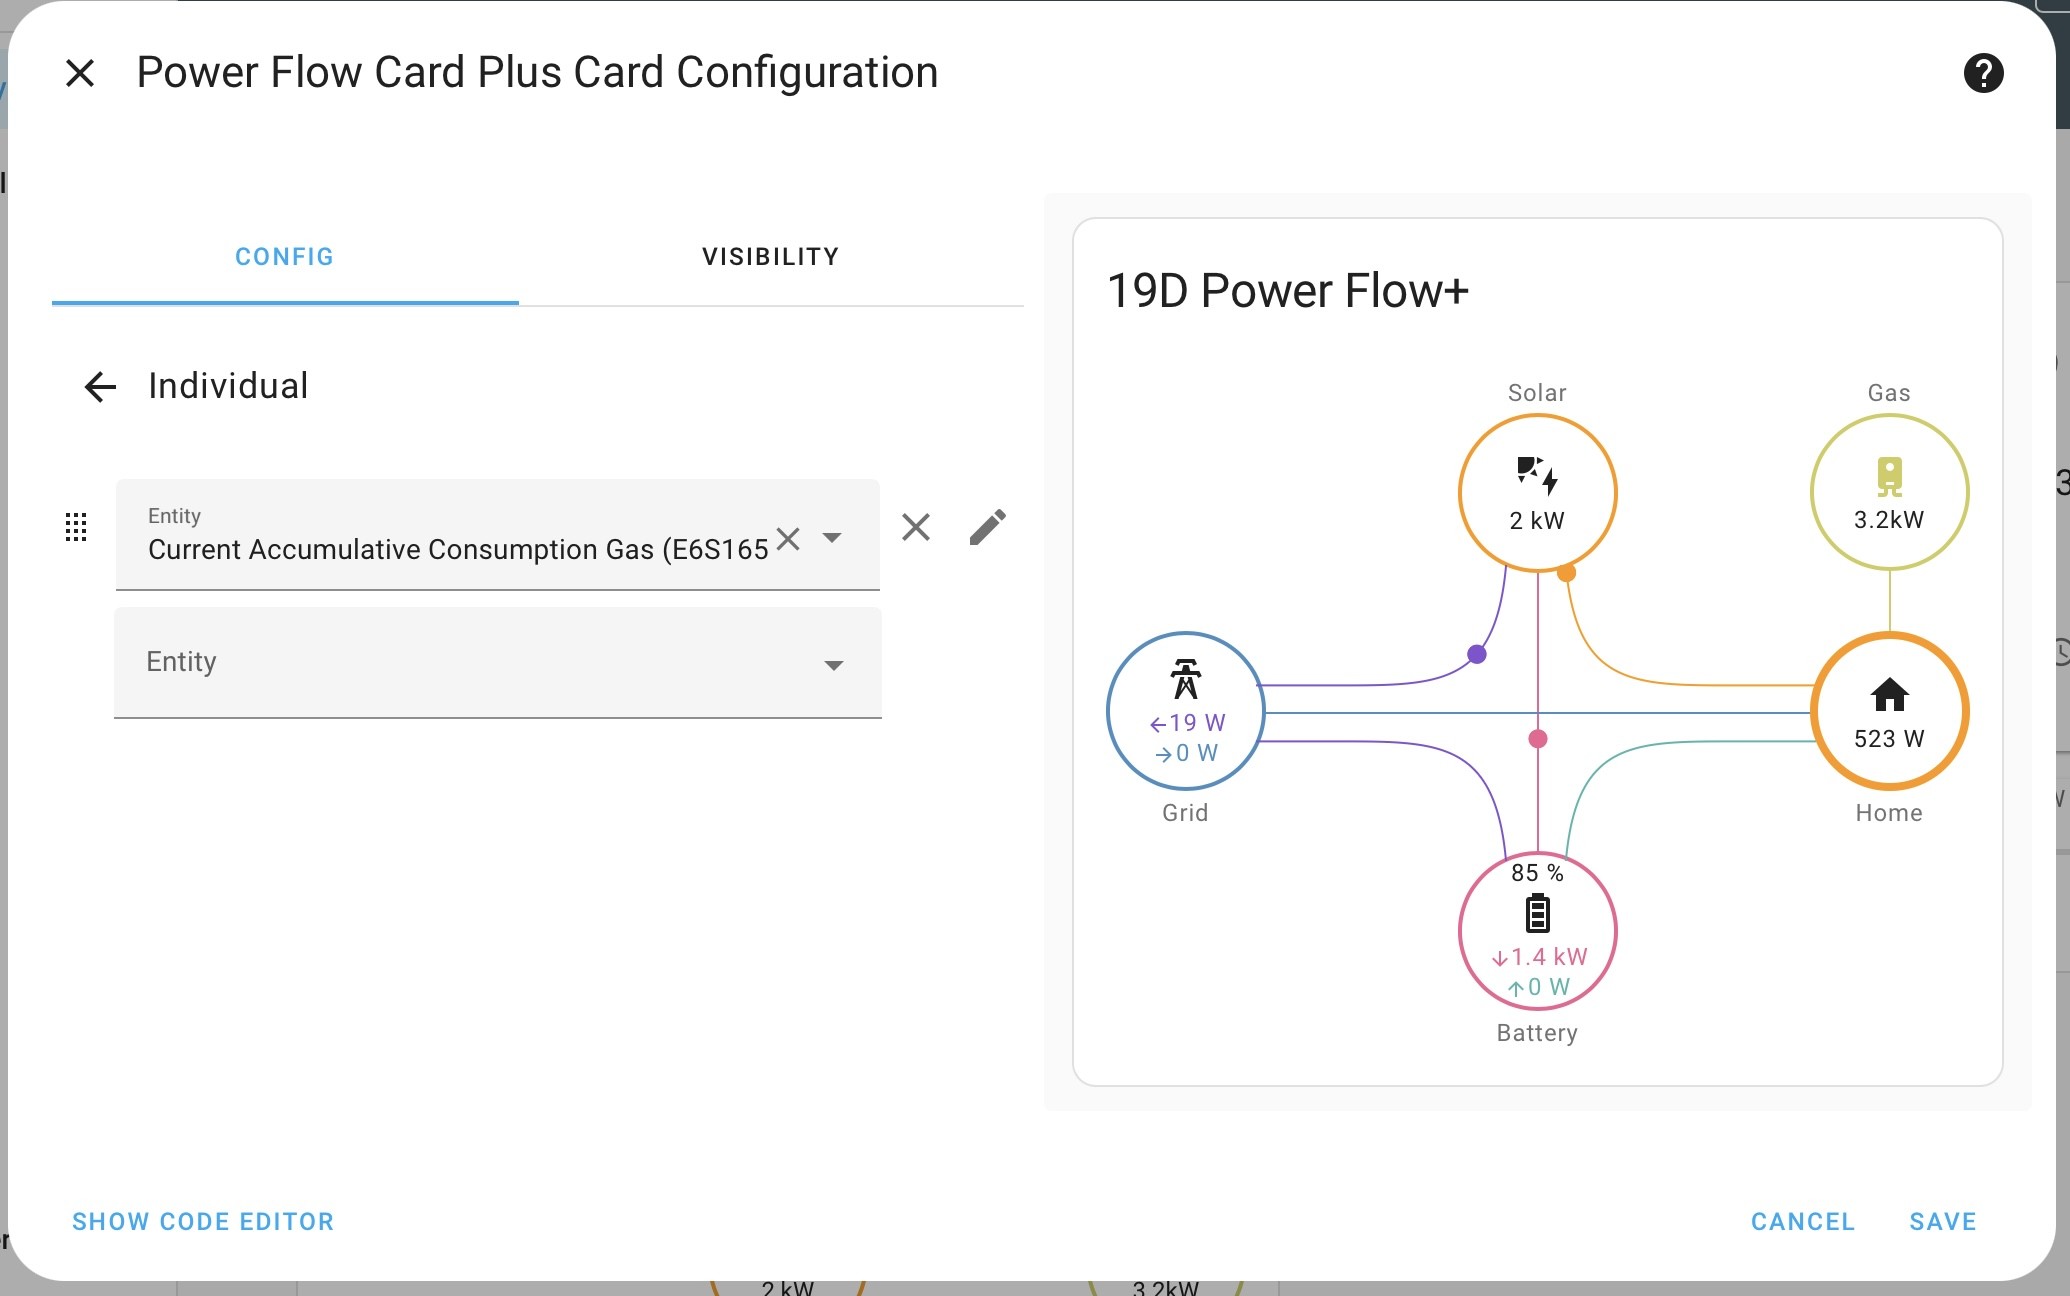
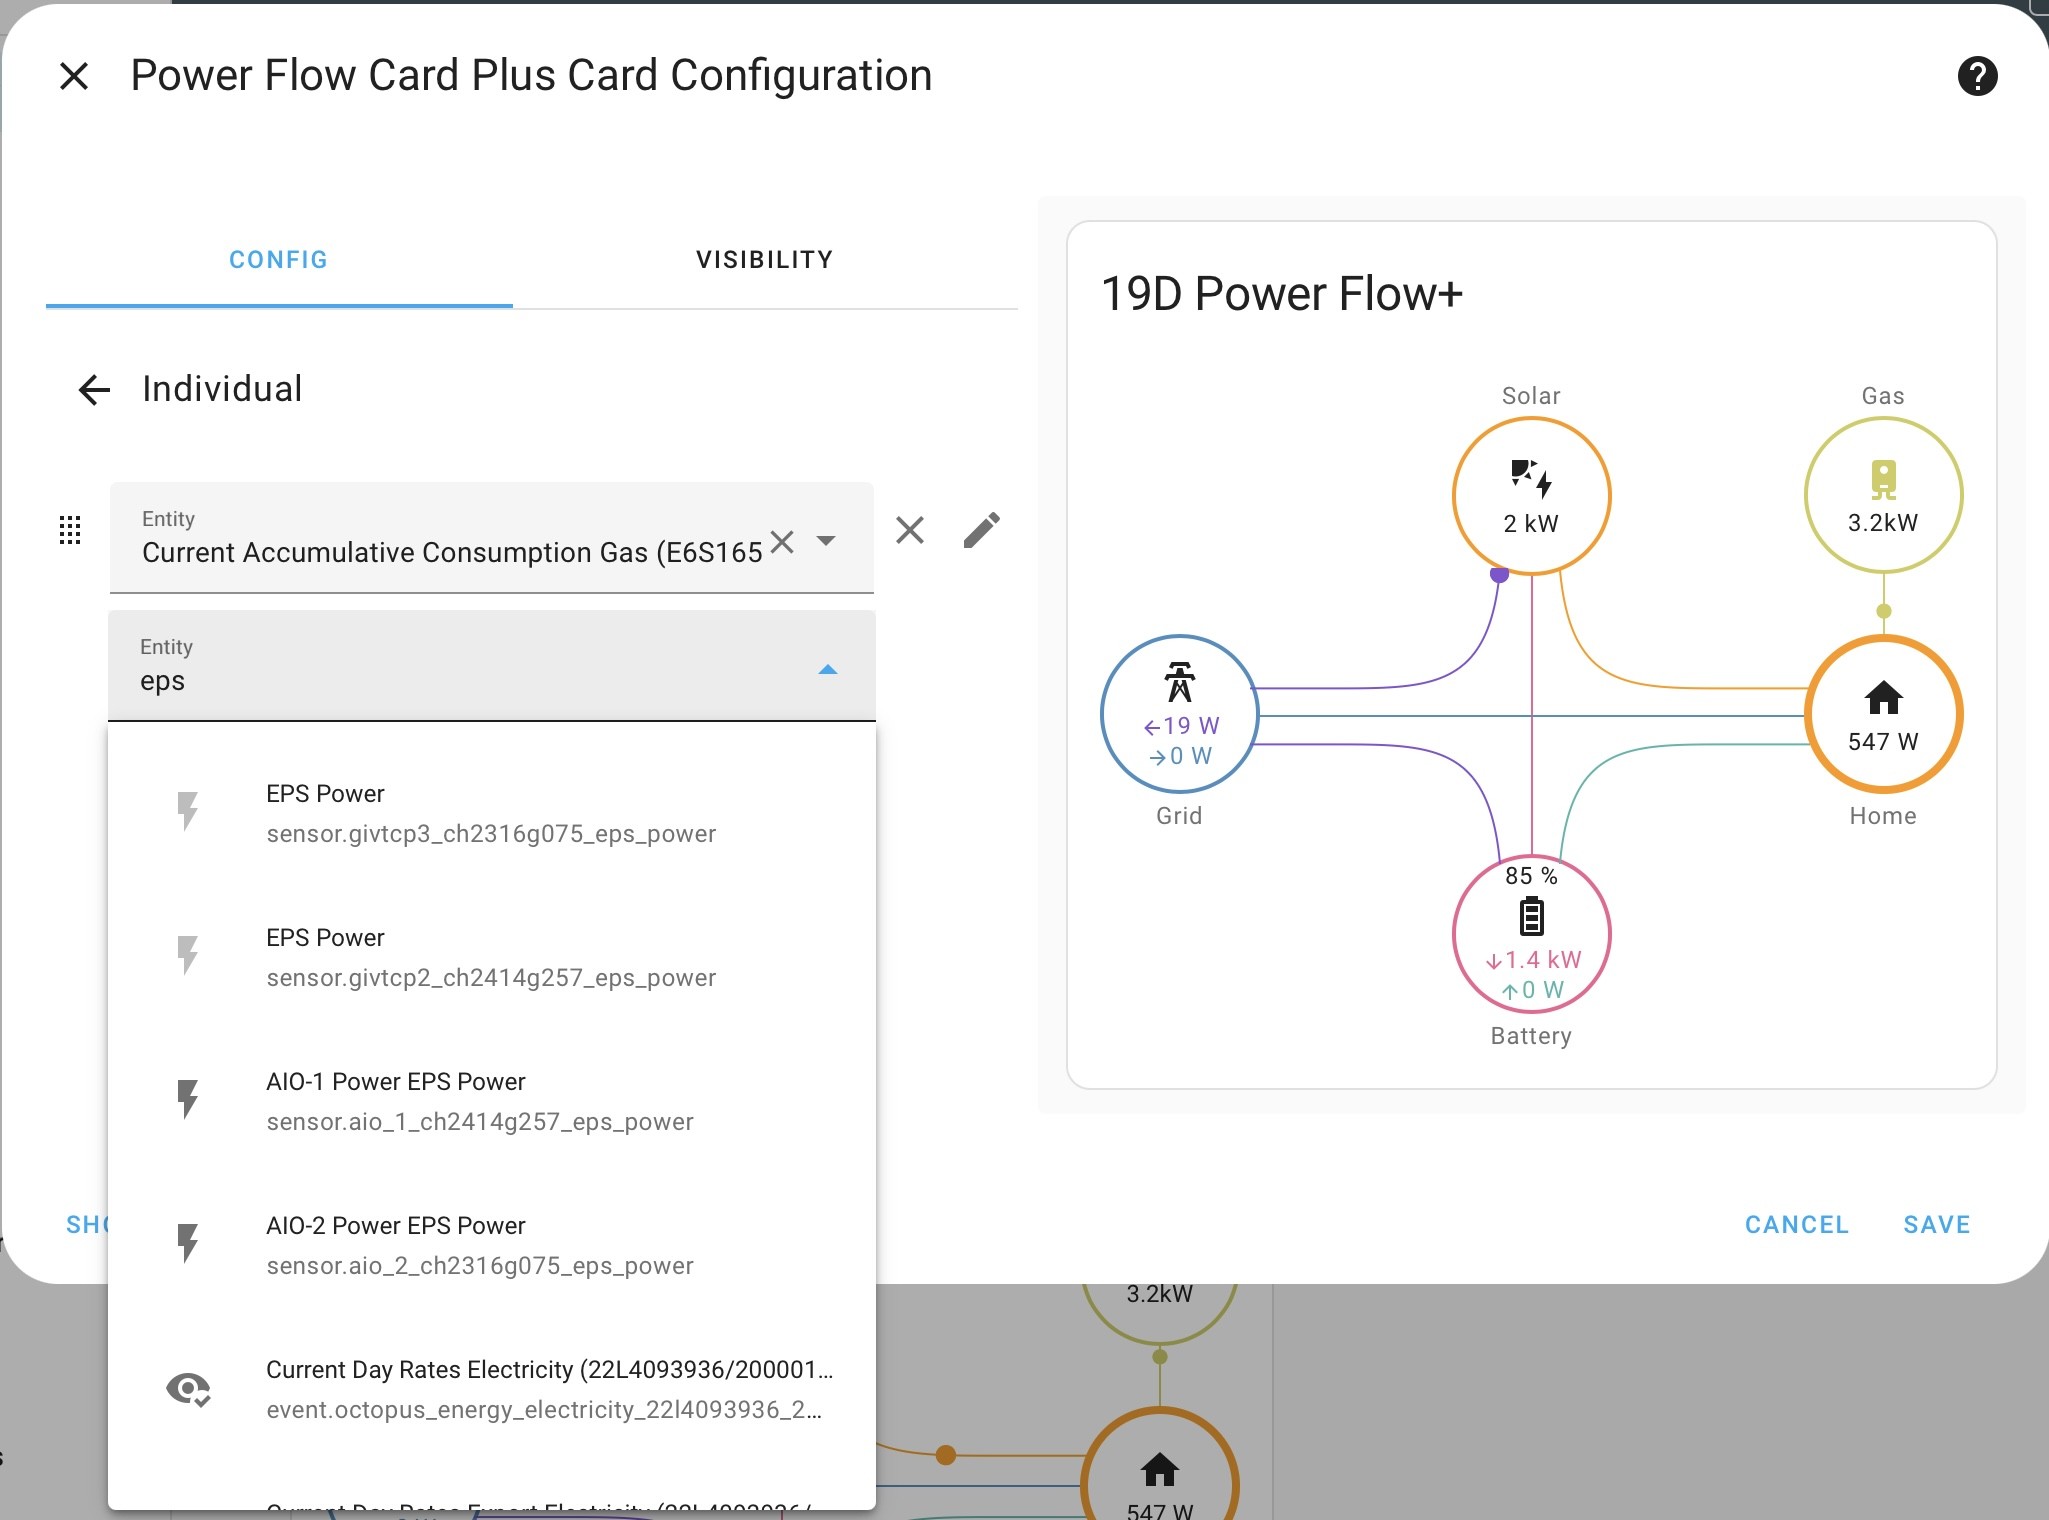
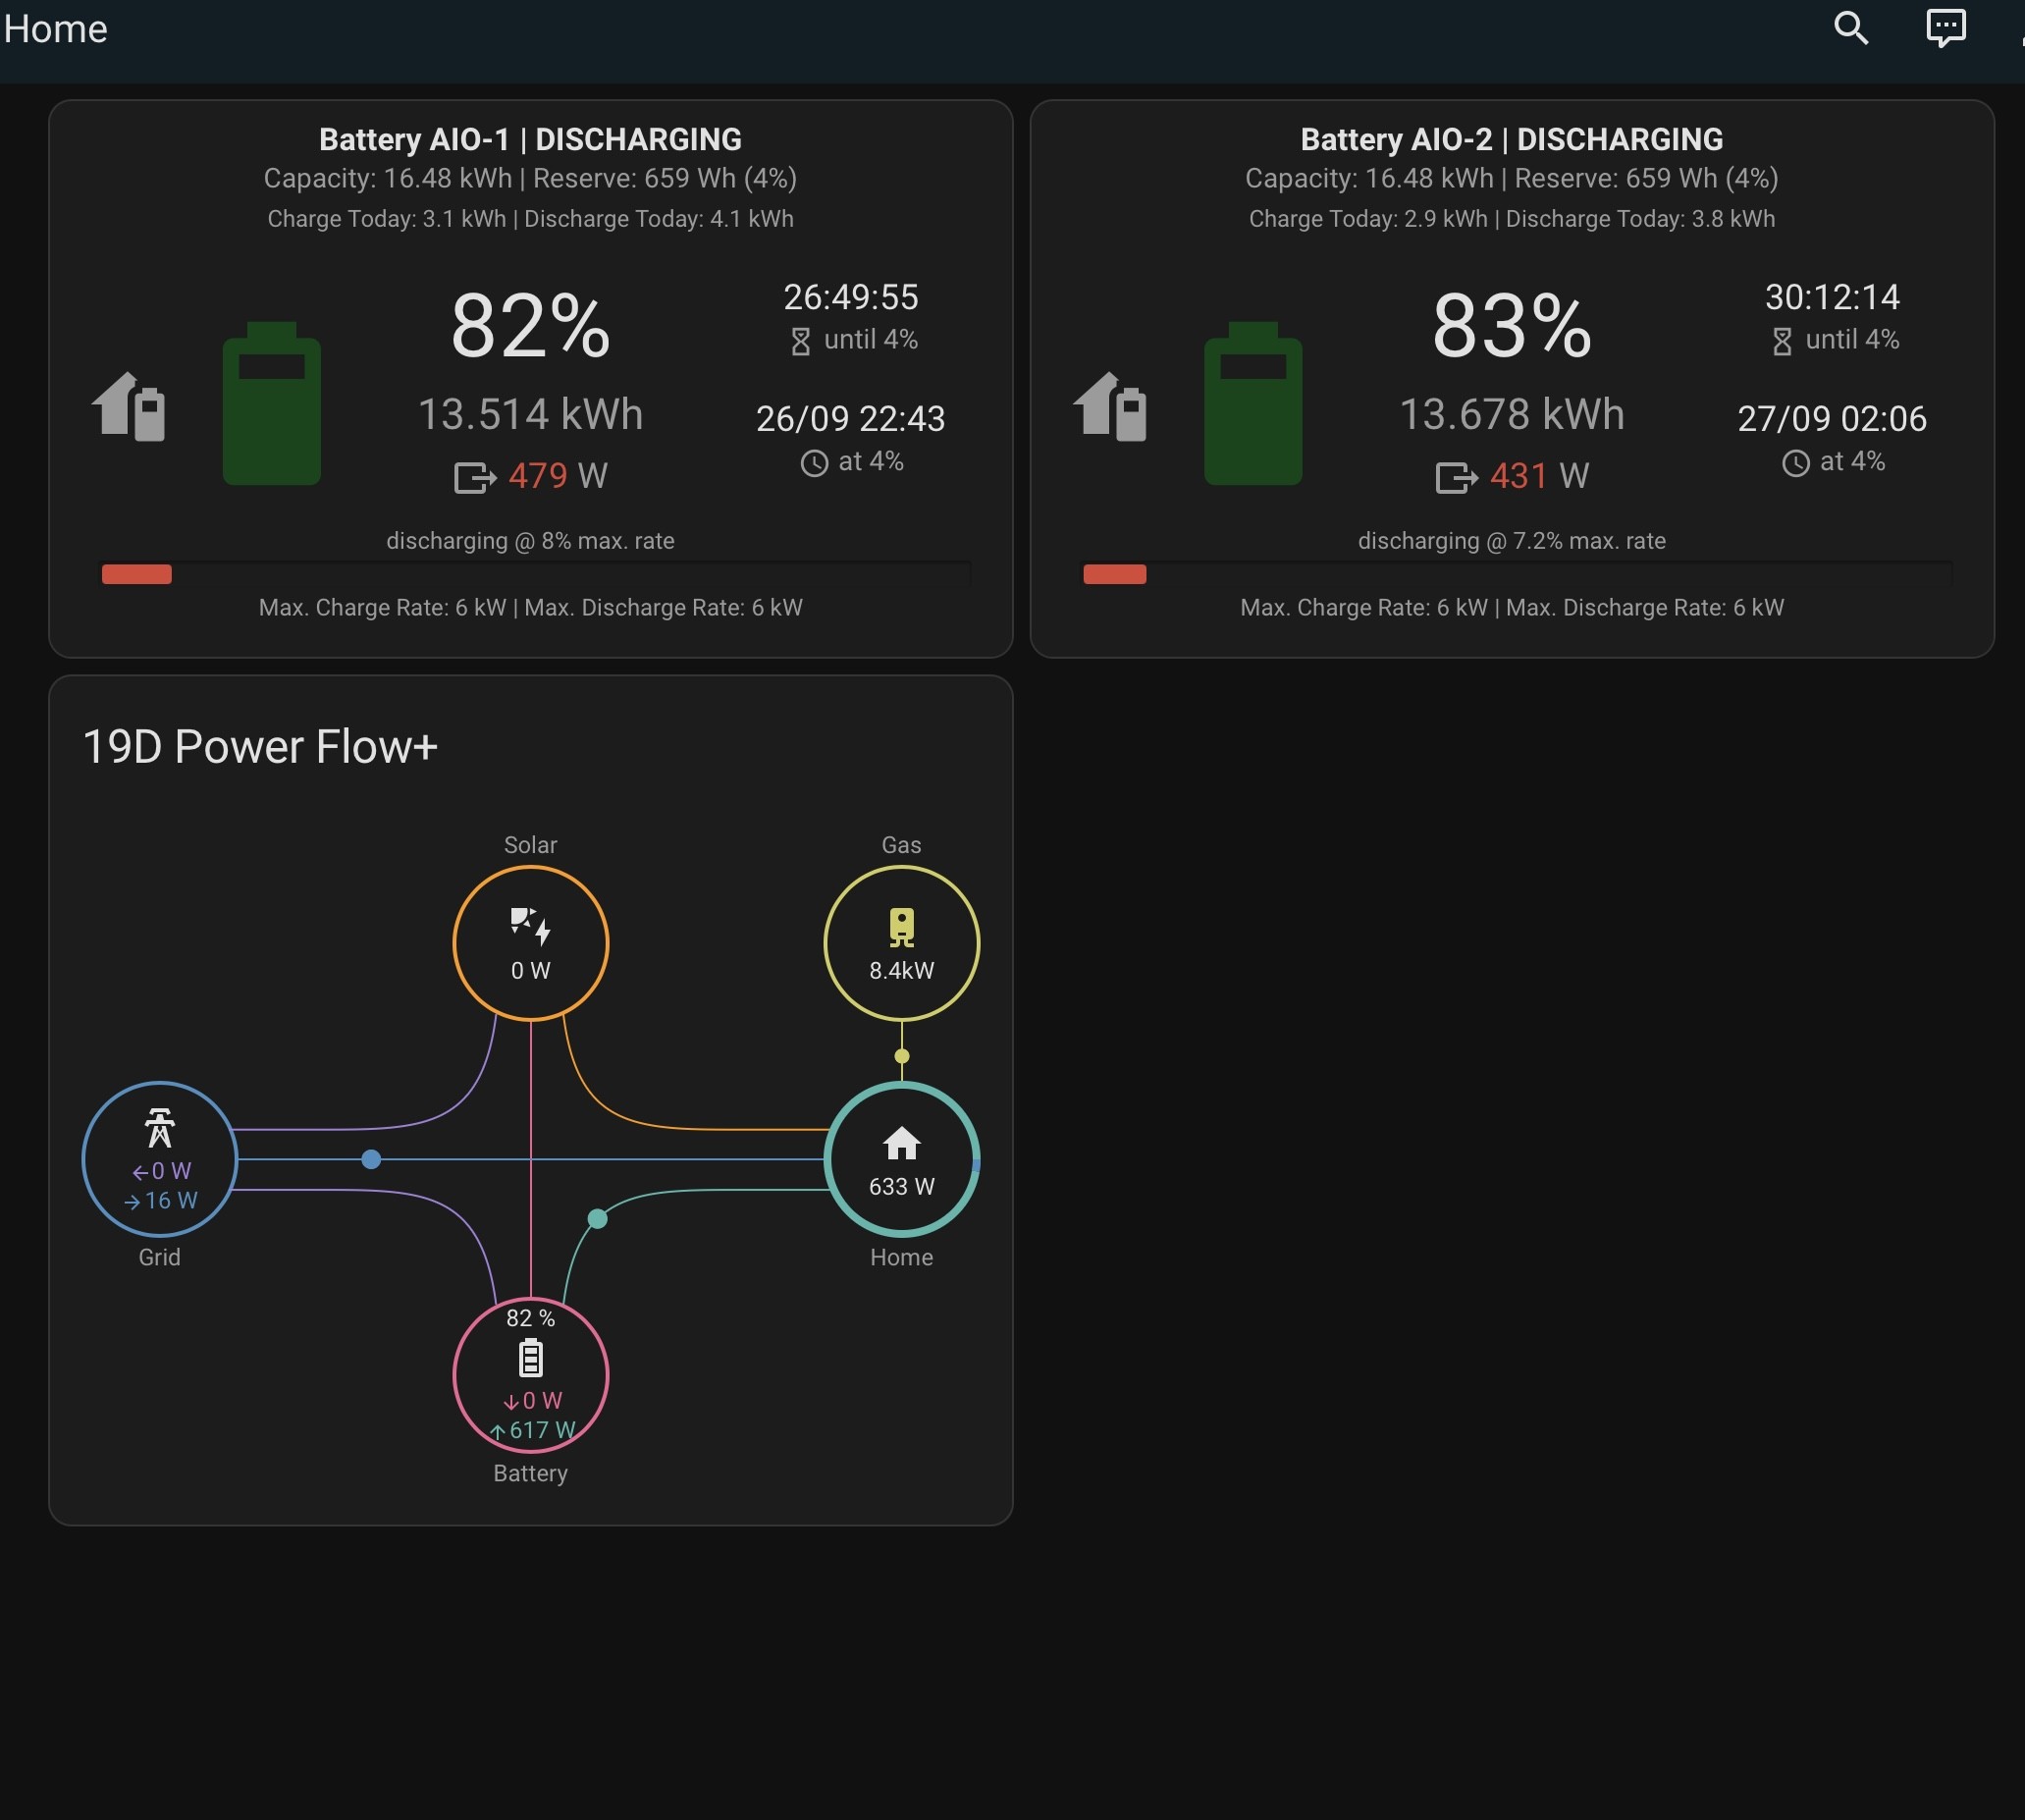
In terms of monitoring what’s happening on your inverter I use the Power Flow Plus card (there’s a speak to the geek video on setting it up) and I also use the GivTCP battery card https://github.com/Codegnosis/givtcp-battery-card
Search for and add this to HACS, then add it to a dashboard and configure it with your gateway serial number.

D
#12 Daveb01

geoffreycoan

Thank you 🍺

Yes everything on my network has a fixed IP.

I will look at the above, hopefully not to difficult 🤞

I have downloaded the power flow plus and battery card ready.

This did not work and I had to put it back to HA IP address, so guessing this is the wrong place Predbat yaml

My GW IP is 10.0.130.4 (this is correct in the GivTCP config Inverter 1

Not sure abut this one

geserial: 're :sensor.givtcp(.+)soc_kwh'

Should I change it to.

geserial: ‘re : GW2316G235’

D
#13 Daveb01

Hhhmmmm not sure what to do 🥴

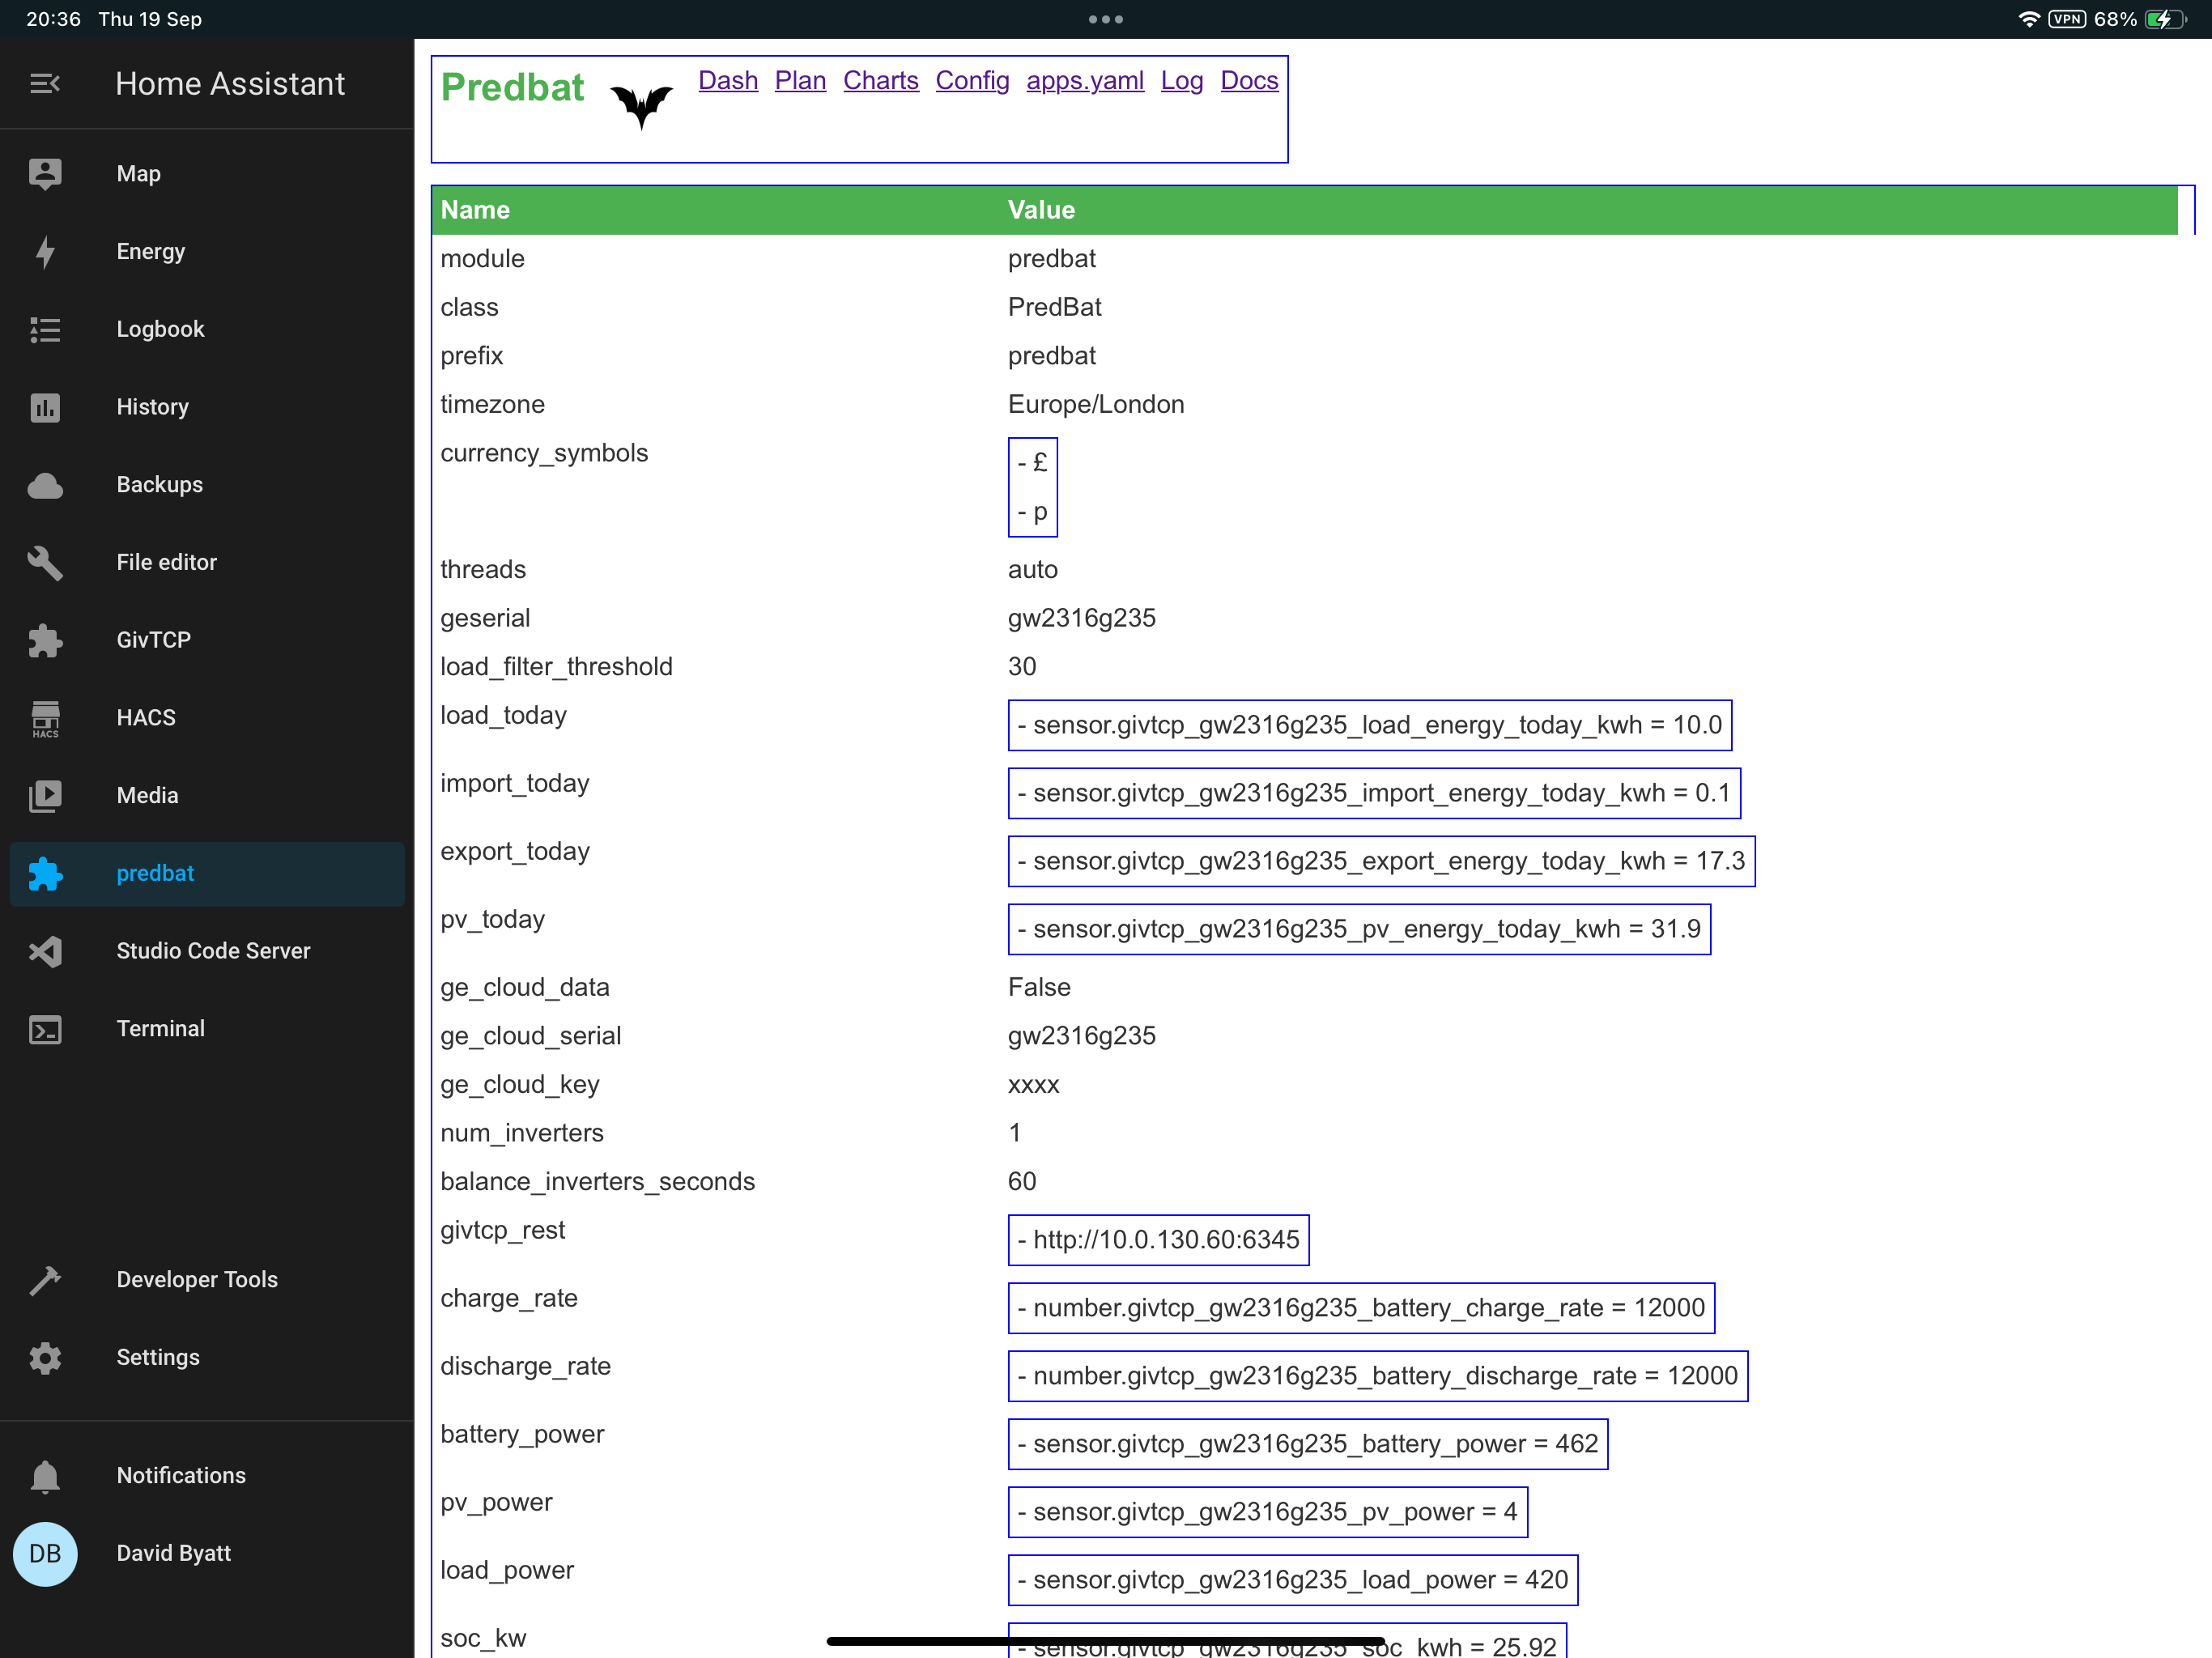
So managed to changed the serial number and it now likes this, hopefully that was right

I have changed the IP from .60 to the GW IP .4. Loads of errors.
Changed it back again and those errors have gone.

Looks like it is getting the GW, but don’t know what the error are in the Predbat log


D
#14 Daveb01

geoffreycoan

GivTCP log now looks like this


G
#15 geoffreycoan

Daveb01 geserial: 're :sensor.givtcp(.+)soc_kwh'

Should I change it to.

geserial: ‘re : GW2316G235’

almost right, it should be:

geserial 'GW2316G235'

i.e. you are hard-coding the gateway serial number, not letting predbat work it out from a regular expression. In your latest apps.yaml it looks correct.

This in covered in my latest draft documentation https://github.com/gcoan/batpred/blob/main/docs/apps-yaml.md#geserial

I have changed the IP from .60 to the GW IP .4. Loads of errors.
Changed it back again and those errors have gone.
Looks like it is getting the GW, but don’t know what the error are in the Predbat log

sorry my bad, I mis-directed you. its nothing to do with the IP address of the gateway, its the IP address of your home assistant server, or http://homeassistant.local:6345 https://github.com/gcoan/batpred/blob/main/docs/apps-yaml.md#rest-interface-inverter-control

per the docs:

To check your REST is working open up the readData API point in a Web browser e.g: http://homeassistant.local:6345/readData

Looking at your logfile it says its listening at http://0.0.0.0:6345 which is the loopback to your HA server, so this should be OK now

D
#16 Daveb01

geoffreycoan

So, have updated everything as per this advice, added the ‘ to each end of GW SN.
Put in the web address in browser and get loads of stuff
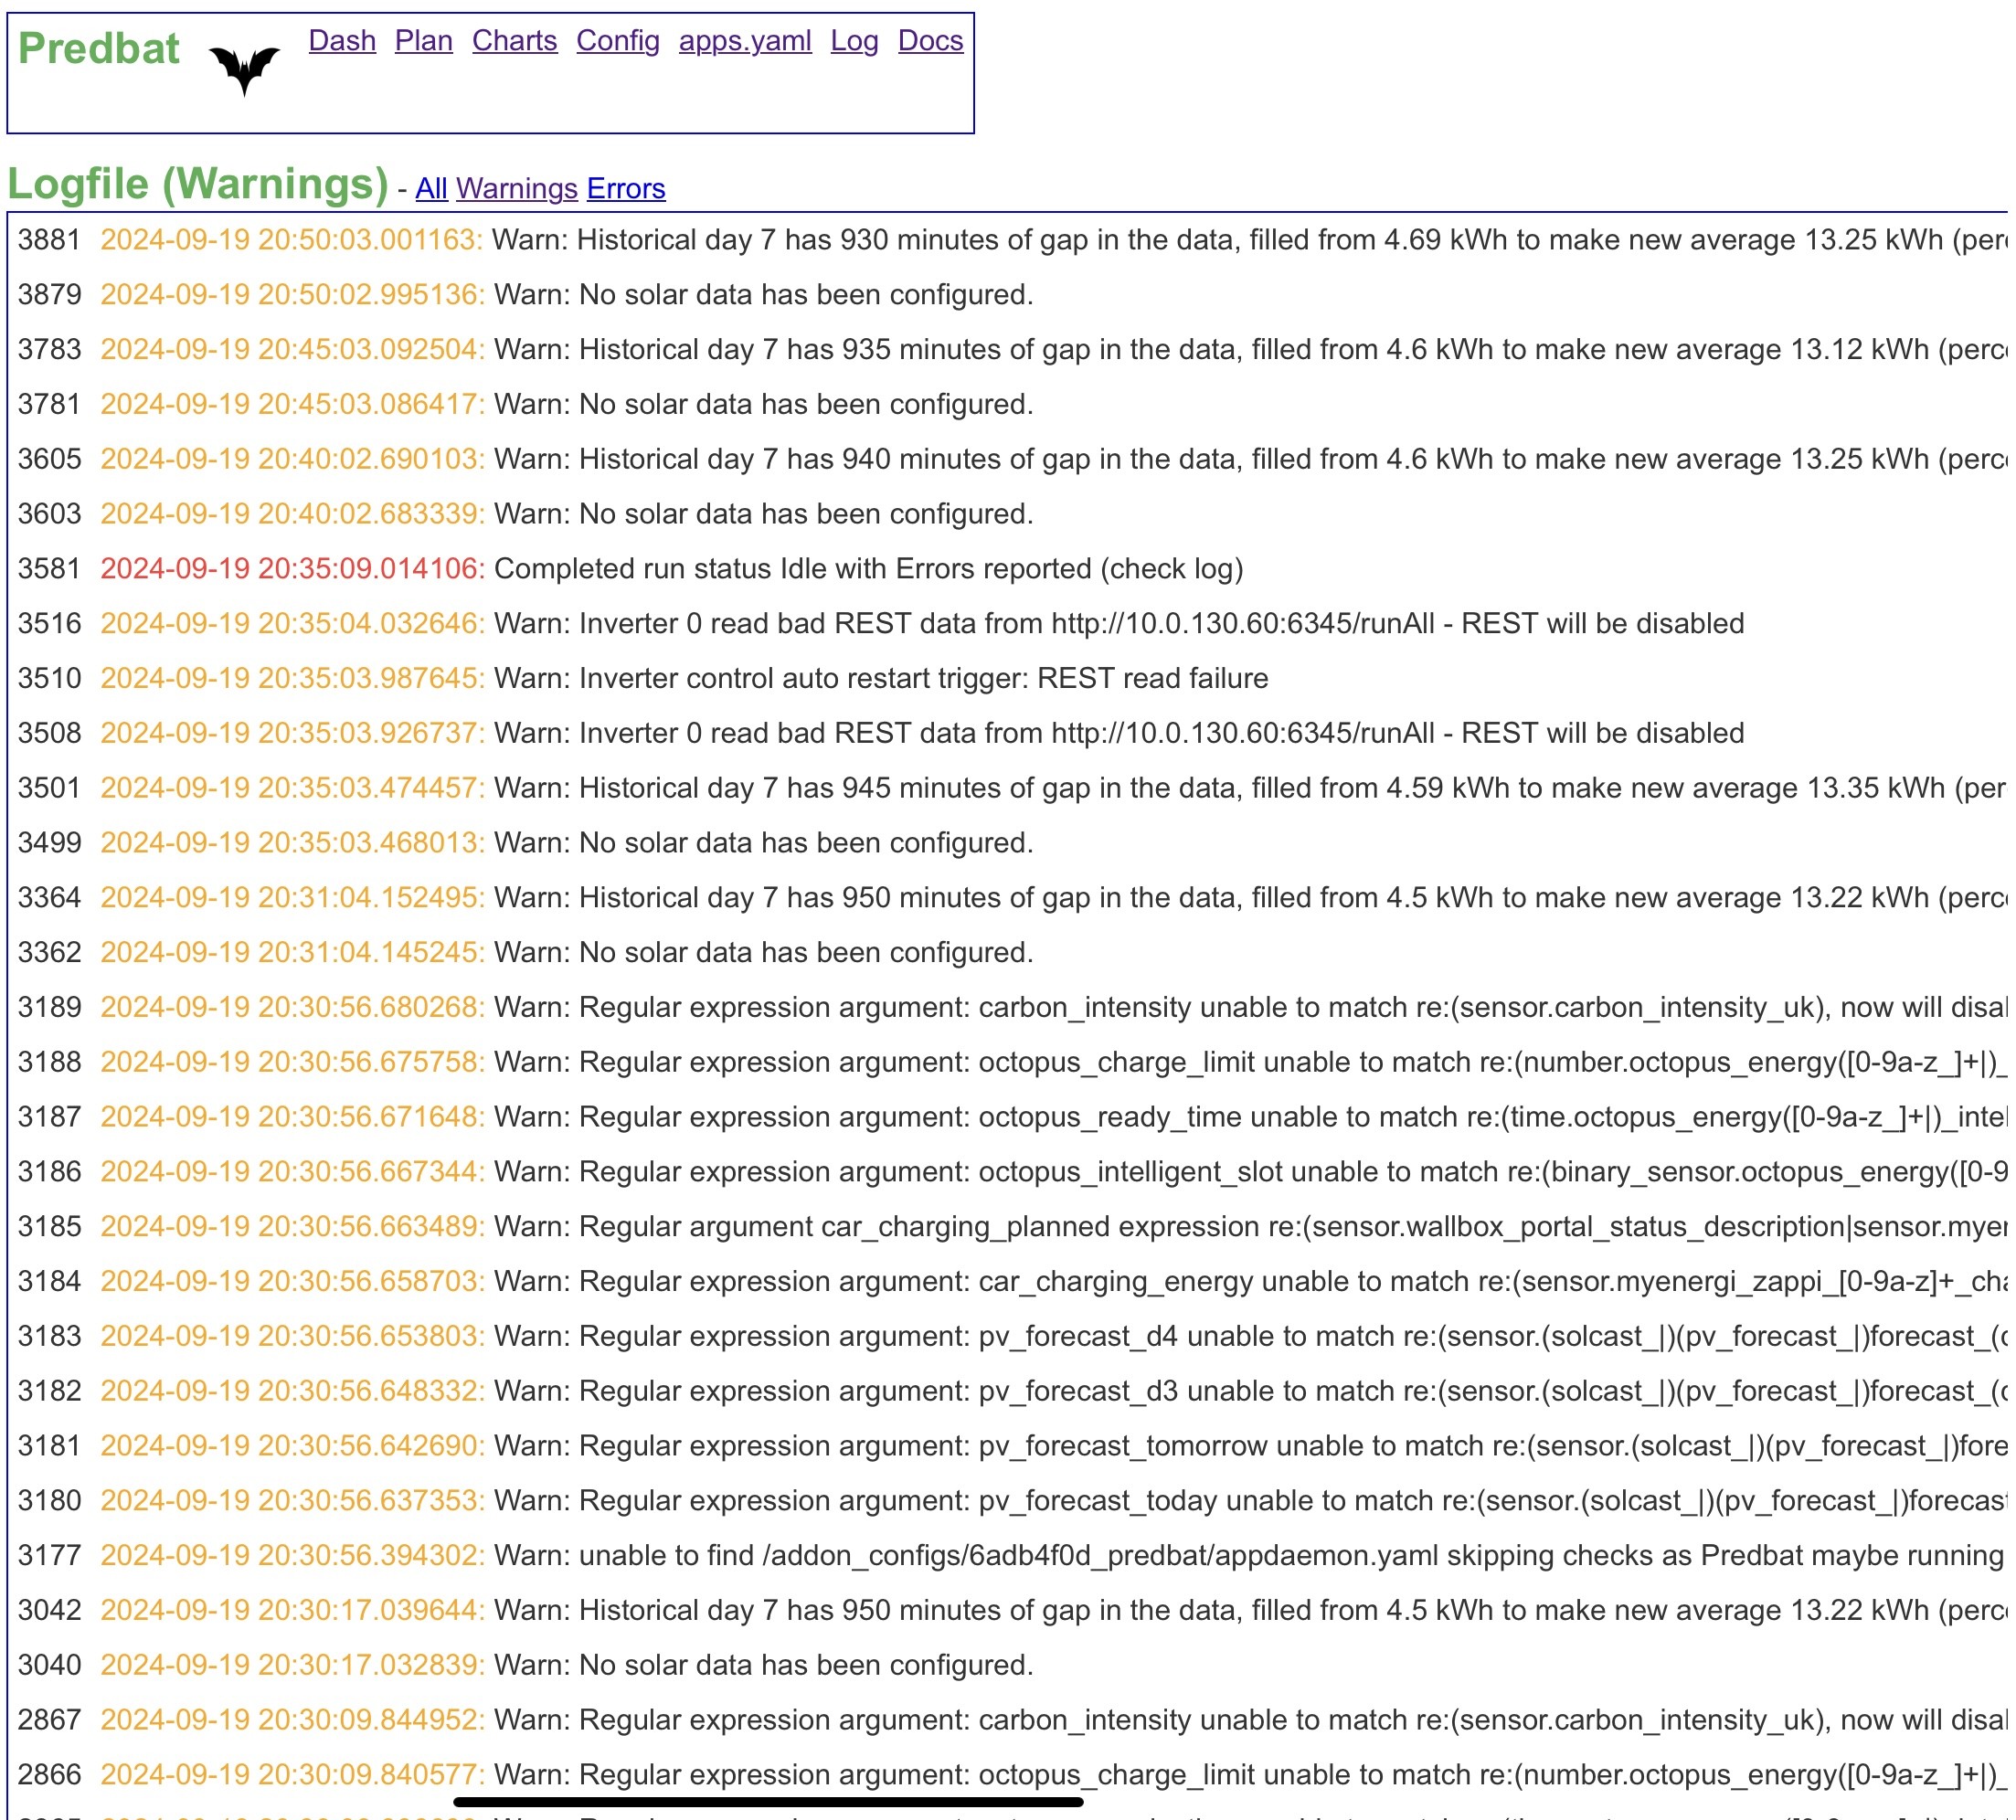
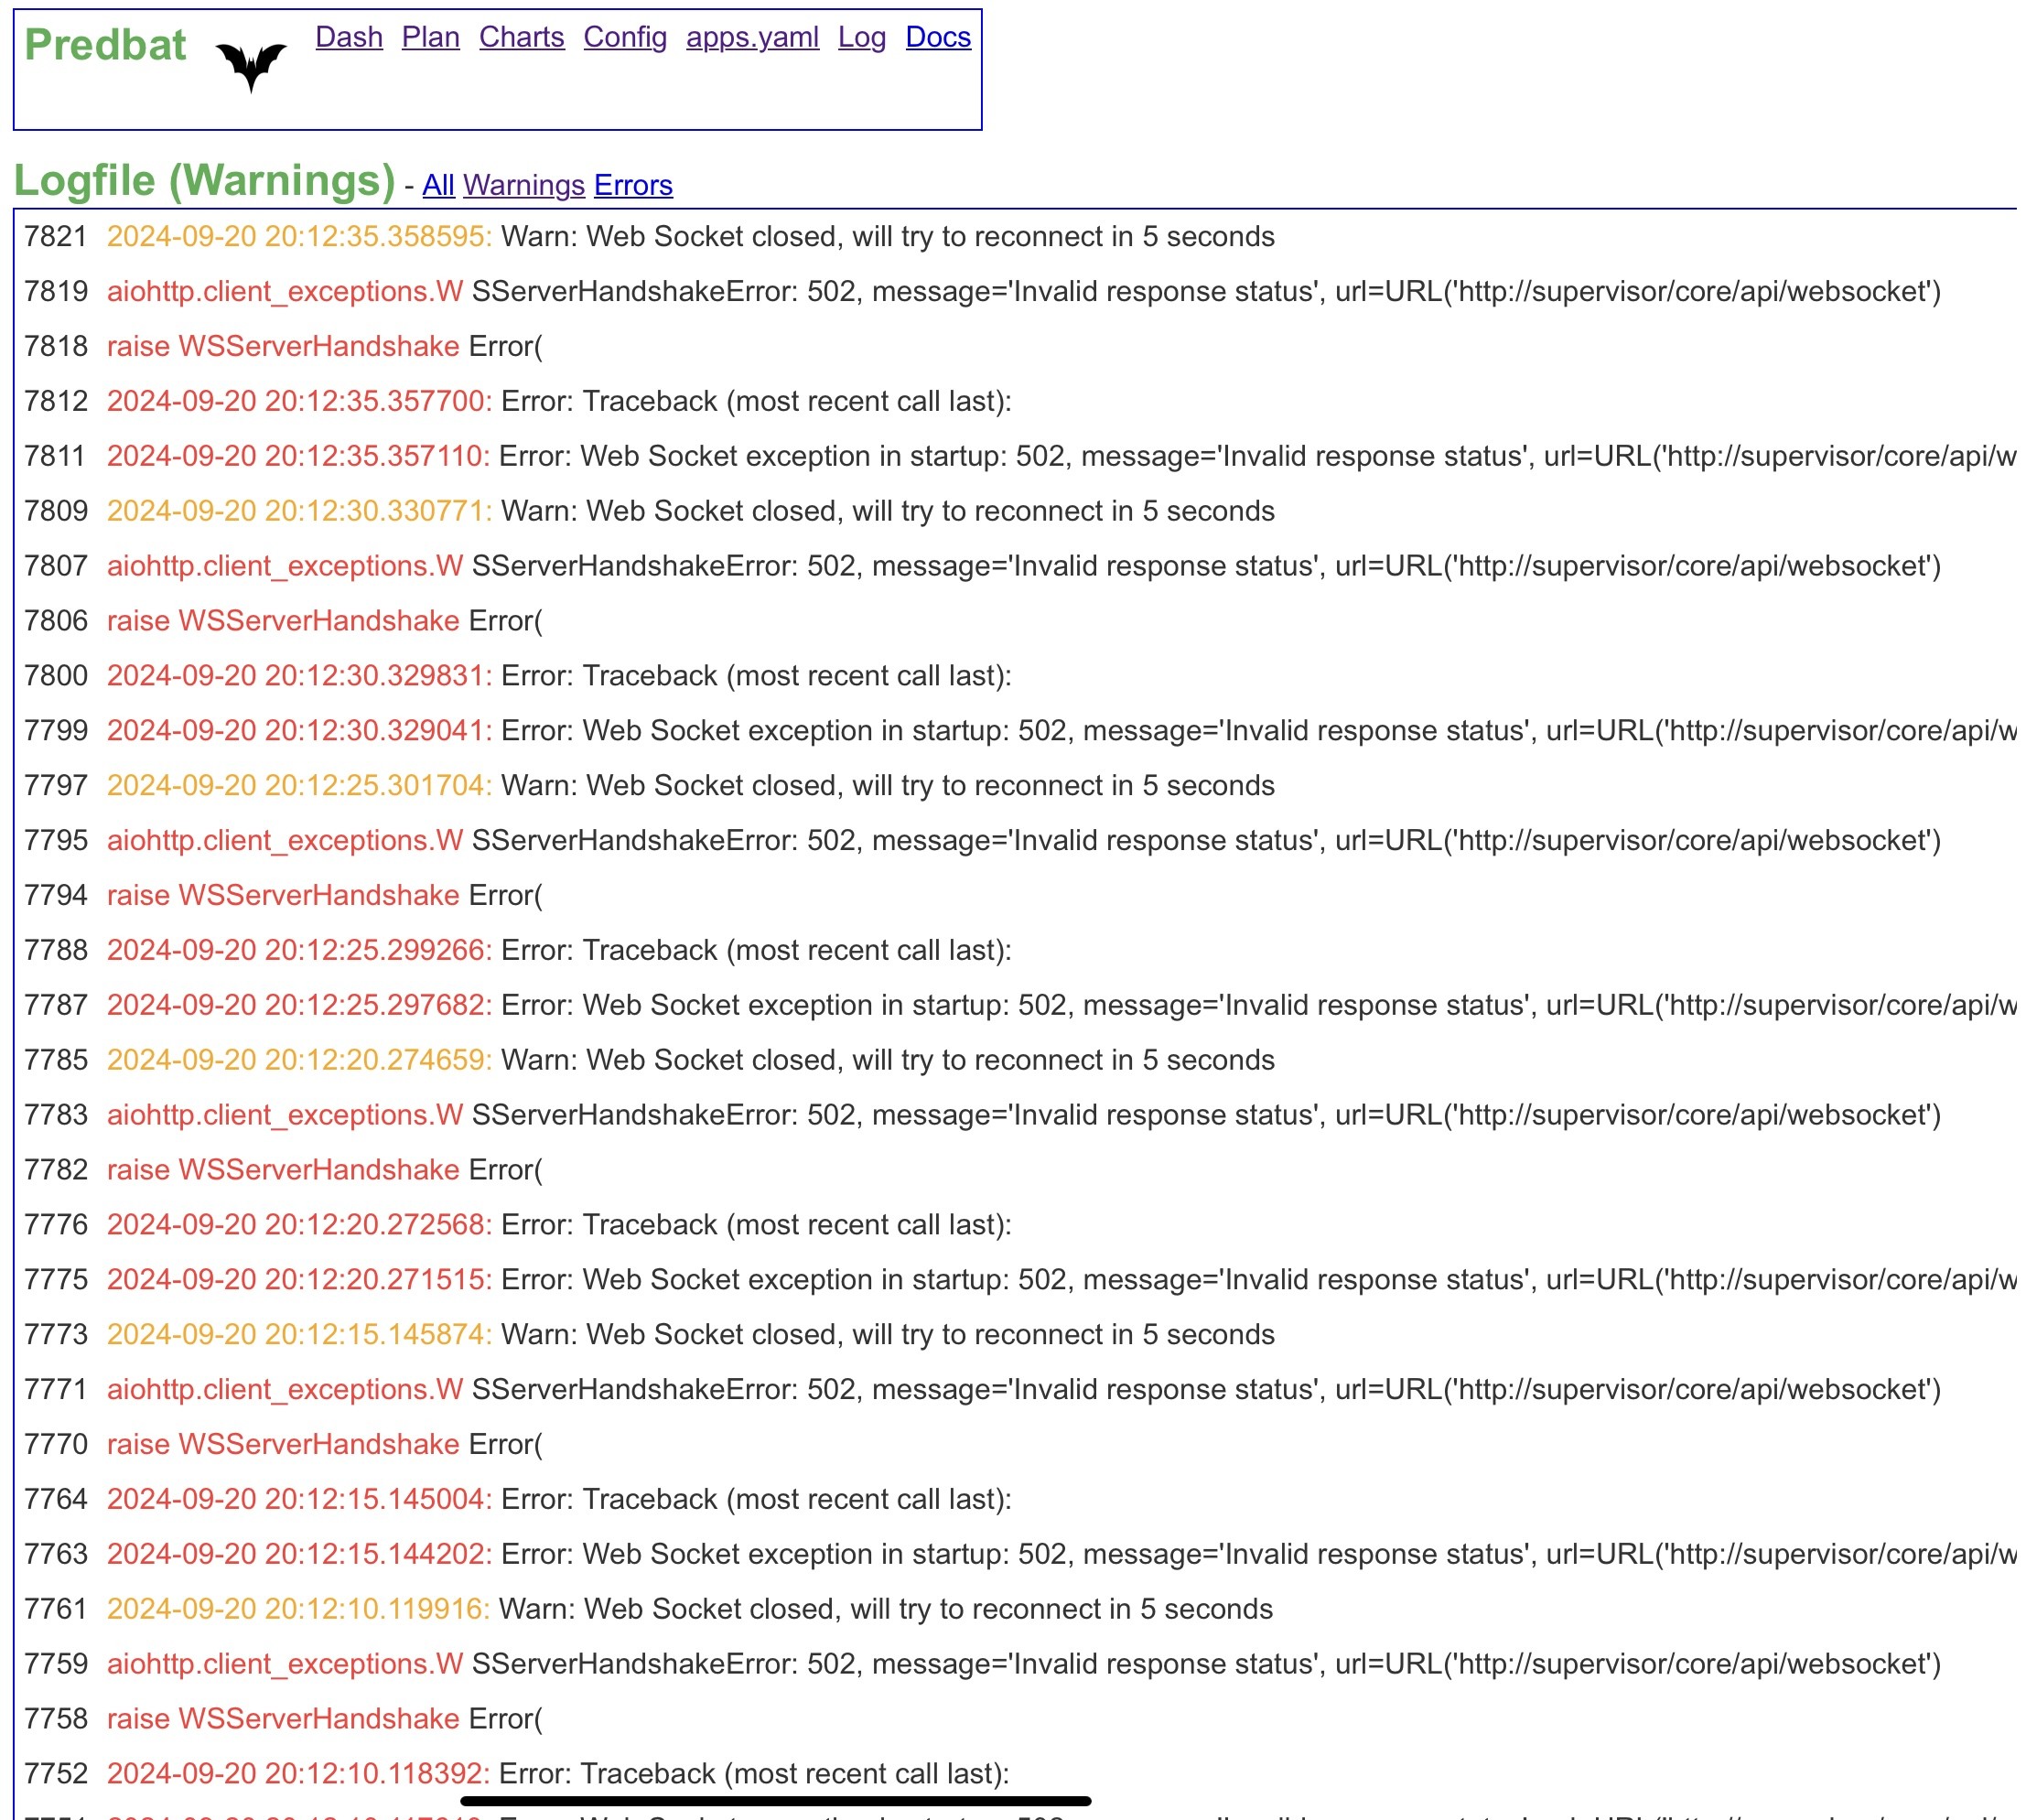
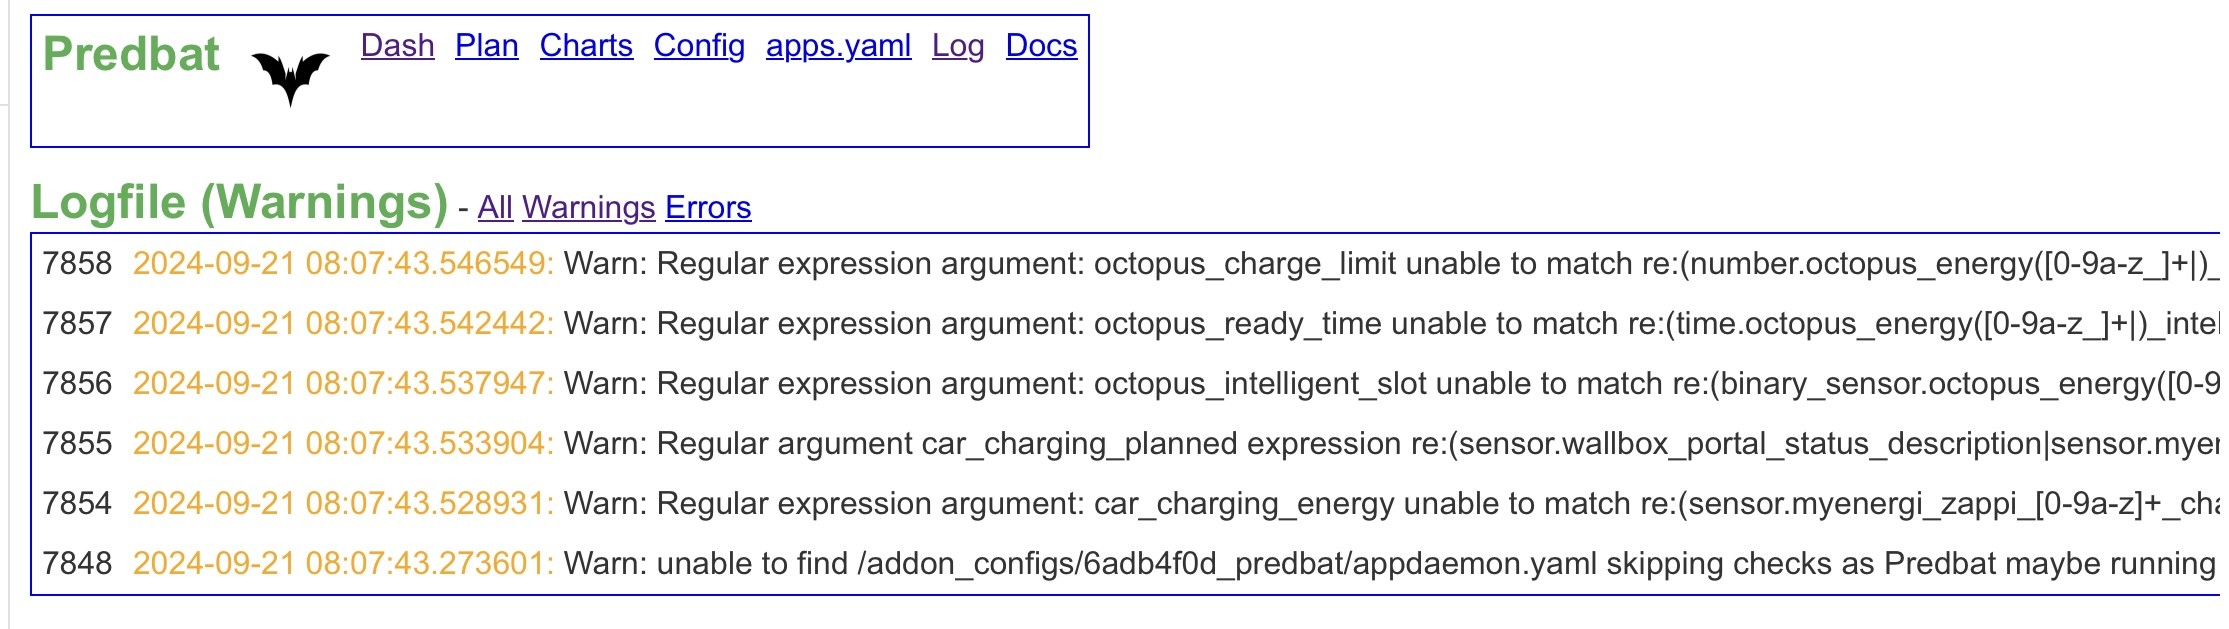
So getting there, warnings now looks like this,

G
#17 geoffreycoan

Daveb01 Almost all of those warnings are to do with car charging setup and some are specifically intelligent octopus go which are perfectly normal. I’ll add something to the documentation to highlight the normal behaviour
The last line is a warning to do with the predbat addon being used not the appdaemon addon, this is again normal and is already in the documentation that it can be ignored if using the predbat addon

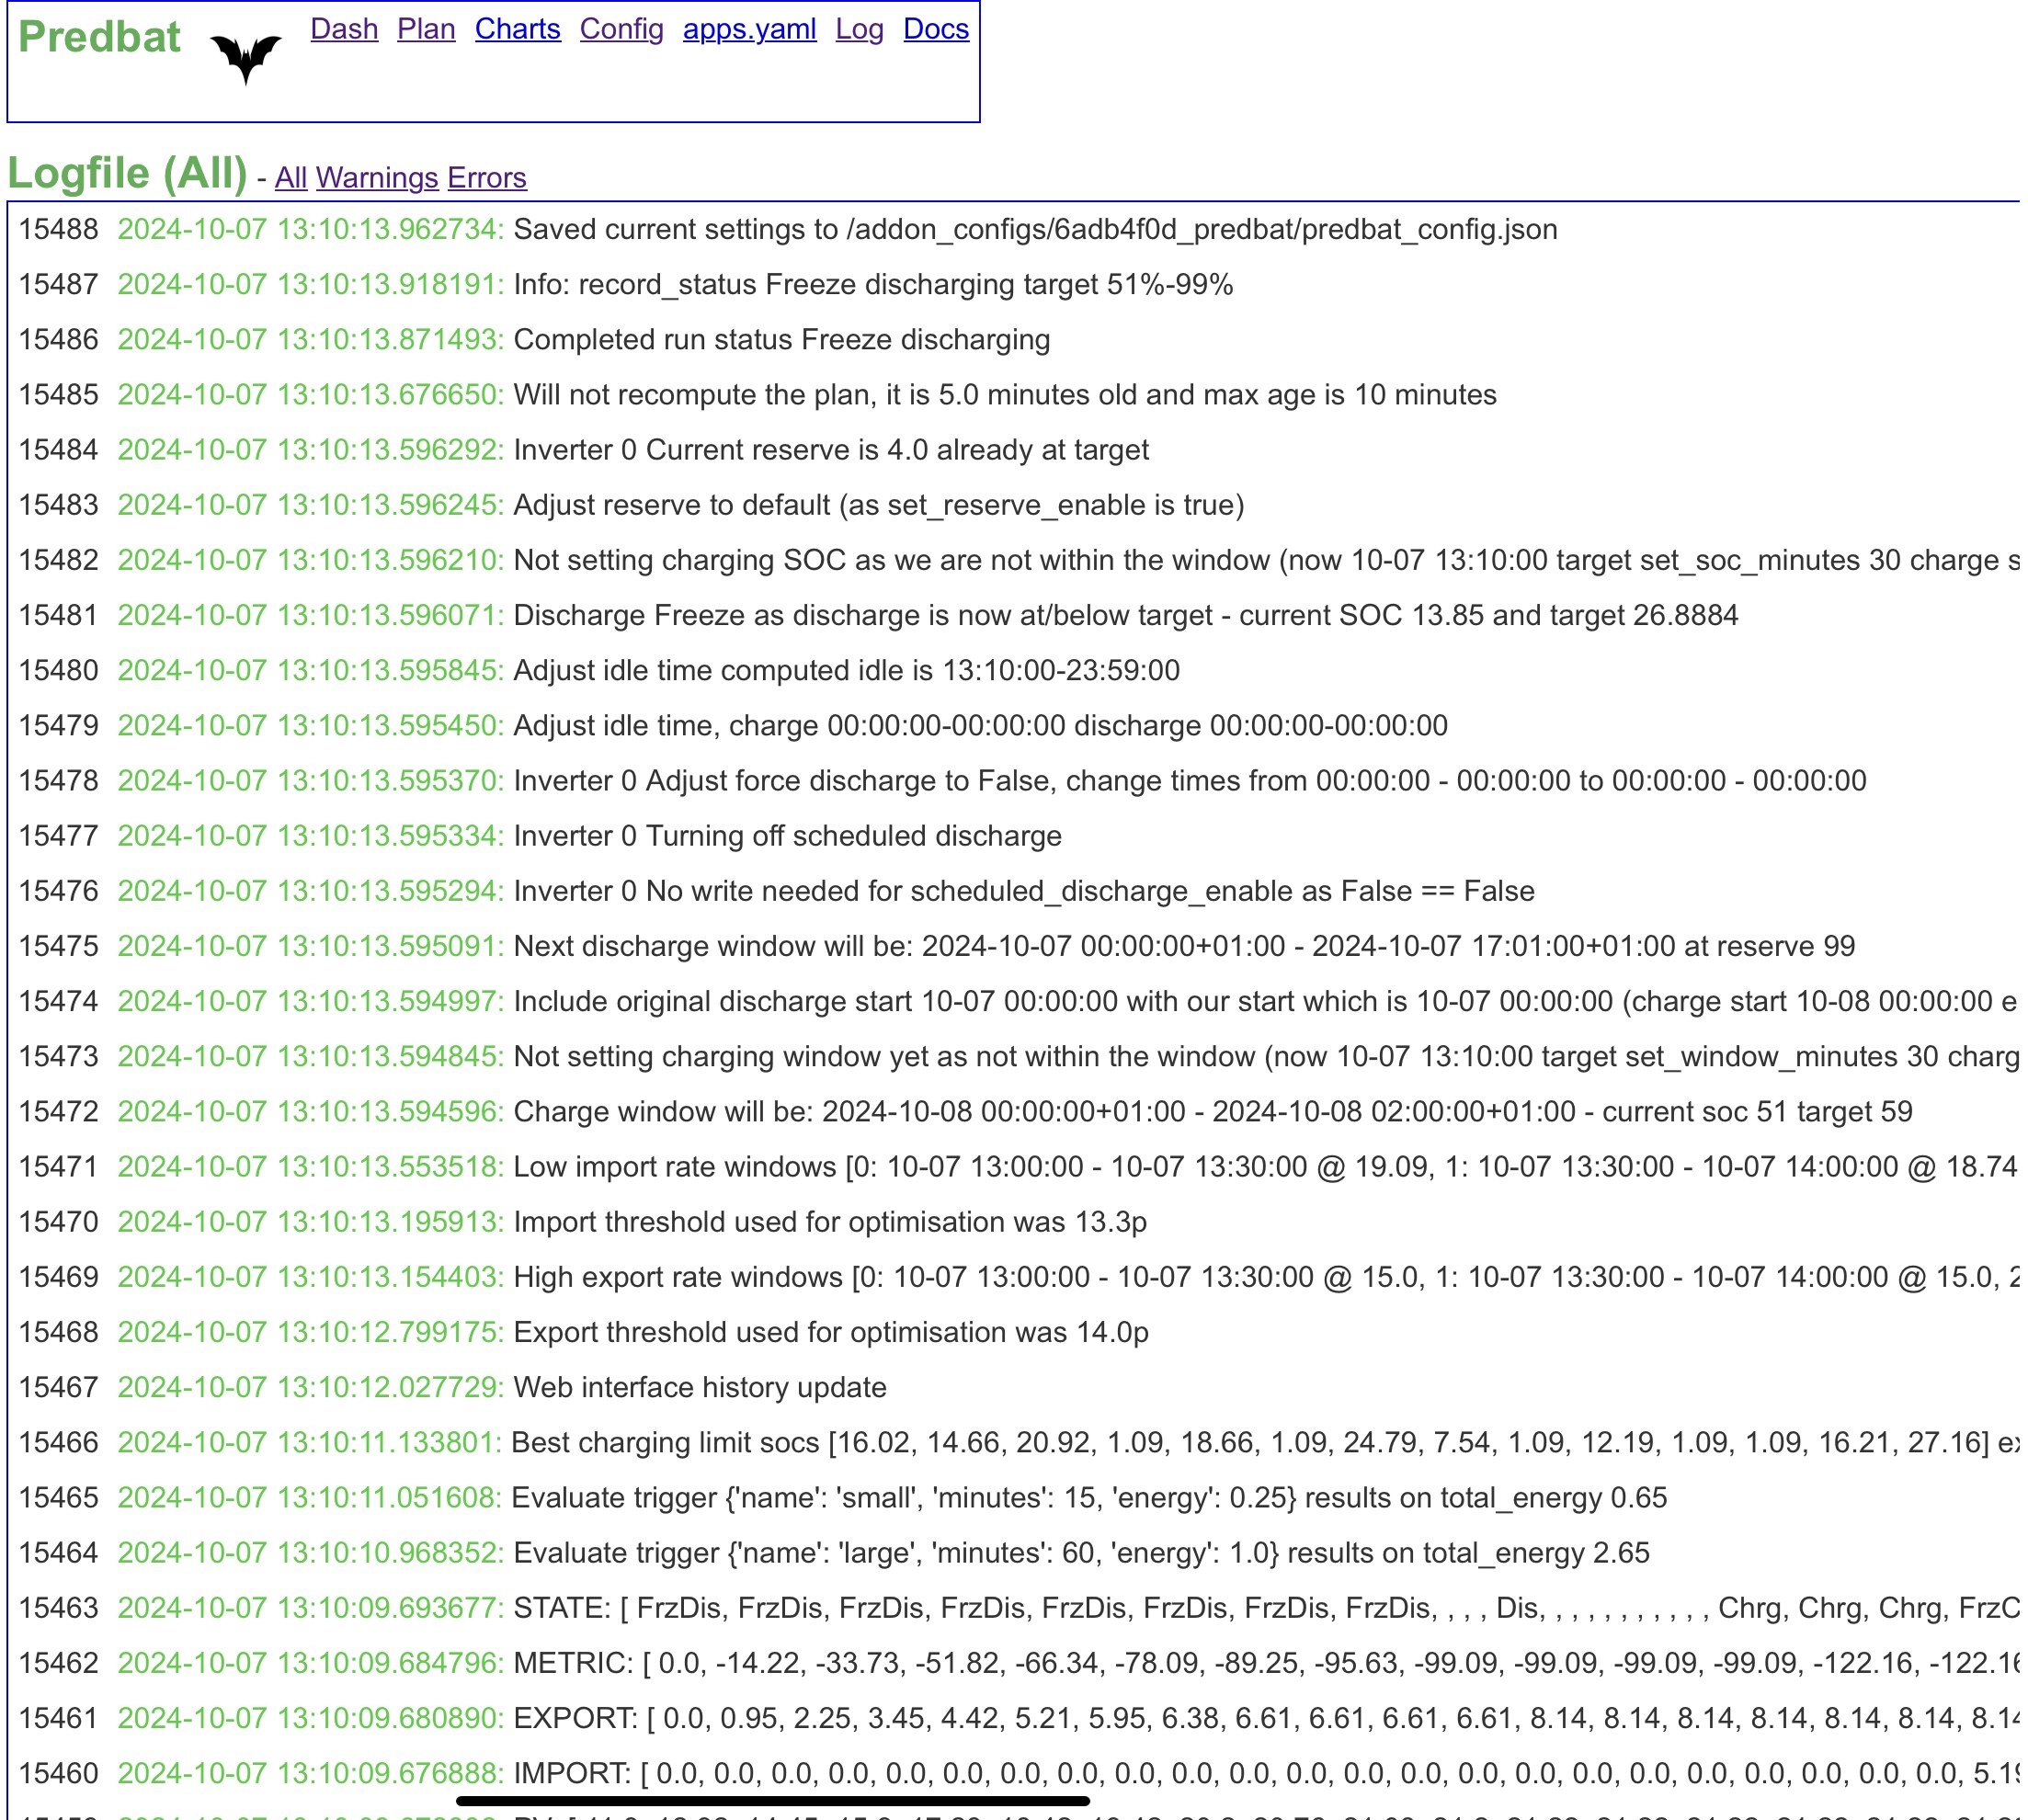
Have a look at the All view on Logfile, it should by now show predbat running normally

D
#18 Daveb01

geoffreycoan

So I think I will leave HA alone for the weekend and give you some pease. I have a few things now to look at from the other post, so will go back and jot them down on paper to start next week. I will now do a backup so I have a good place to return to.

Thank you again for all your help & have a good weekend (hope it does not rain to much where you are)

D
#19 Daveb01

geoffreycoan

As it is raining here today, i could not resist having a look at HA this morning, went to Predbat/logs and now get this 😀👍

G
#20 geoffreycoan

Daveb01 Absolutely rubbish solar day for me as well, don’t think I will get my batteries fully charged from solar today 🥴

Do look at the Logfile (all) and get used to seeing what normal running looks like - not just filtering on the warnings/errors

But great news that it’s working for you now. Assume you are in read only mode still? Build yourself a basic dashboard, start understanding what predbat is planning and tweak the config to get it to what you want it to be

D
#21 Daveb01

geoffreycoan

As it has been raining, I have been reading the apps.yaml doc from Trevor. So I now have 9 questions on settings and one general question about EVC.

This is in order in the yaml file

  1. Inverter Limit - I have it set to 6000 (could be 12000 as I have 2 x AIO but I don’t want it importing/exporting at 12000. As this is set in the cloud and I find it better to change it there can I comment it out, or do,I have to have this setting active?

  2. Export Limit - I have it set to Commented out as per Trevor guidance?

  3. Inverter Rate Minimum - I have this commented out as per your suggestion for AIO.

  4. Inverter Reserve Maximum - I have it set to 98, but the doc says AIO does not like it set to 100, if I want it to get to 100 I should comment it out? What’s best or should I try both?

  5. Battery Charge Power Curve - I have it commented out, but Trevor has it on, what’s your advice please?

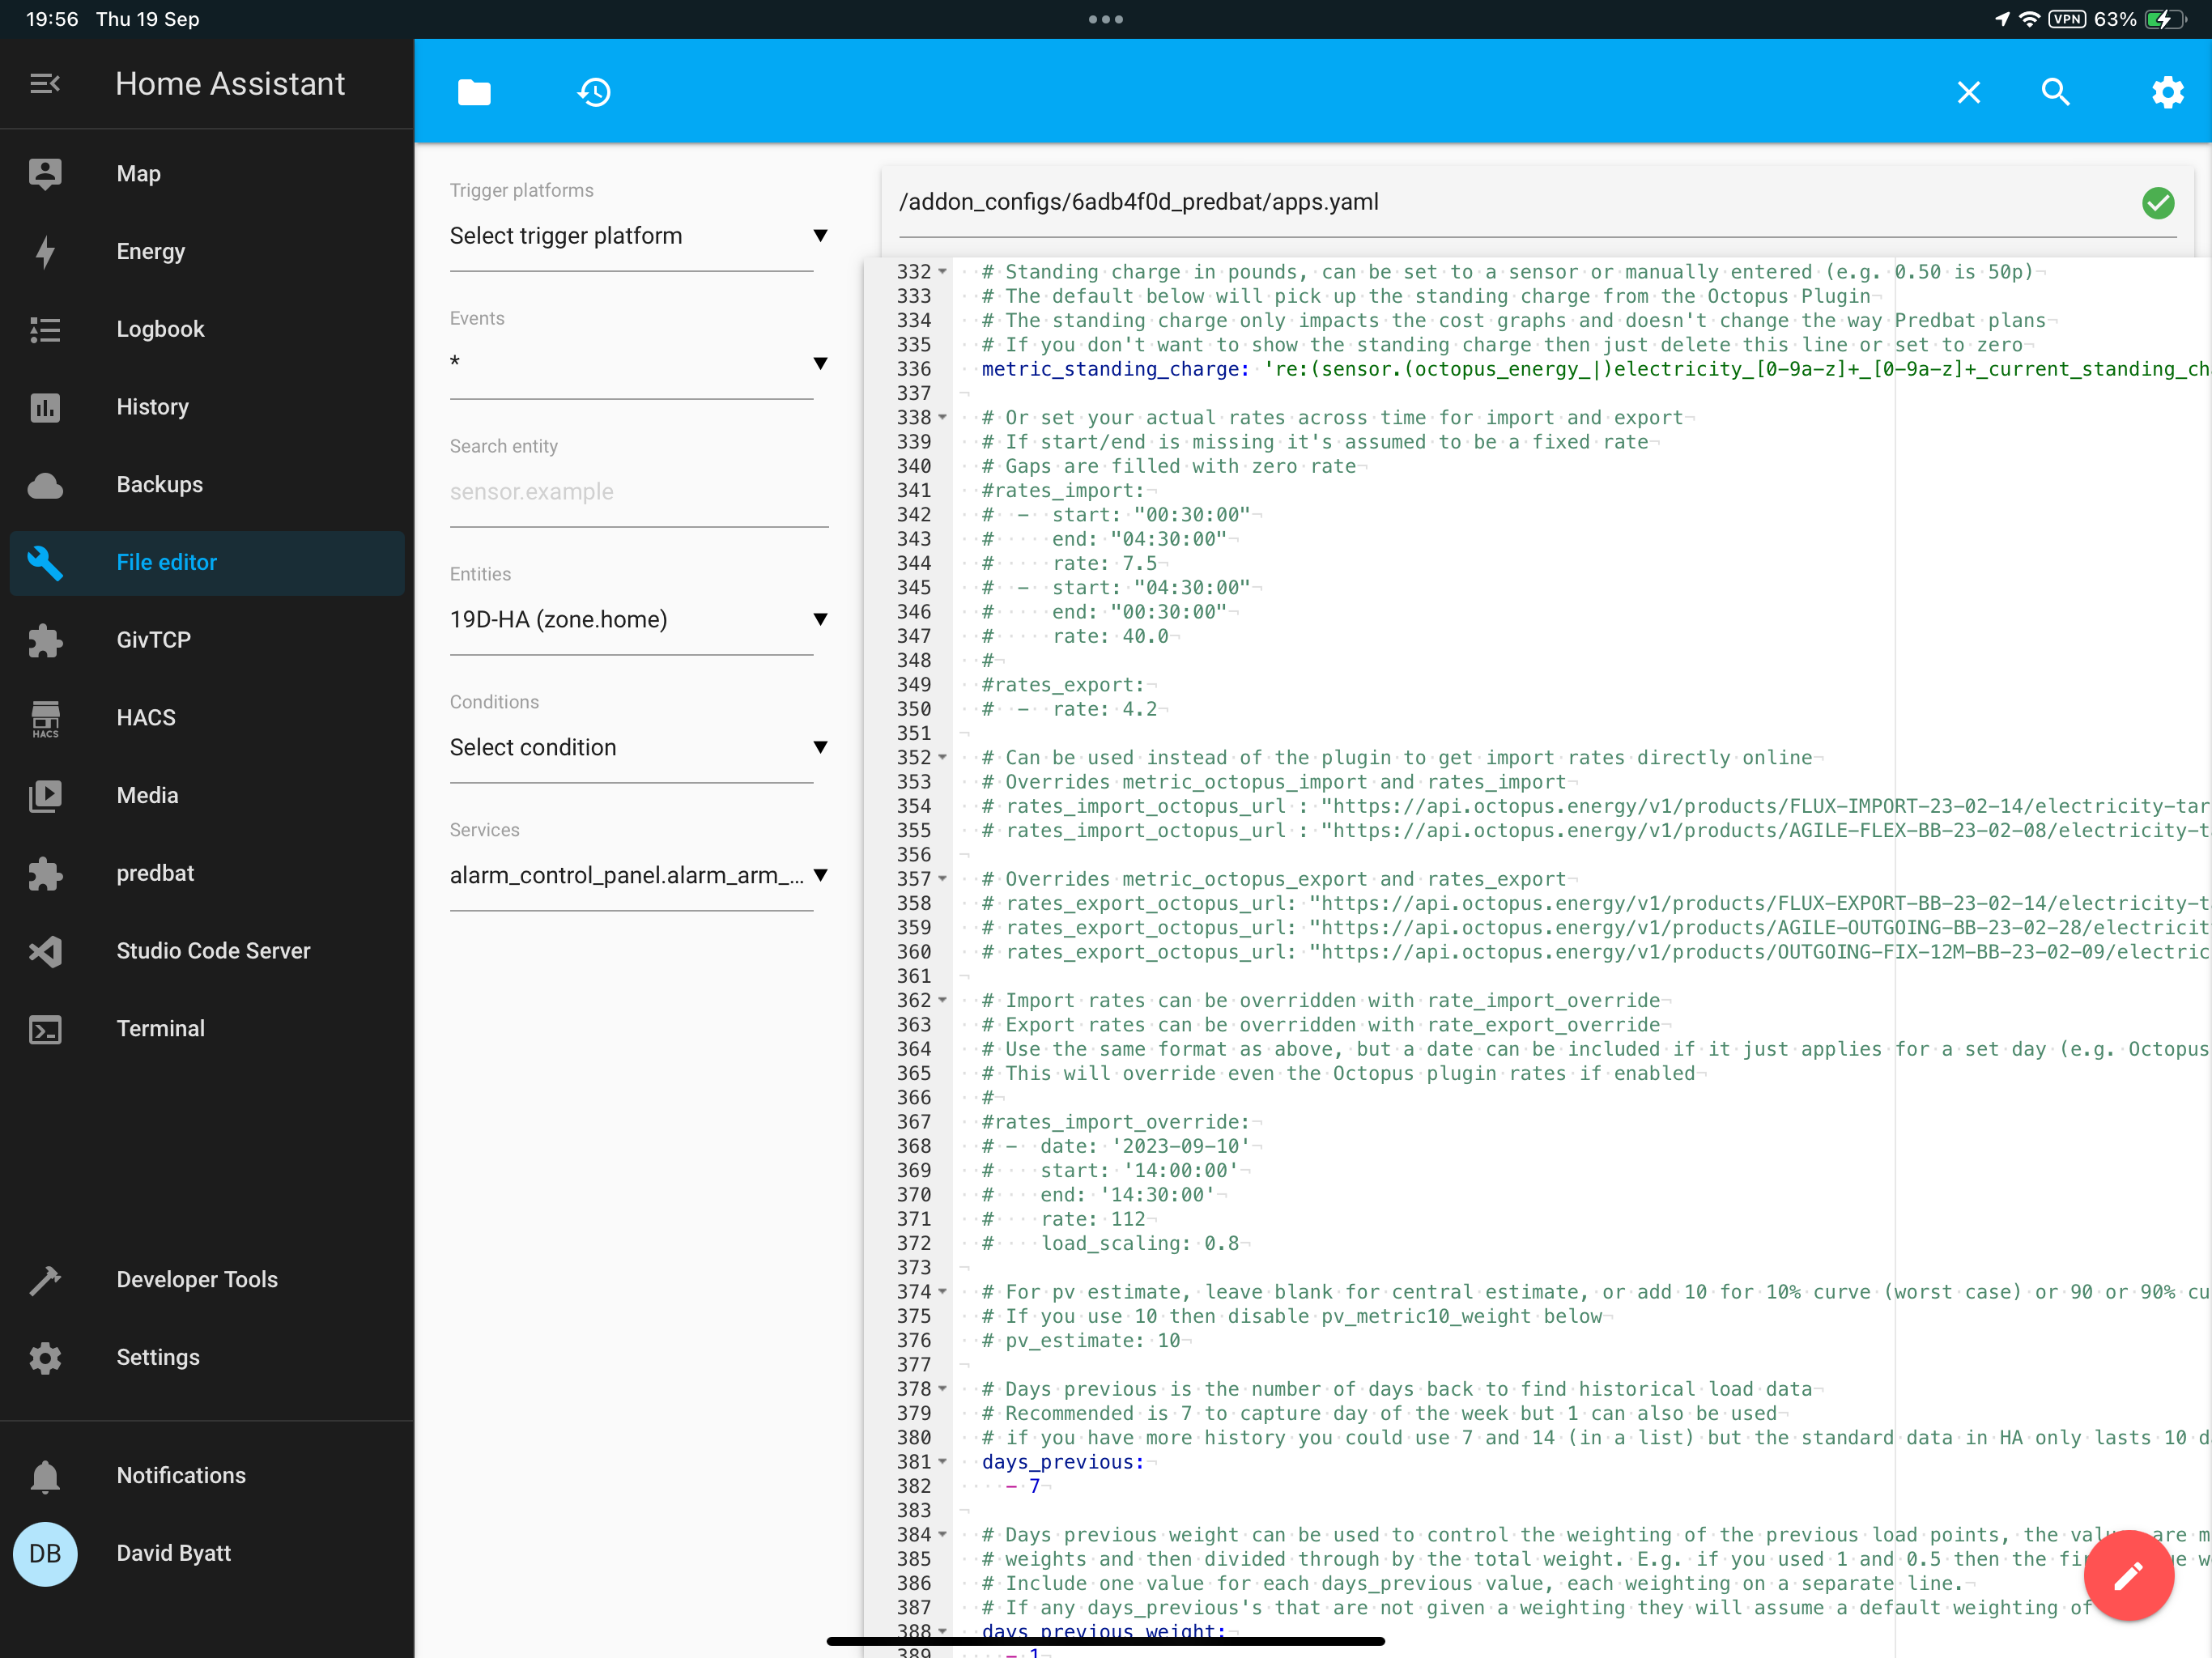
  6. Clock Skew - I have it set to 0 (GE systems for me seem to be about a min or two out, do you have this set)?

  7. Day’s Previous - I have this set to 2 & 3, doc says 7, Trevor said 1, 2 & 3, what’s your setting and your advice please?

  8. Battery Scaling - I have this set to 0.85 (as per doc for AIO), it does not mention multiple AIO so guessing this would be the same?

  9. Import Export Scaling - I have it set to 1 (any advice please?)

  10. I have a free GE EVC with the second AIO. My installer commissioned it and it’s available in the Cloud and the app. I do not have an EV. I am getting errors that GE say the DNO need to sort, so have switched it off. Is it worth setting it up in Predbat or should I leave it until I get an EV? (If I get an EV)

Thank you in advance.

R
#22 Rbor

geoffreycoan

Absolutely rubbish solar day for me as well, don’t think I will get my batteries fully charged from solar today

Things brightening up (marginally) in Yorkshire. At 3 pm, I had chalked up 1.2 kWh for the day. Generation has increased to 690 W. Will I get up to 3 kWh for the day? 😎

Rob

G
#23 geoffreycoan

Daveb01 This is in order in the yaml file

Inverter Limit - I have it set to 6000 (could be 12000 as I have 2 x AIO but I don’t want it importing/exporting at 12000. As this is set in the cloud and I find it better to change it there can I comment it out, or do,I have to have this setting active?

Predbat controls your inverter so any settings you put in the cloud could well be overwritten by Predbat. If you want a lower inverter limit then set it in apps.yaml although I don’t know why you wouldn’t want to import or export at the max rate you can do, but up to you.

Export Limit - I have it set to Commented out as per Trevor guidance?

If you don’t have an export limit, leave commented out. Mine is commented out

Inverter Rate Minimum - I have this commented out as per your suggestion for AIO.

OK

Inverter Reserve Maximum - I have it set to 98, but the doc says AIO does not like it set to 100, if I want it to get to 100 I should comment it out? What’s best or should I try both?

The default was changed to 98% as some AIO’s and Gen 2’s and 3’s didn’t like it being set to 100%. This may be fixed in newer firmware so feel free to try changing it to 100, but you need to set it to a value

Battery Charge Power Curve - I have it commented out, but Trevor has it on, what’s your advice please?

As it explains in the documentation, the battery charge curve helps predbat understand how the battery charging slows down as it approaches full or empty. The benefit is a more accurate plan but until you have had a few cycles of the battery from full to empty in your givtcp history you won’t be able to create the curve anyway. I would leave it off for a week or so.

Clock Skew - I have it set to 0 (GE systems for me seem to be about a min or two out, do you have this set)?

You can force a clock sync from the GE portal to your inverters. I get a bit of drift but not a lot so don’t have it set in my apps.yaml. You want the clock to be accurate so predbat starts charging and discharging at the right time. I would try a clock sync first.

Day’s Previous - I have this set to 2 & 3, doc says 7, Trevor said 1, 2 & 3, what’s your setting and your advice please?

Look at the end of apps.yaml documentation, there’s a long explanation of how days previous works. The advice is not to use 1. 2 and 3 is fine. Mine is set to 2 through to 8 so I average over the whole of last week. Some people have 2-8 plus 14 and 21 to give more weight to same day in the past. Personal choice and depends on your household pattern of consumption.

Battery Scaling - I have this set to 0.85 (as per doc for AIO), it does not mention multiple AIO so guessing this would be the same?

It does cover multiple AIO’s because I wrote it in there recently. Same advice yes

Import Export Scaling - I have it set to 1 (any advice please?)

You shouldn’t need to change this unless you think your CT clamps are incorrectly reading your import and export

I have a free GE EVC with the second AIO. My installer commissioned it and it’s available in the Cloud and the app. I do not have an EV. I am getting errors that GE say the DNO need to sort, so have switched it off. Is it worth setting it up in Predbat or should I leave it until I get an EV? (If I get an EV)

There’s no point in setting it up in Predbat as Predbat will want to start controlling it and you don’t have an EV so no benefit to having it controlled. Do it if and when you need to.

R
#24 Rbor

Rbor Well, I finished up with 3.22 kWh for the day, my lowest generation (ignoring 2 days when snow covered everything) since 4th Feb. And forecast for rest of week is not looking good.
Sept 2023 seems to be a dream.

Rob

D
#25 Daveb01

Rbor

I was also hoping to get to the end of September without charging the battery from the Grid. I have charged it once or twice in September so far, but not cost me to much.

Import - £11.41
Export - £42.22
Gas - £8.13
Plus Standing charge

D
#26 Daveb01

geoffreycoan

All sorted as suggested, thank you again.

I had a question about what to do about updates? I was going to ask this latter in the week.

What’s your advice please
Tick the auto update box (hhhmmm not advisable I think)
Update when you guys say it’s safe to do so
Update everything in the list once a month?

Very spooky I has my first notification Predbat update 1.2.1.

R
#27 Rbor

Daveb01 Forget updates for the moment. Just get up and running.
v3 is very betaish,
geoffreycoan and I are trying to get to grips with the v3 variants. We have also raised issues with developers in Github do watch this space.

Rob

G
#28 geoffreycoan

@Daveb01 I personally favour stability over bleeding edge. I tend to update Predbat fairly frequently but only update Home Assistant about 3 weeks after each new version comes out to give it time for a couple of patch releases to be issued (I went from 2024.8.2 to 2024.9.2 for example).

GivTCP v3 I went to quicker than I normally would as it had had a lot of beta testing but yet Rob and I have found issues that have resulted in both of us reverting back to v2.4.9.

I would focus on getting everything working first and only take upgrades when they are needed to fix a specific issue

D
#29 Daveb01

geoffreycoan

Thank you good advice.
Two more general questions please.

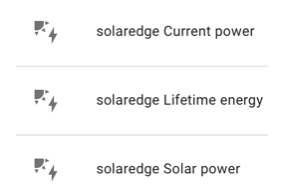
I have a SolerEdge inverter and followed Speak to the Geek install if that add-on, I have also just seen there is a SolarEdge Panel, add-on so will try that as well.

My question is - I now have two ways to get Solar info I guess I can chose what I want to display in the Dashboard but which does Predbat use GivTCP from the GW or SolarEdge if I have the integration? I have a 9kw system with a 6kw inverter (as 9 panels are on North roof), the output to the GW will be 6kw and the Predbat calculations would be as expected. If Predbat goes for SolarEdge then it may see solar production above 6kw in the summer, would Predbat change its Plan etc?

D
#30 Daveb01

I think I am now ready to look at The Dashboard. I have downloaded the PowerFlow Plus. battery card etc. I have read some documentation and it is suggested I have two a Predbat Dashboards so have set up Predbat Display & Predbat Control. I also have the defaults.
I understand I can configure my own, however I can do that in the future after I have seen a few examples. I like your Predbat Plan as you have correct headings at the top of the columns. Can you help me set up my Dashboard the same as yours and I can go from there.

The issue I have at the moment is when you choose a plugin you have to sometimes 30 plus integrations you can add but I have no idea which ones to add especially if there are more than one.


D
#31 Daveb01


D
#32 Daveb01

First thought is to use GW Meters


R
#33 Rbor

Daveb01 One step at a time!

I have a SolerEdge inverter and followed Speak to the Geek install if that add-on, I have also just seen there is a SolarEdge Panel, add-on so will try that as well.

I have a Solar Edge inverter but I have found only limited success with HA.
You are able to install an integration:
https://www.home-assistant.io/integrations/solaredge
I have managed to add some SolarEdge entities to the Energy Dashboard.

But I found that many were not enabled. I haven't looked at this for a while but I don't think I could enable many entities that looked useful.
I tend to just check Solar Edge inverter using web: https://monitoring.solaredge.com
But you will need to set this up using your credentials.

Rob

R
#34 Rbor

Daveb01

I have downloaded the PowerFlow Plus. battery card etc. I have read some documentation and it is suggested I have two a Predbat Dashboards so have set up Predbat Display & Predbat Control.

PowerFlow Plus: Speak to the Geek will take you all the way through this:
https://www.youtube.com/watch?v=C4Zh35E9wJE

Rob

G
#35 geoffreycoan

Daveb01 My question is - I now have two ways to get Solar info I guess I can chose what I want to display in the Dashboard but which does Predbat use GivTCP from the GW or SolarEdge if I have the integration? I have a 9kw system with a 6kw inverter (as 9 panels are on North roof), the output to the GW will be 6kw and the Predbat calculations would be as expected. If Predbat goes for SolarEdge then it may see solar production above 6kw in the summer, would Predbat change its Plan etc?

You can use whichever source of data you want for predbat, just change the name of the sensors configured under the pv_power section of apps.yaml. By default this is configured to use the givtcp sensors, but no issue to change it to the solaredge ones. If I were you, I would use the solaredge sensors if they can read the full PV generated, even if the AIO can’t accept all that AC. Then Predbat will generate the most accurate plan.

Daveb01 and it is suggested I have two a Predbat Dashboards so have set up Predbat Display & Predbat Control. I also have the defaults.

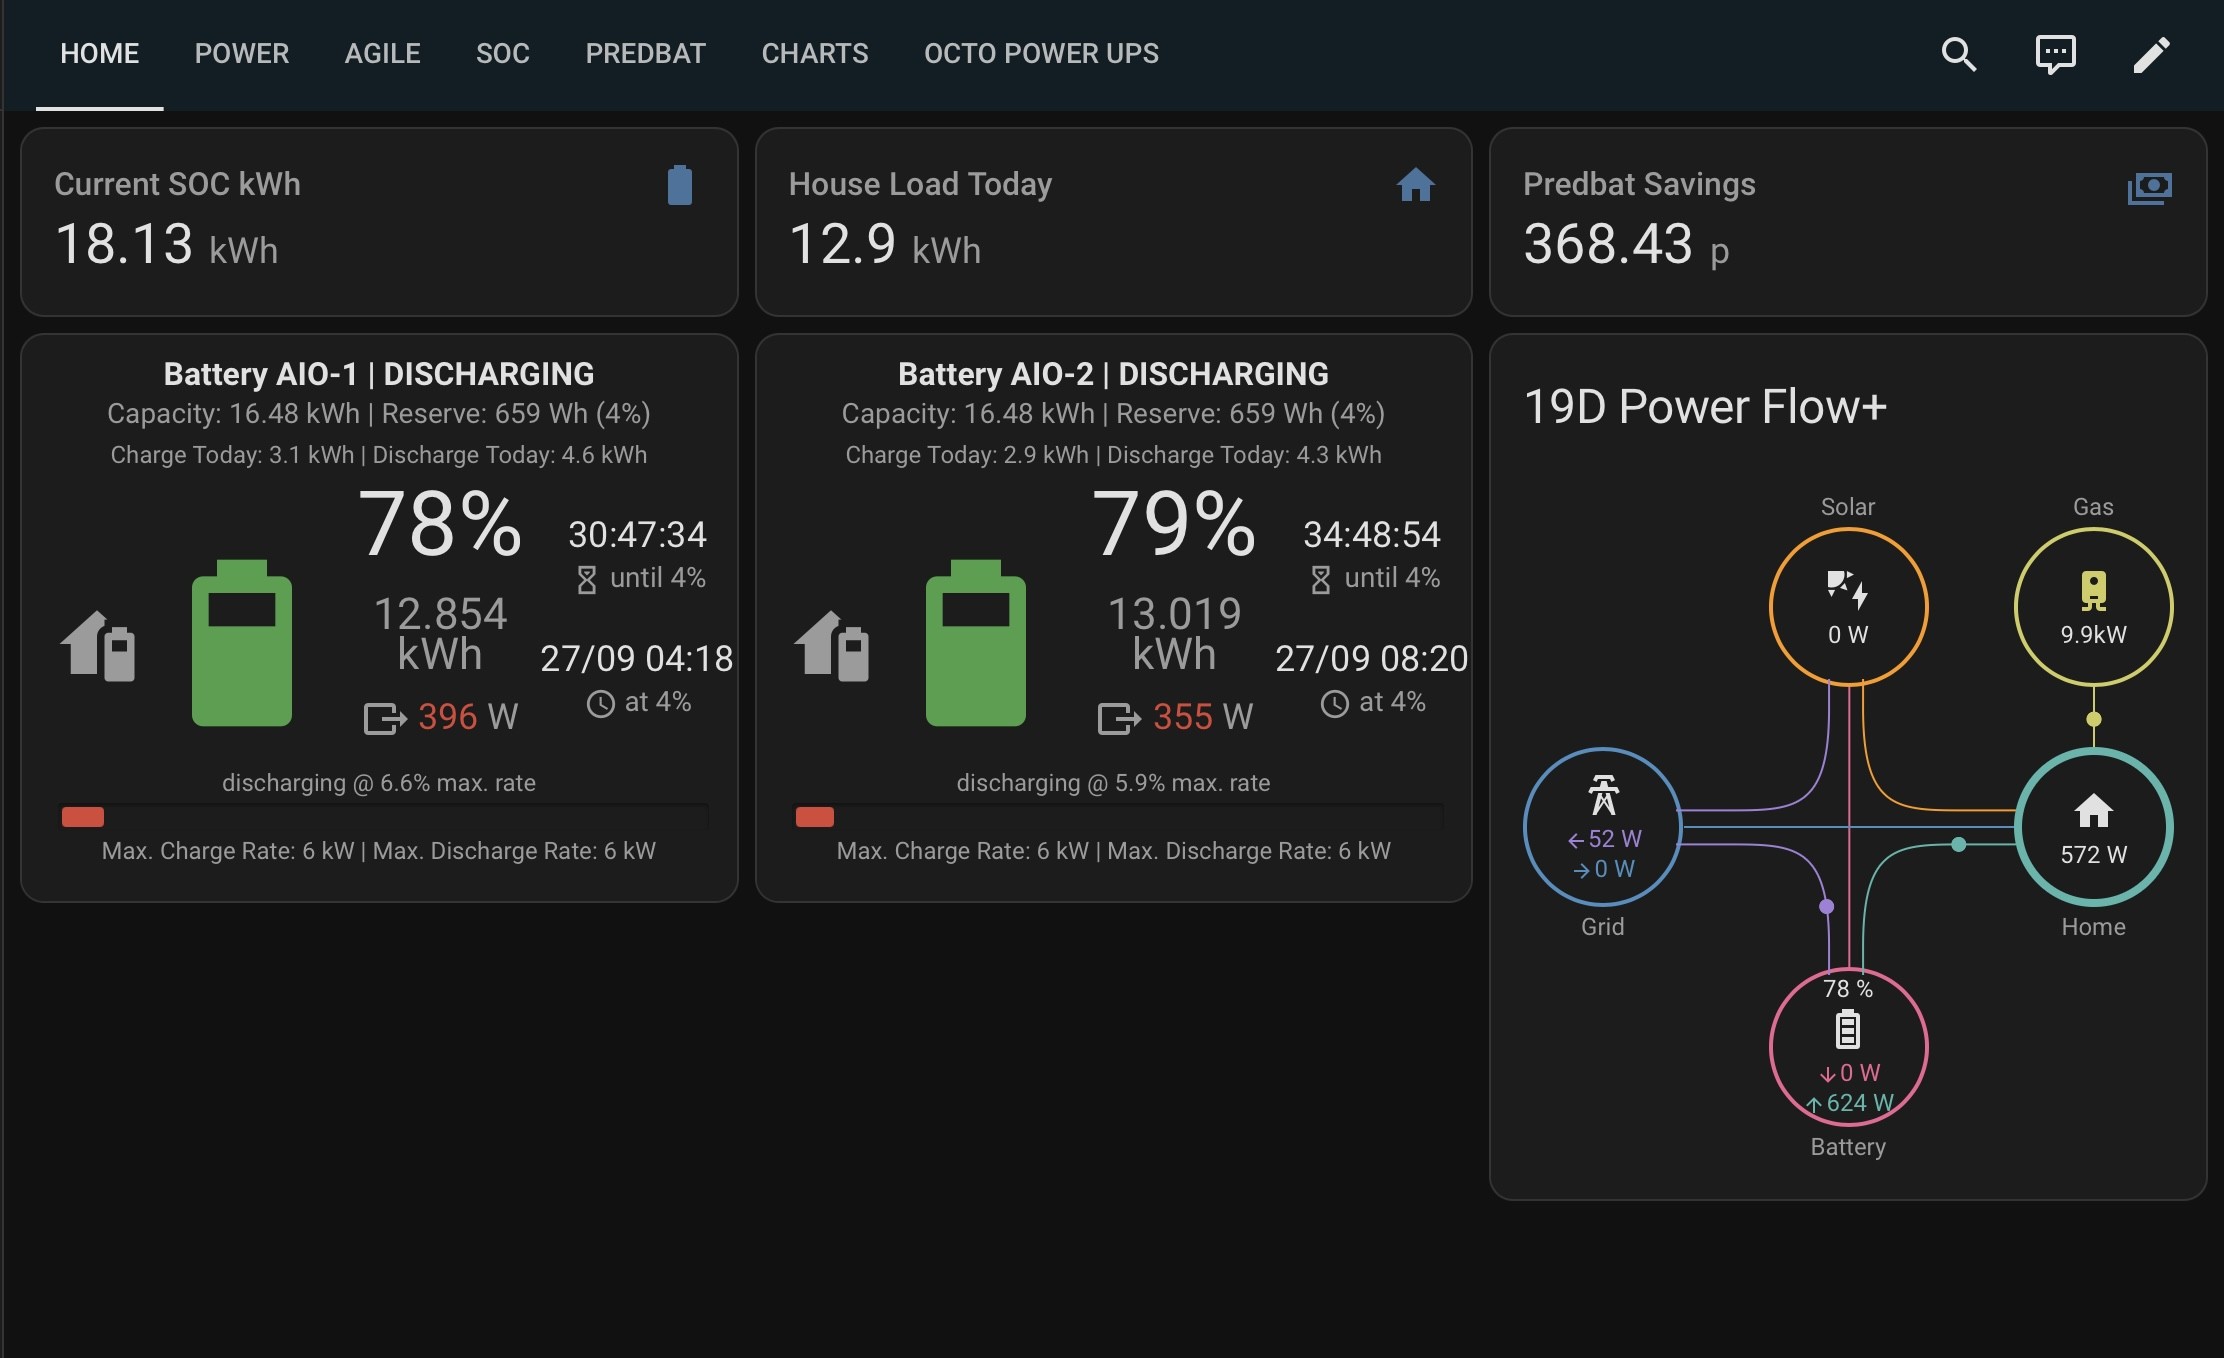
You don’t need to have multiple dashboards, although you can do if you want. I have just one GivEnergy dashboard and then have a series of Views along the top for ‘summary’, ‘predbat plan’, ‘predbat control’, ‘predbat charts’, etc.

Daveb01 I like your Predbat Plan as you have correct headings at the top of the columns. Can you help me set up my Dashboard the same as yours and I can go from there.

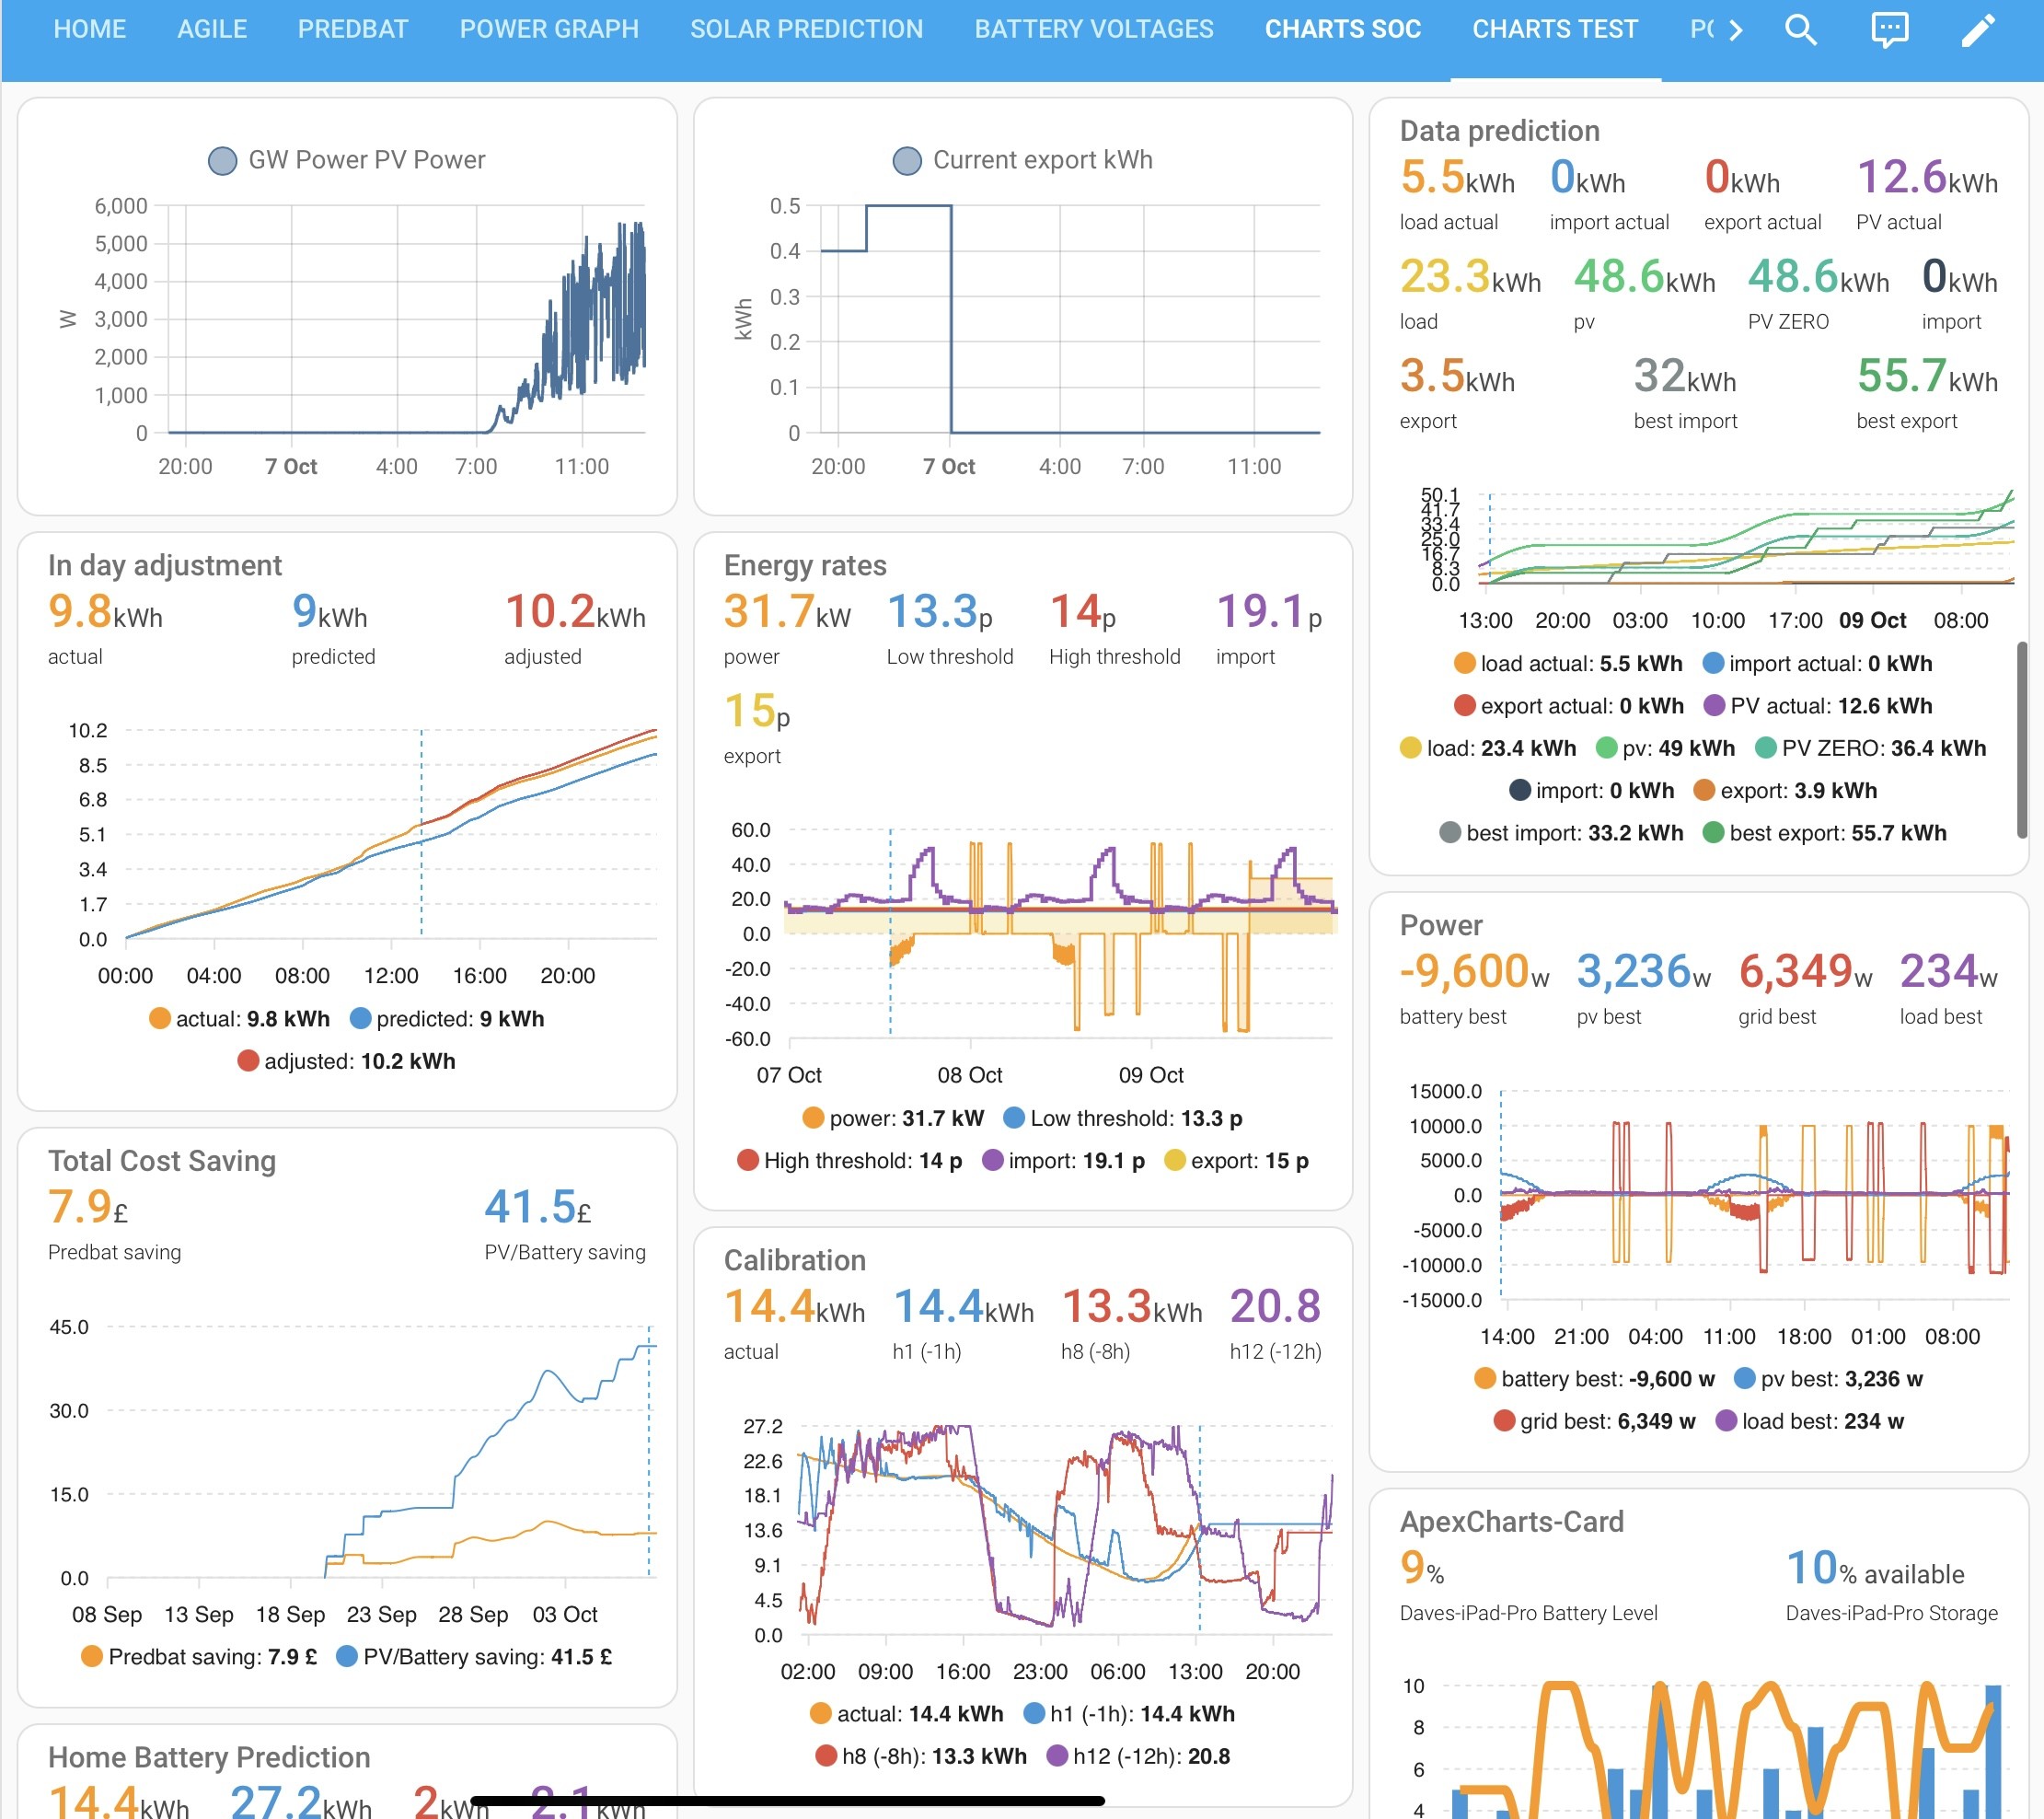
I will share my dashboard (or rather most of it as it is quite long) and then you can see how I have constructed it. It has grown organically and there are doubtless bits you don’t want/need. One thing you will notice is that some of the display cards are repeated on the dashboard - this is because different cards display depending on the screen size so I have more summary and portrait information when viewing on my phone, and more detailed and landscape information when viewing on my ipad. You don’t have to do this and you can just choose one set of displays if you want to.

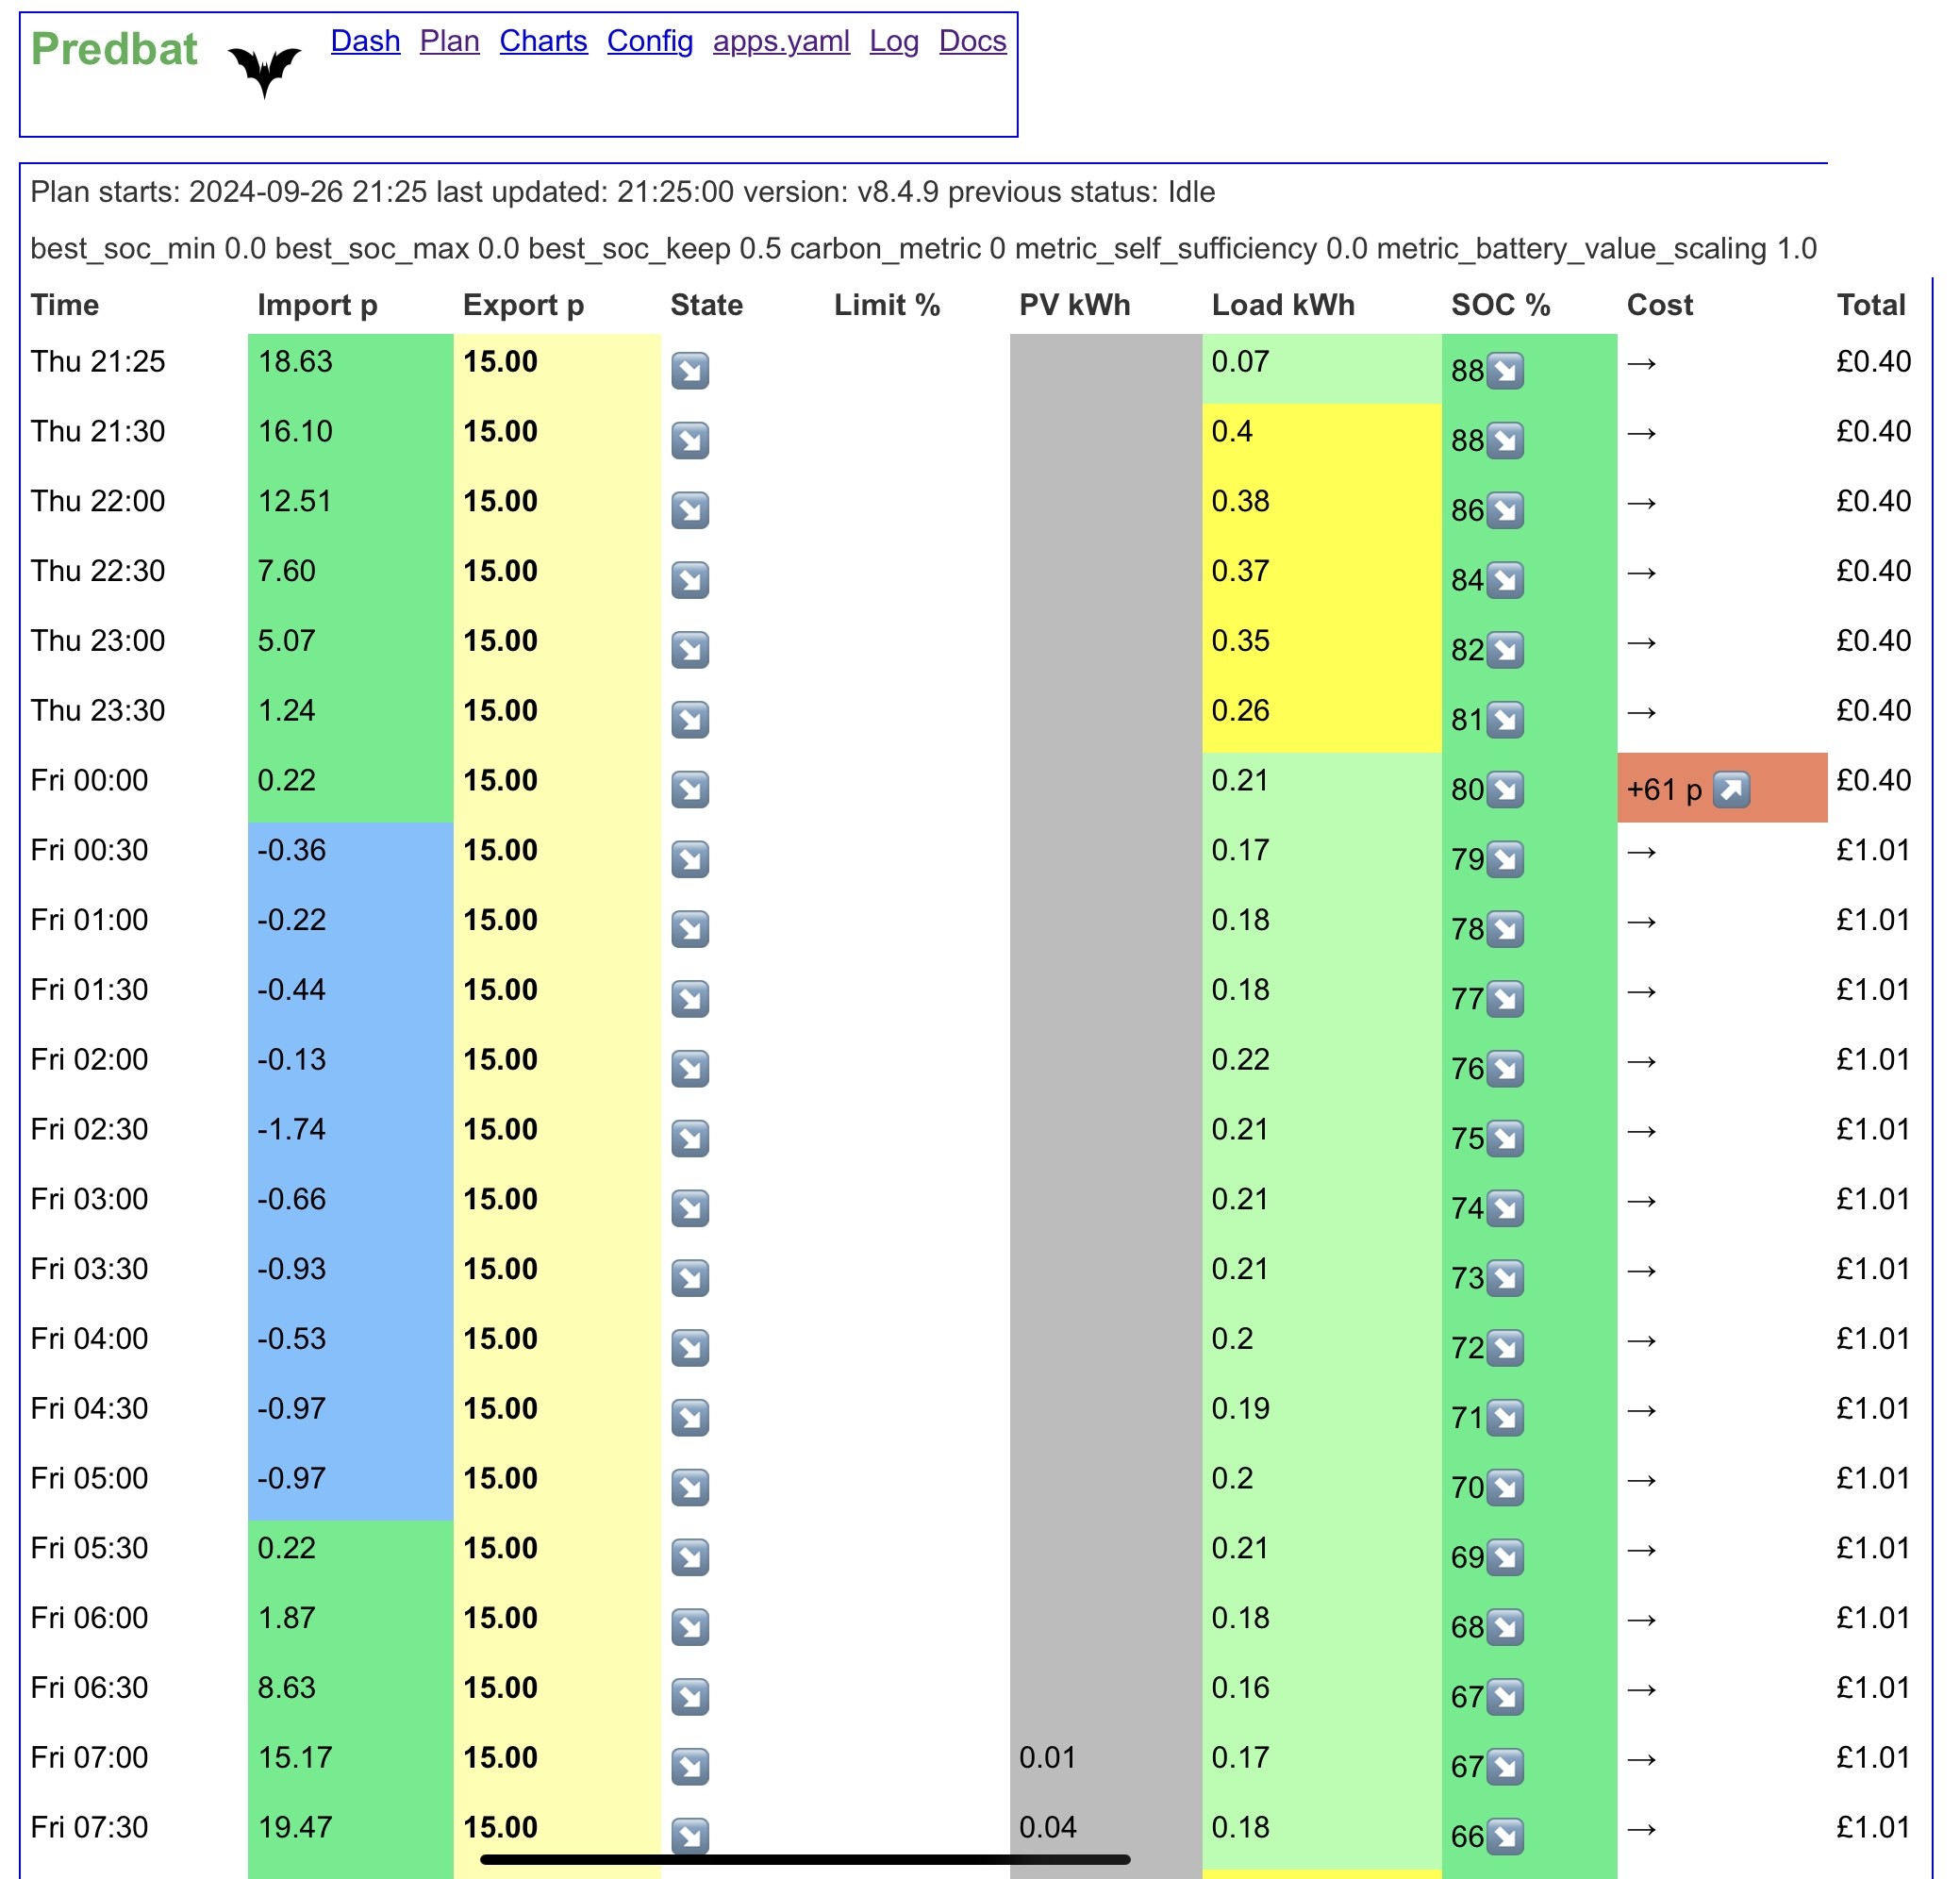
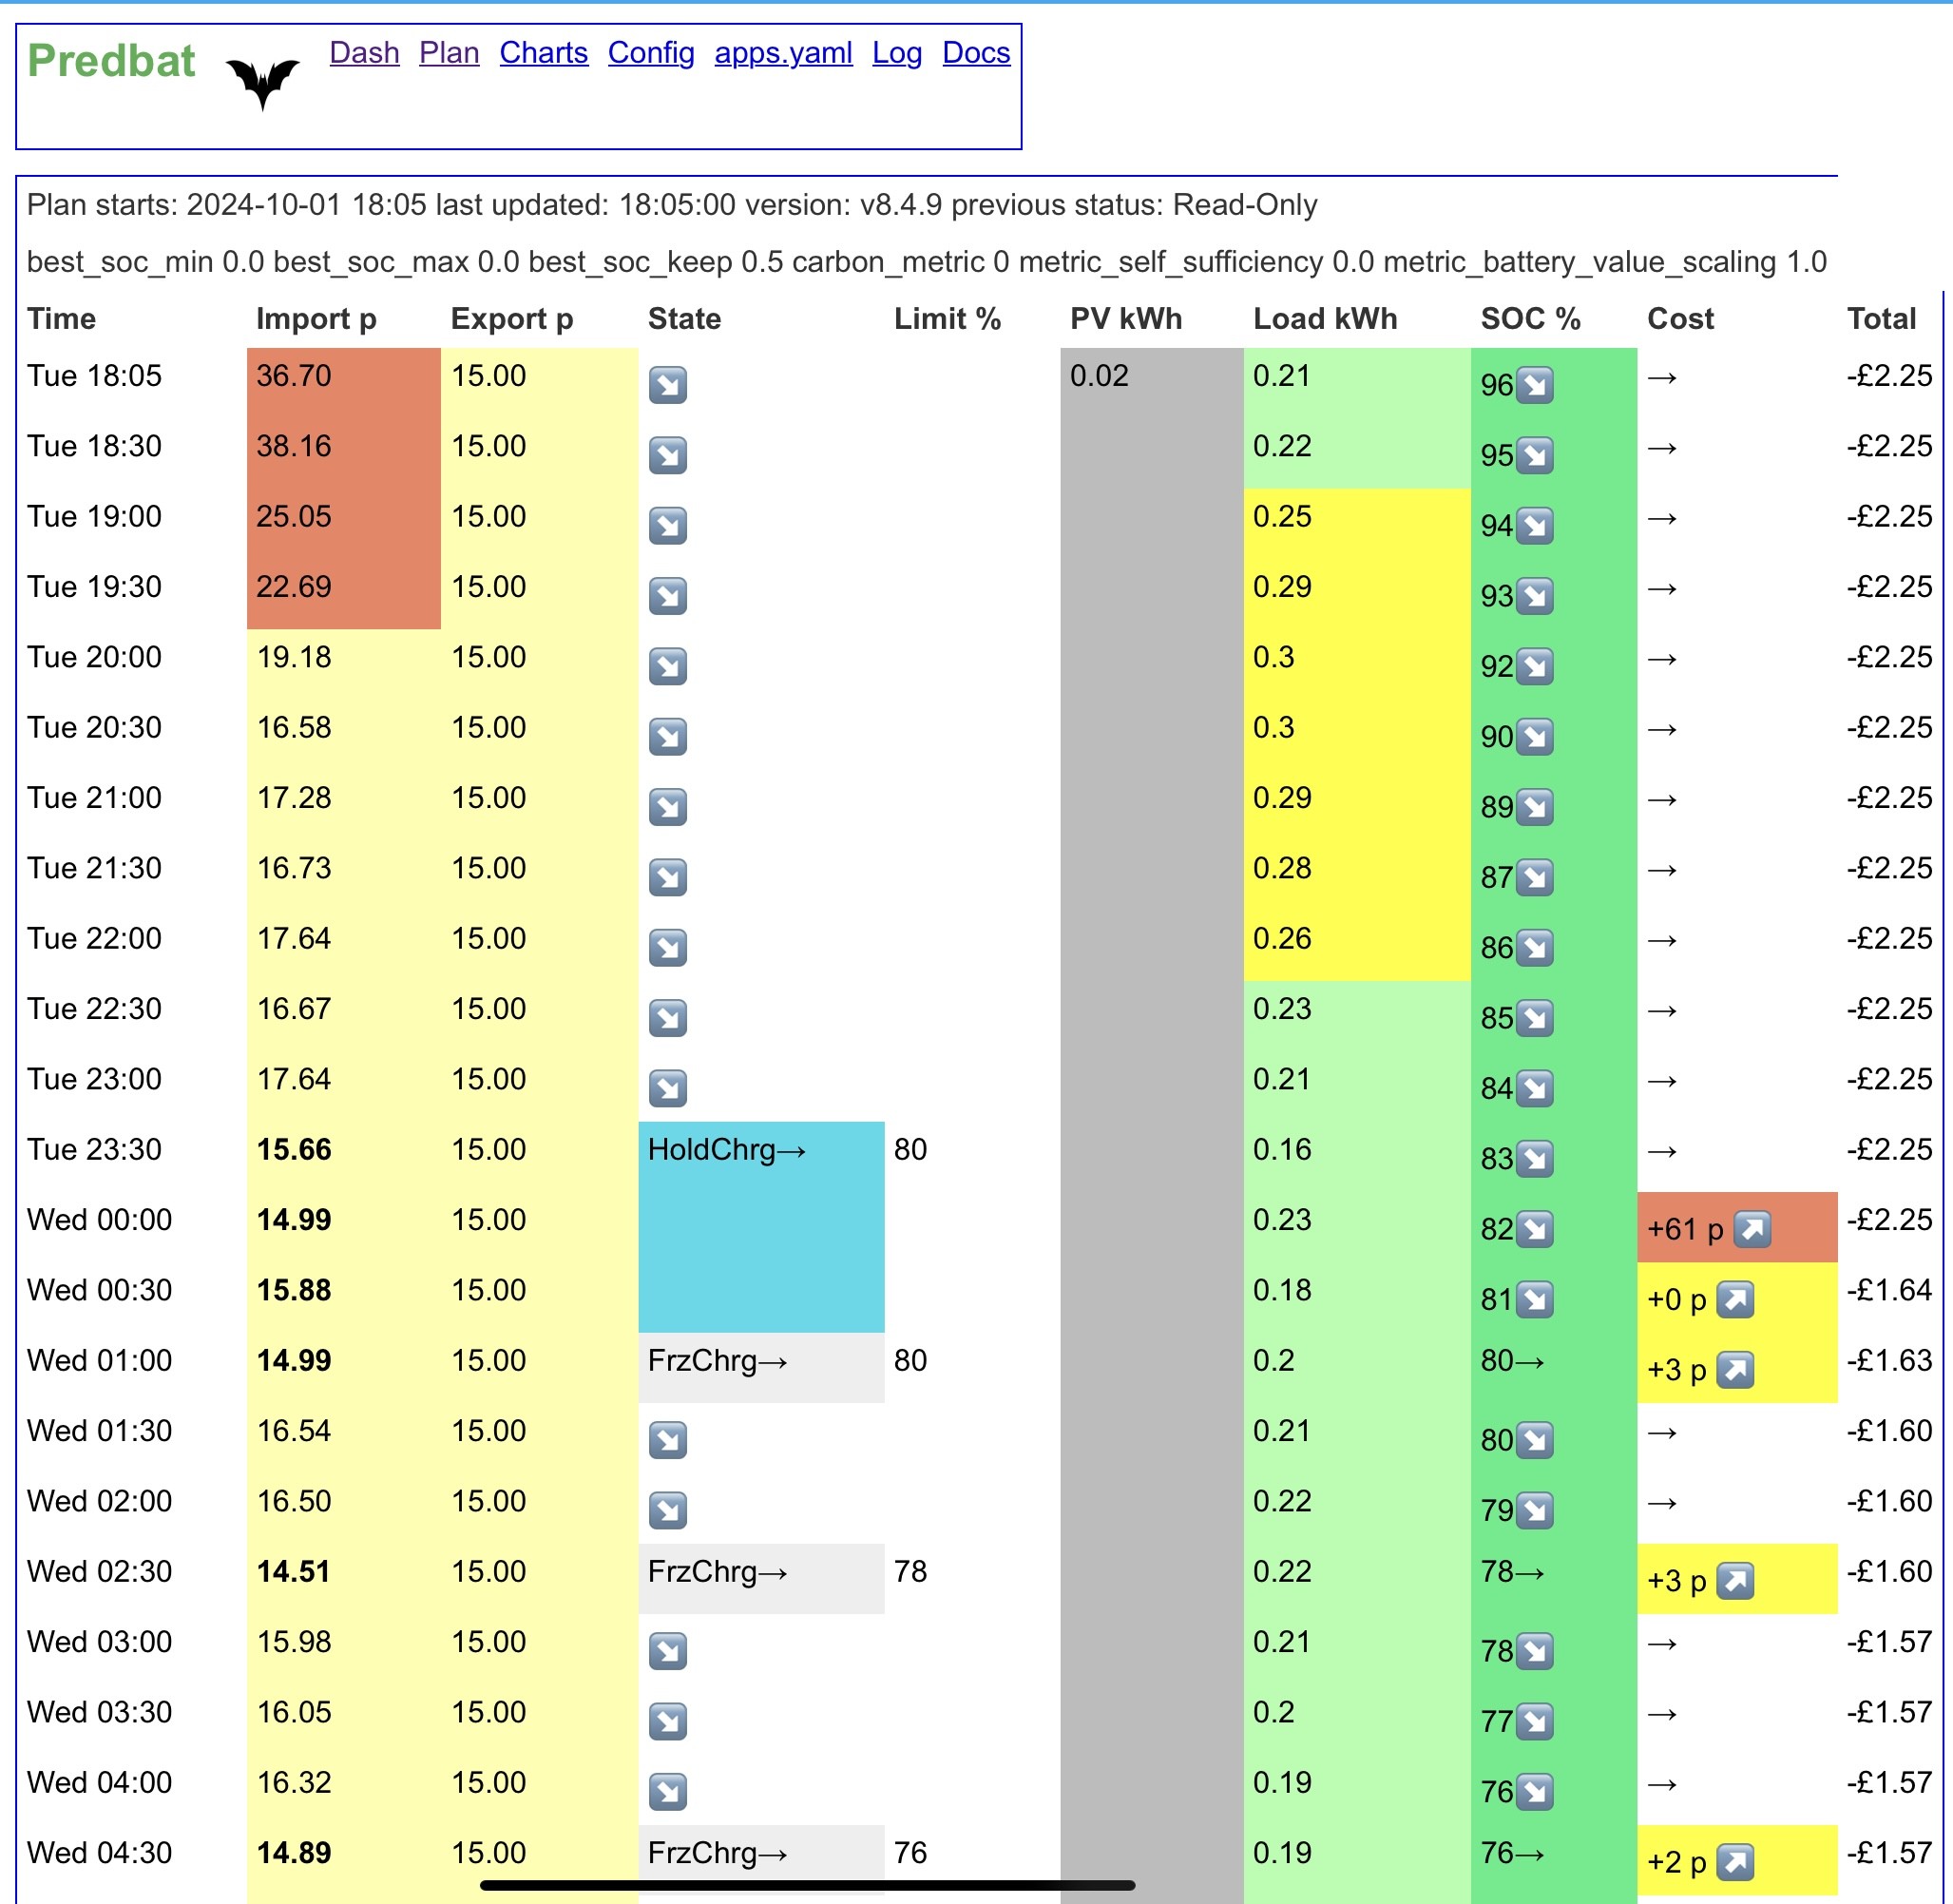
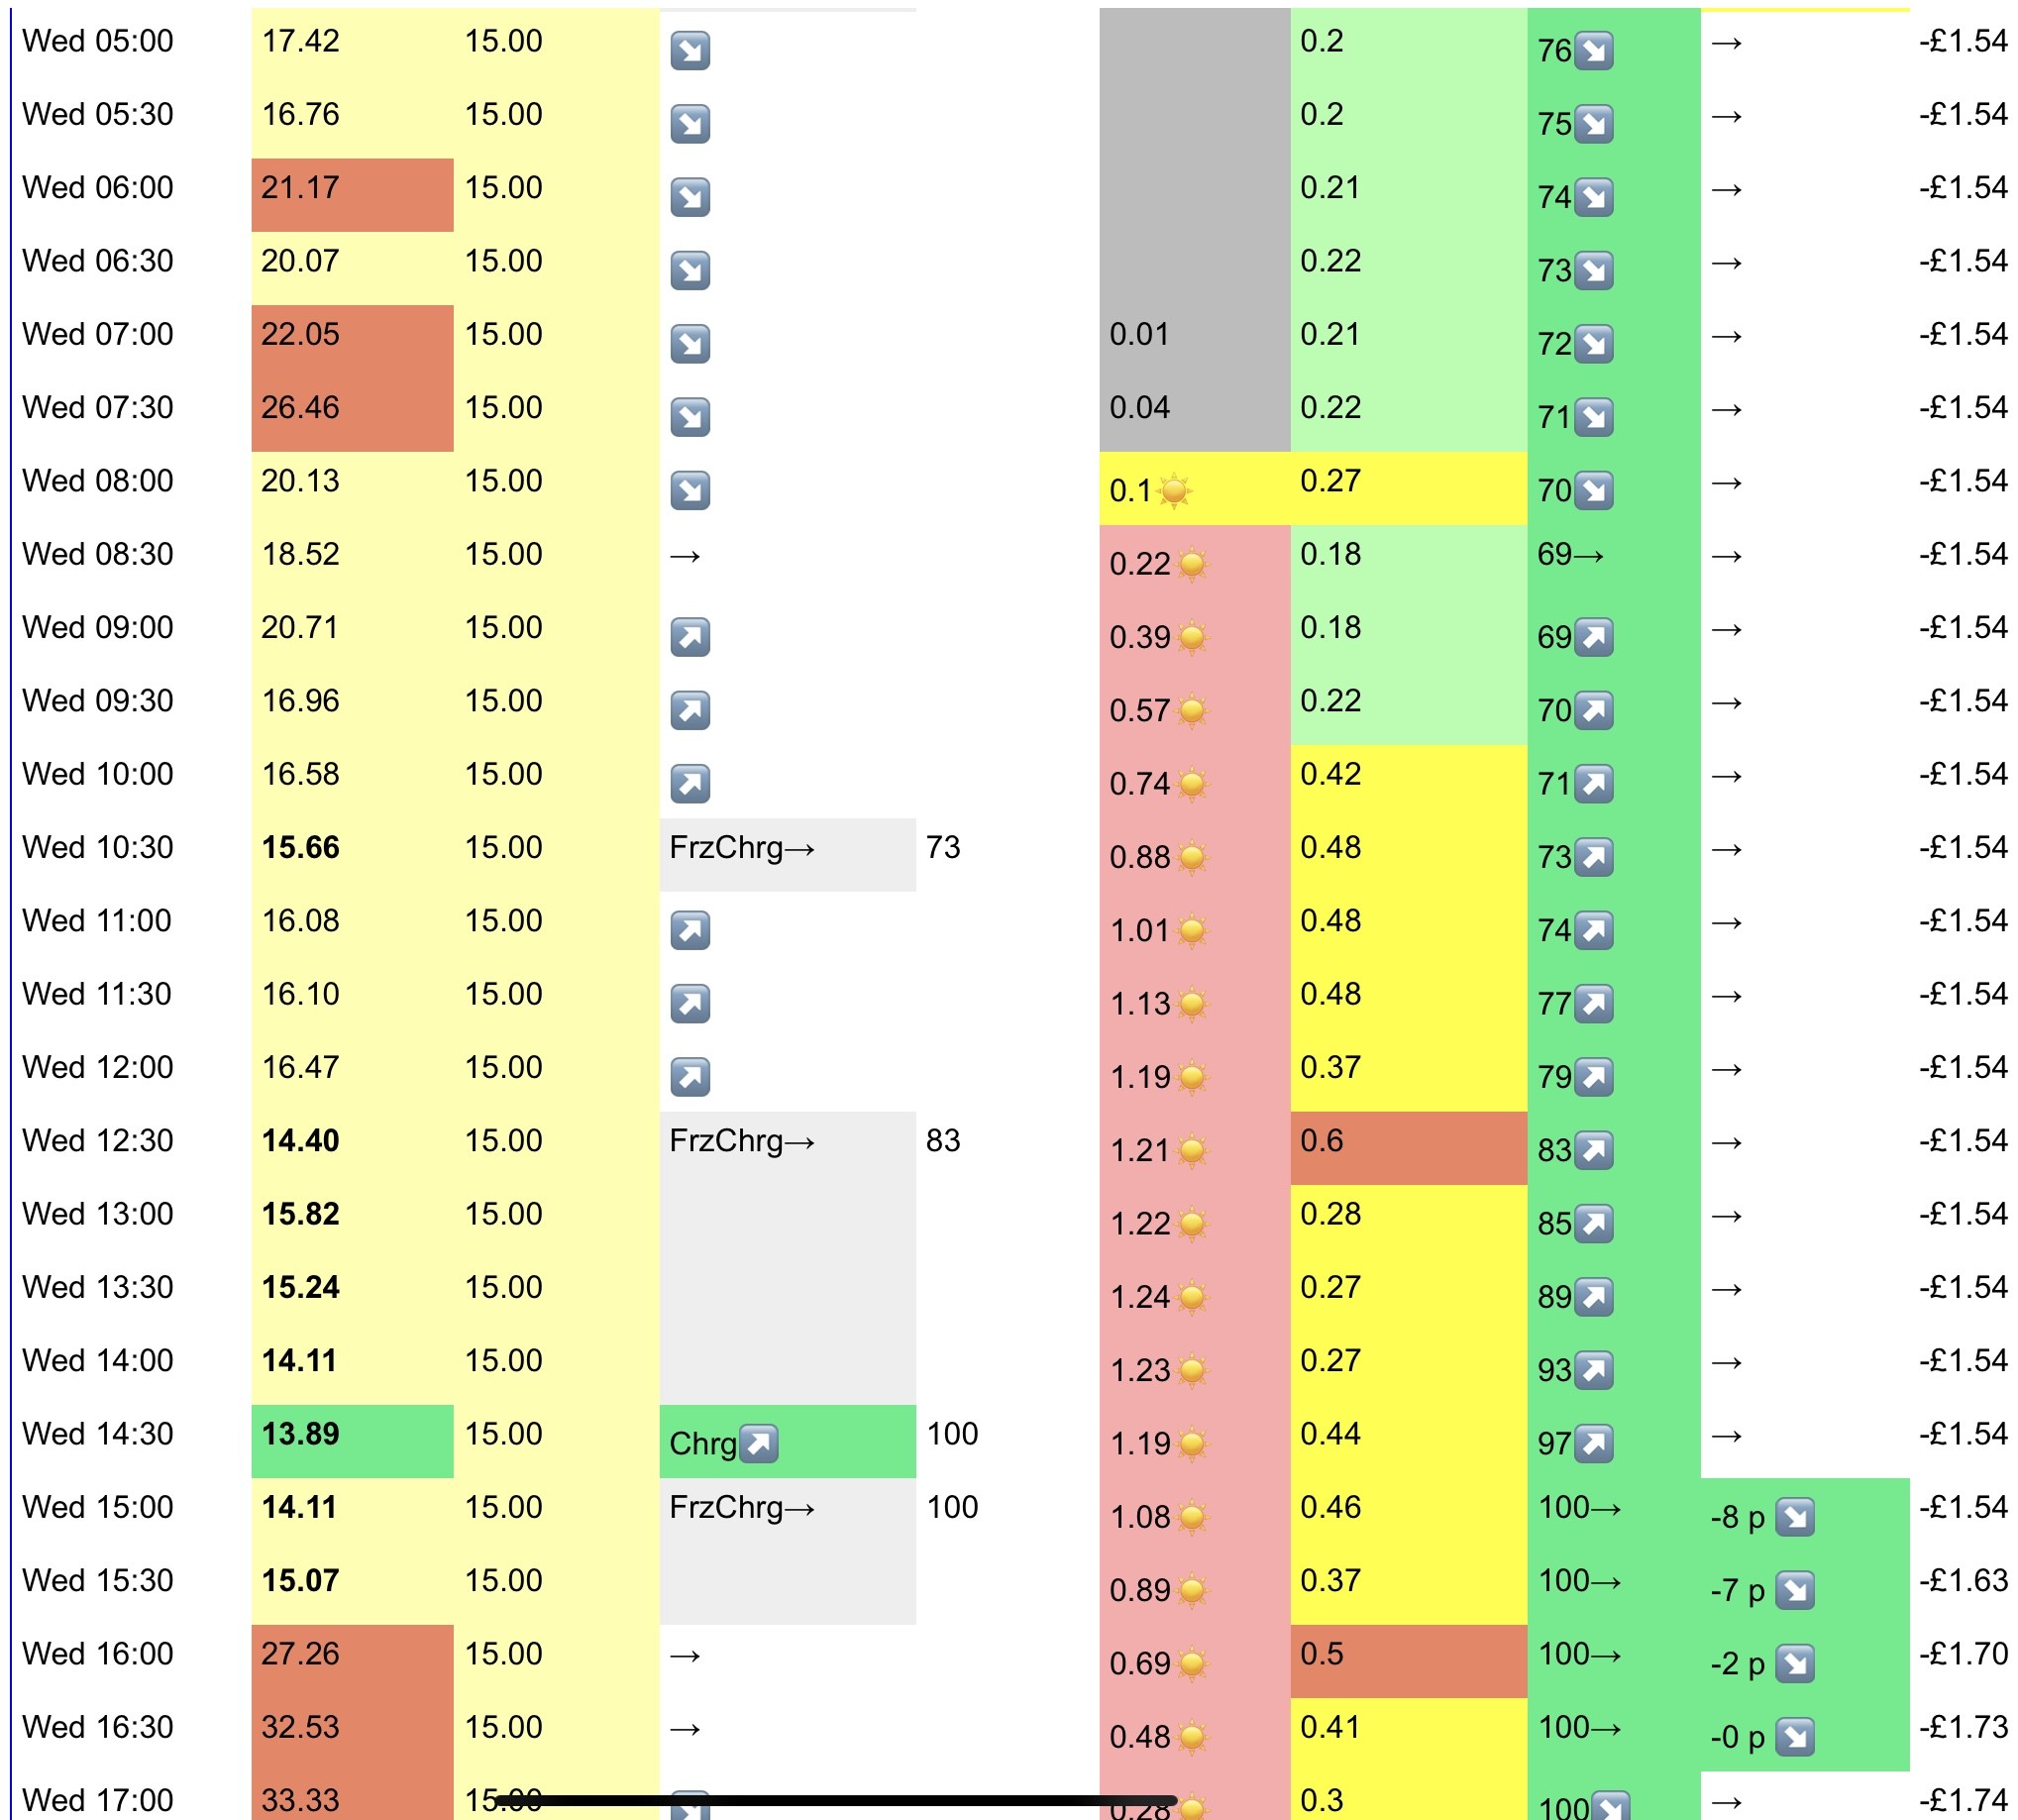
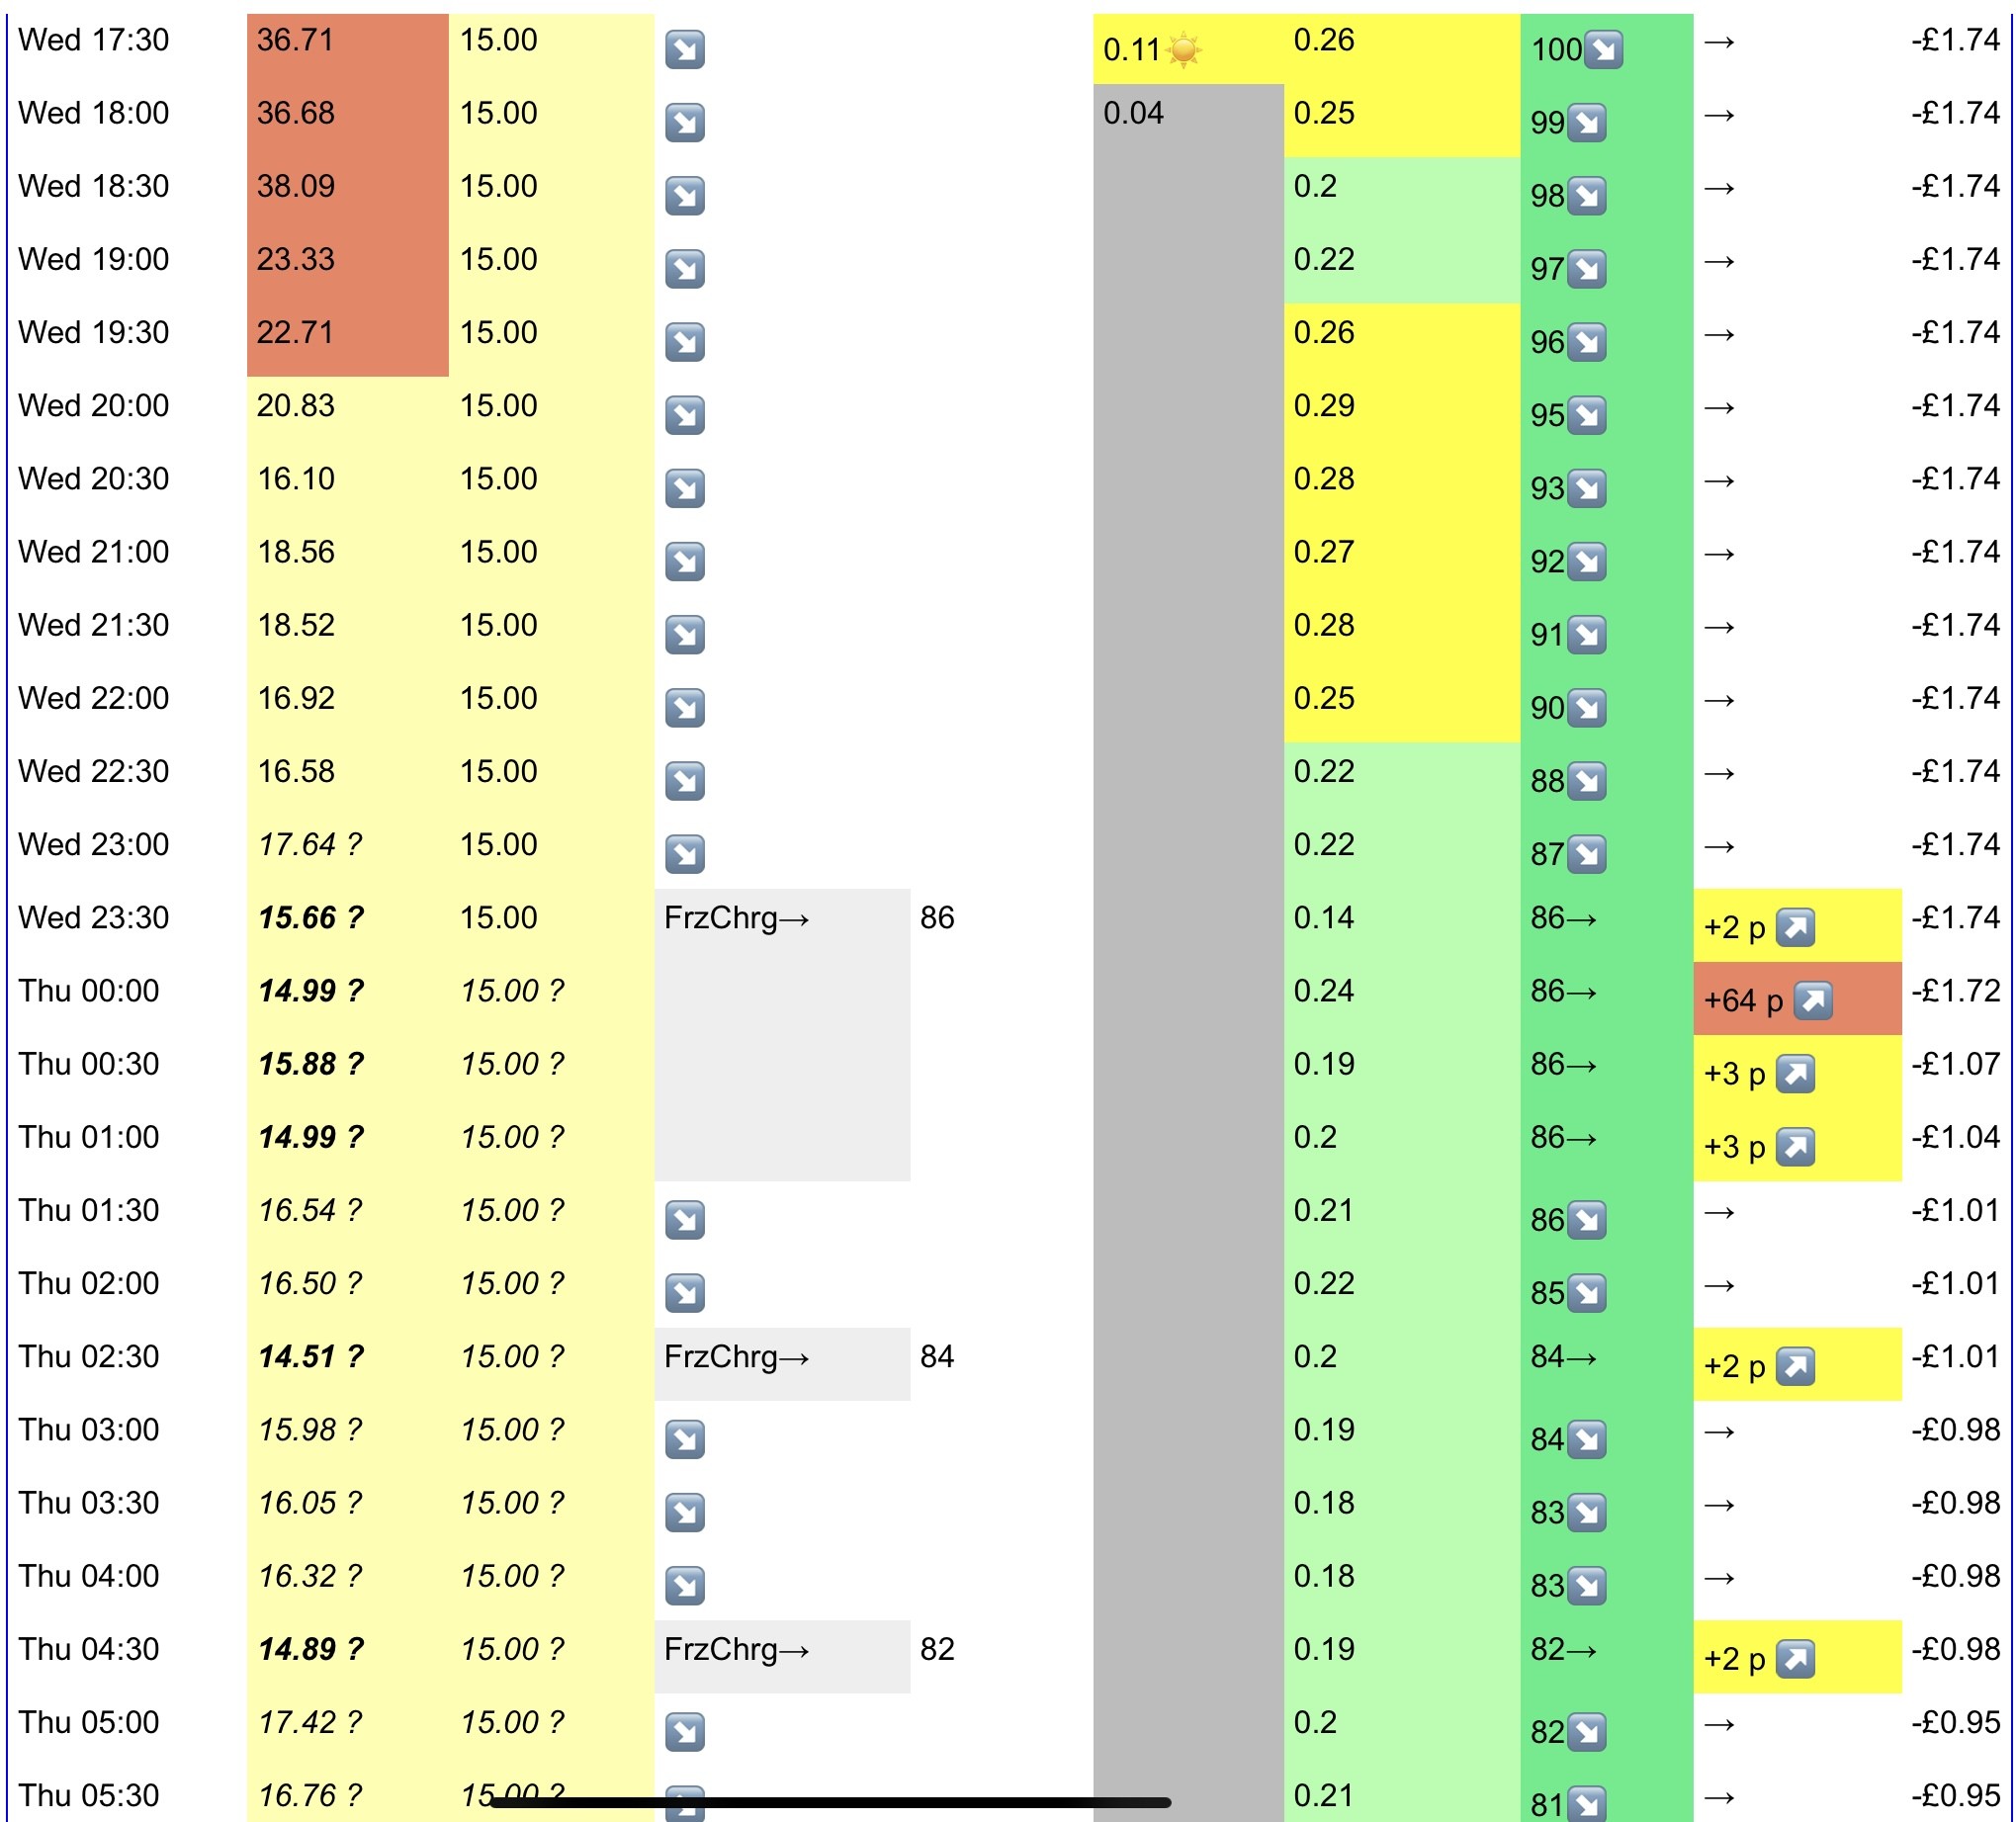
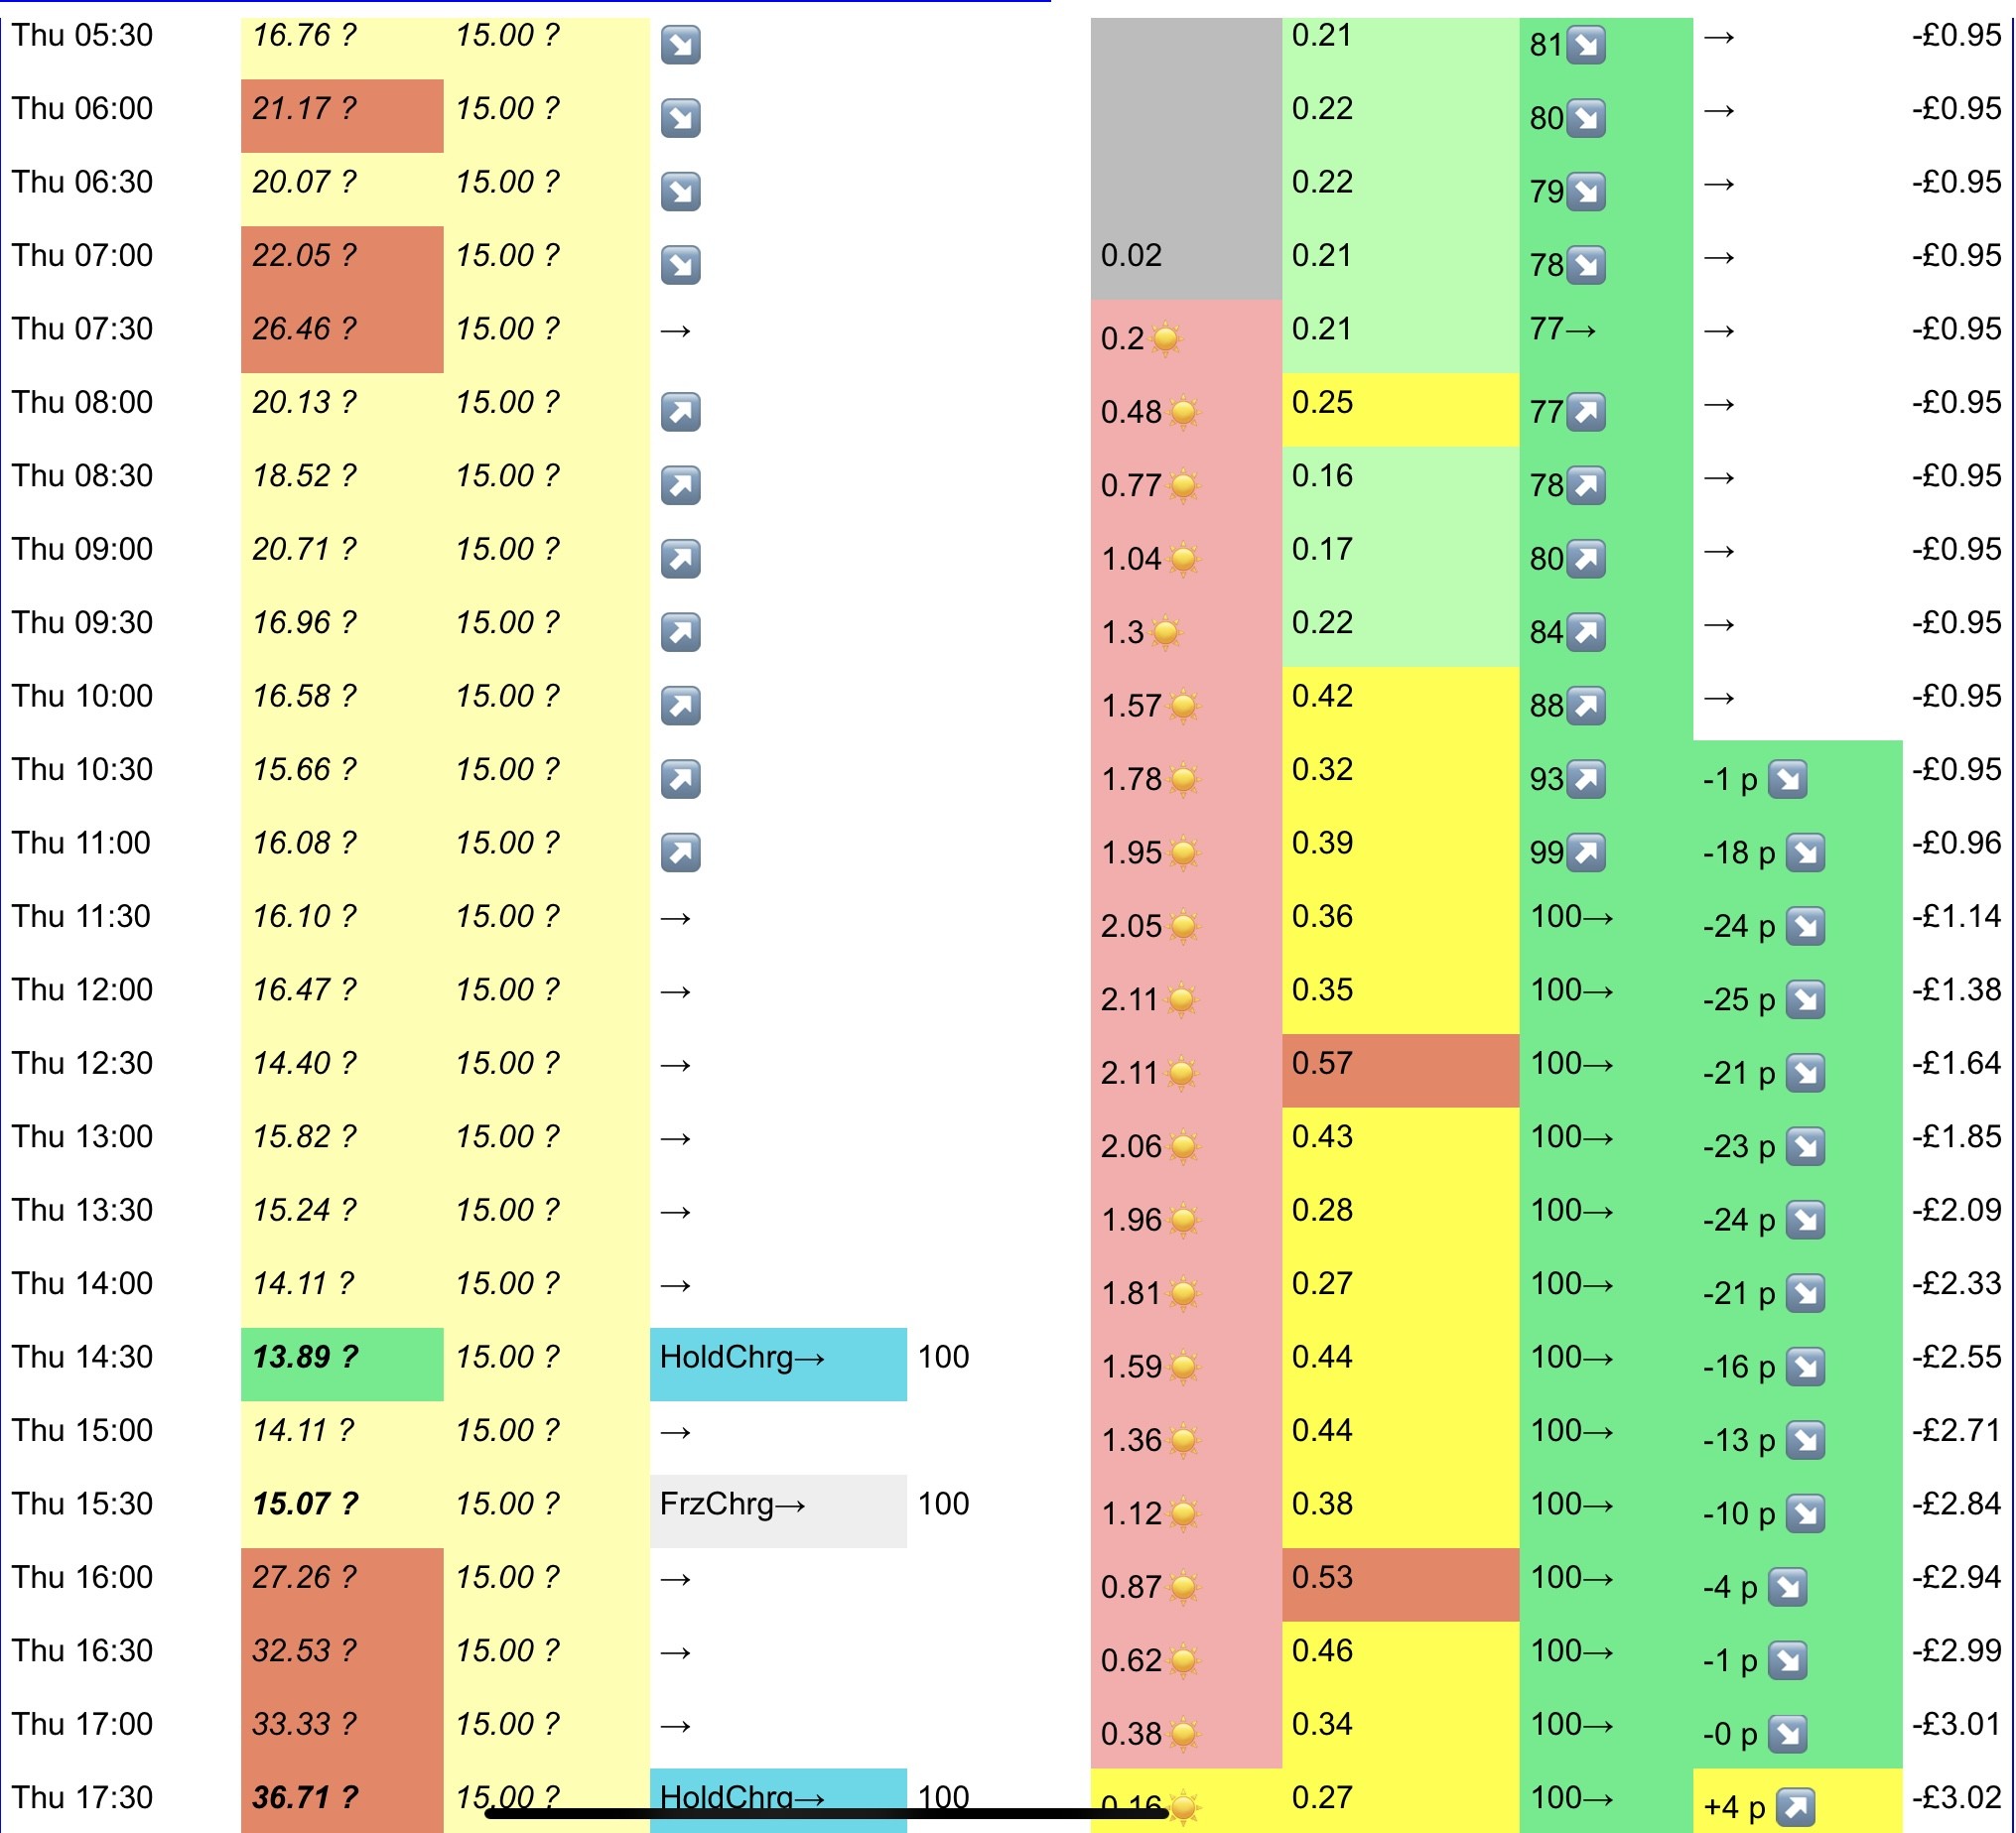
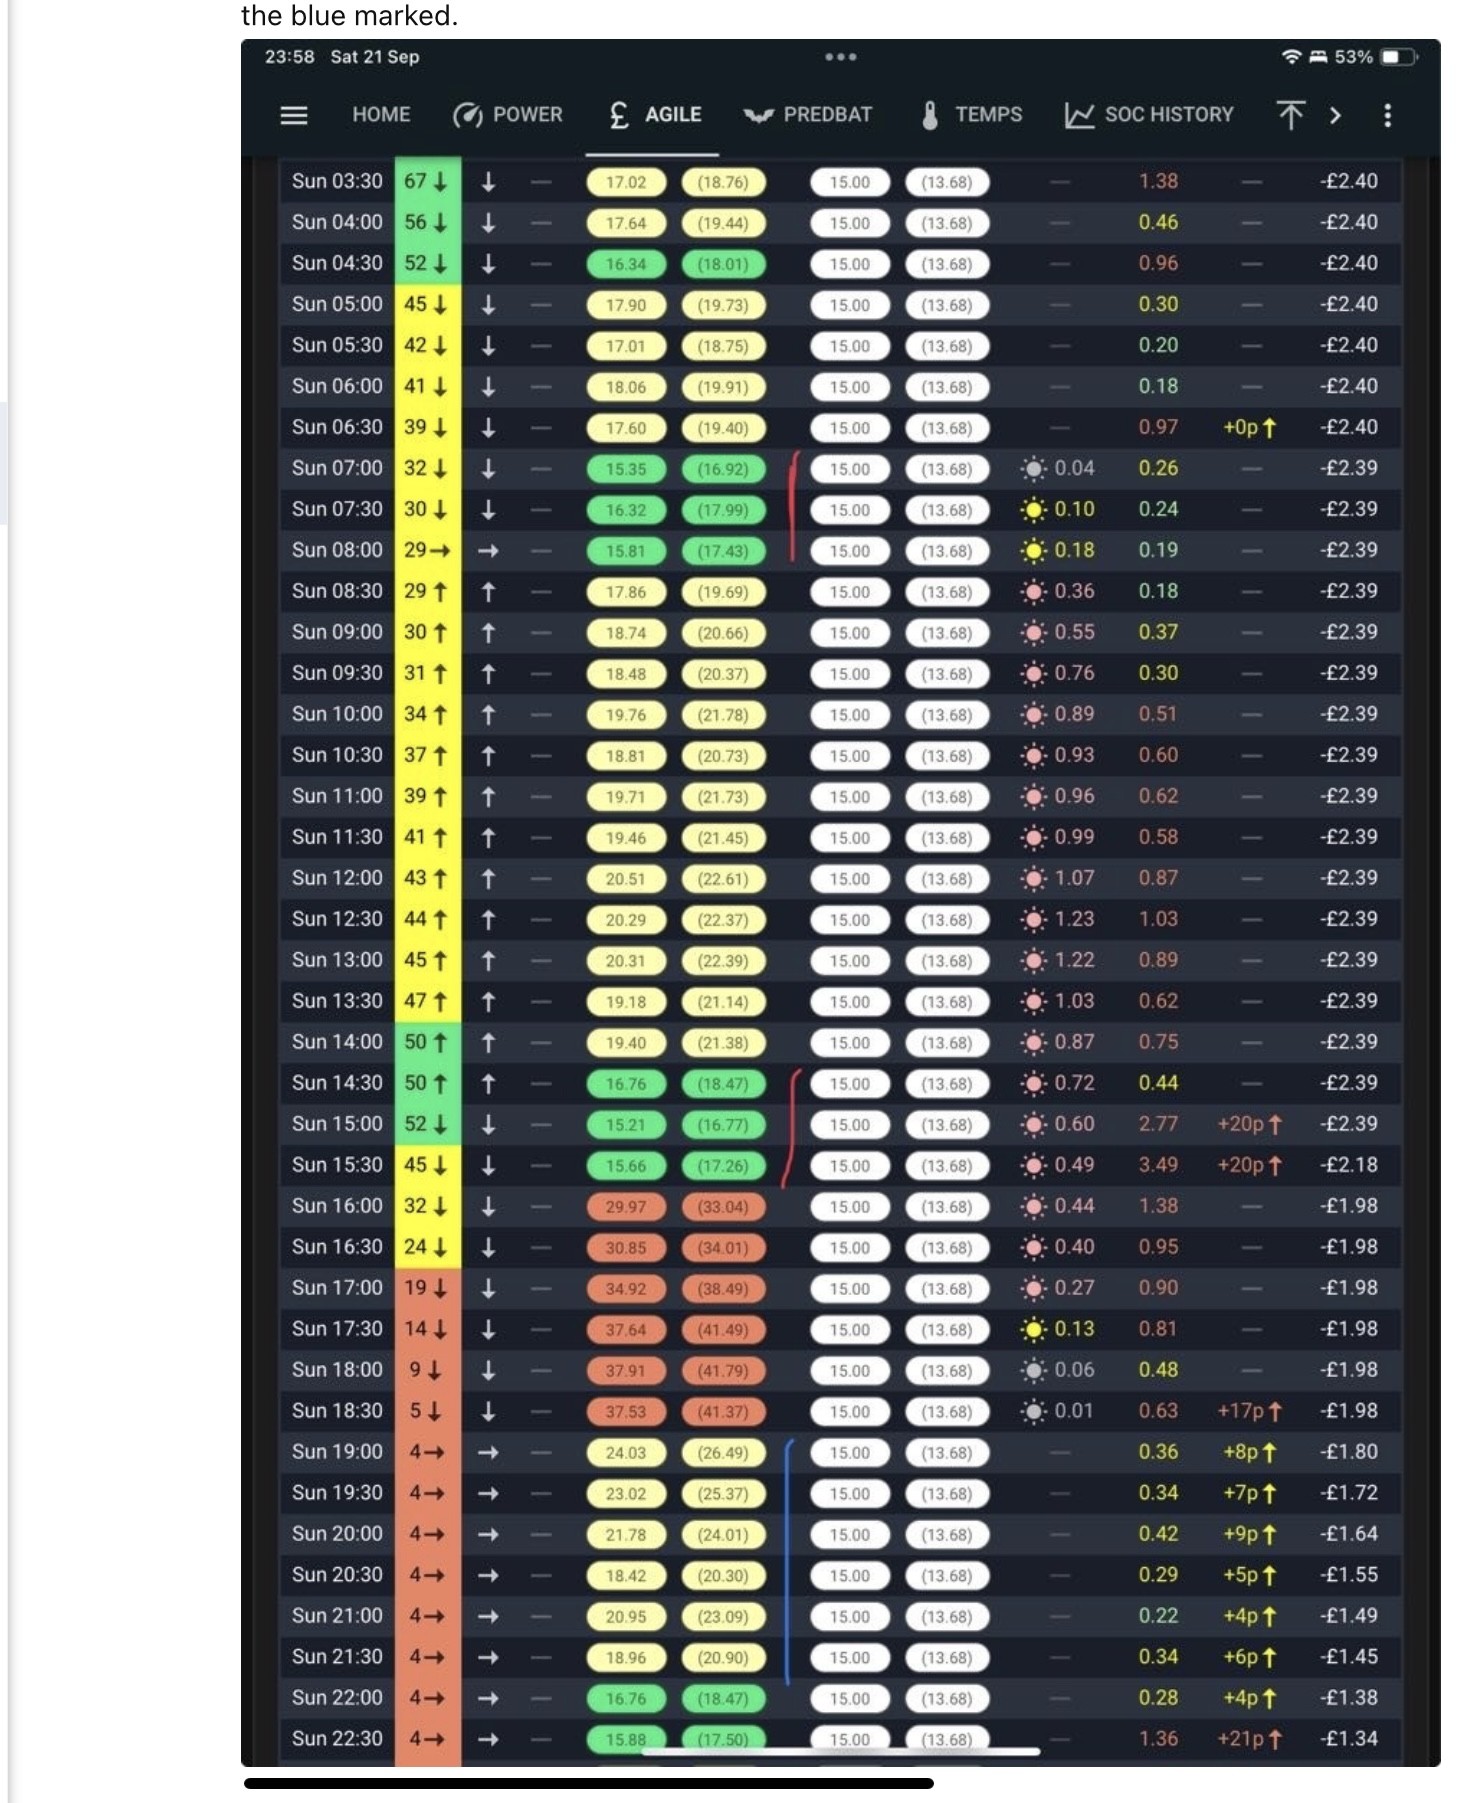
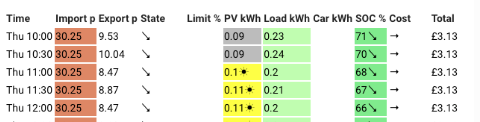
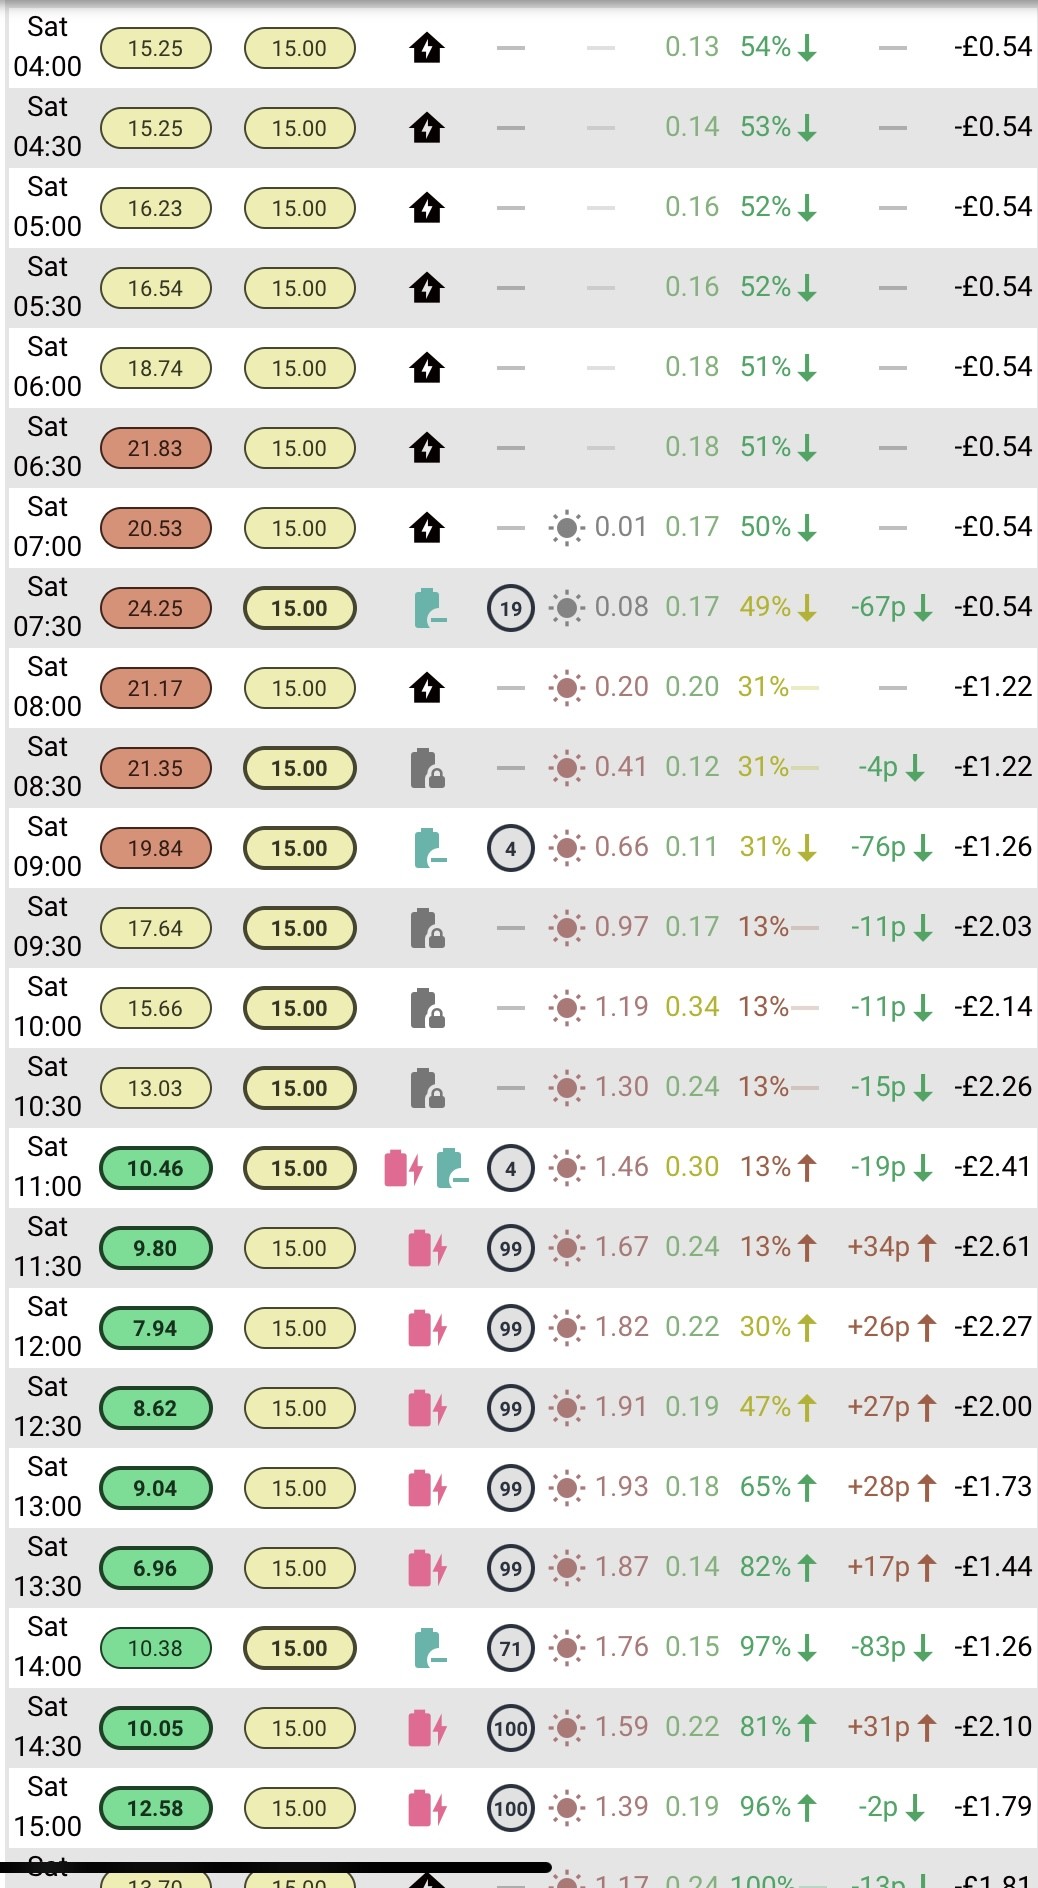
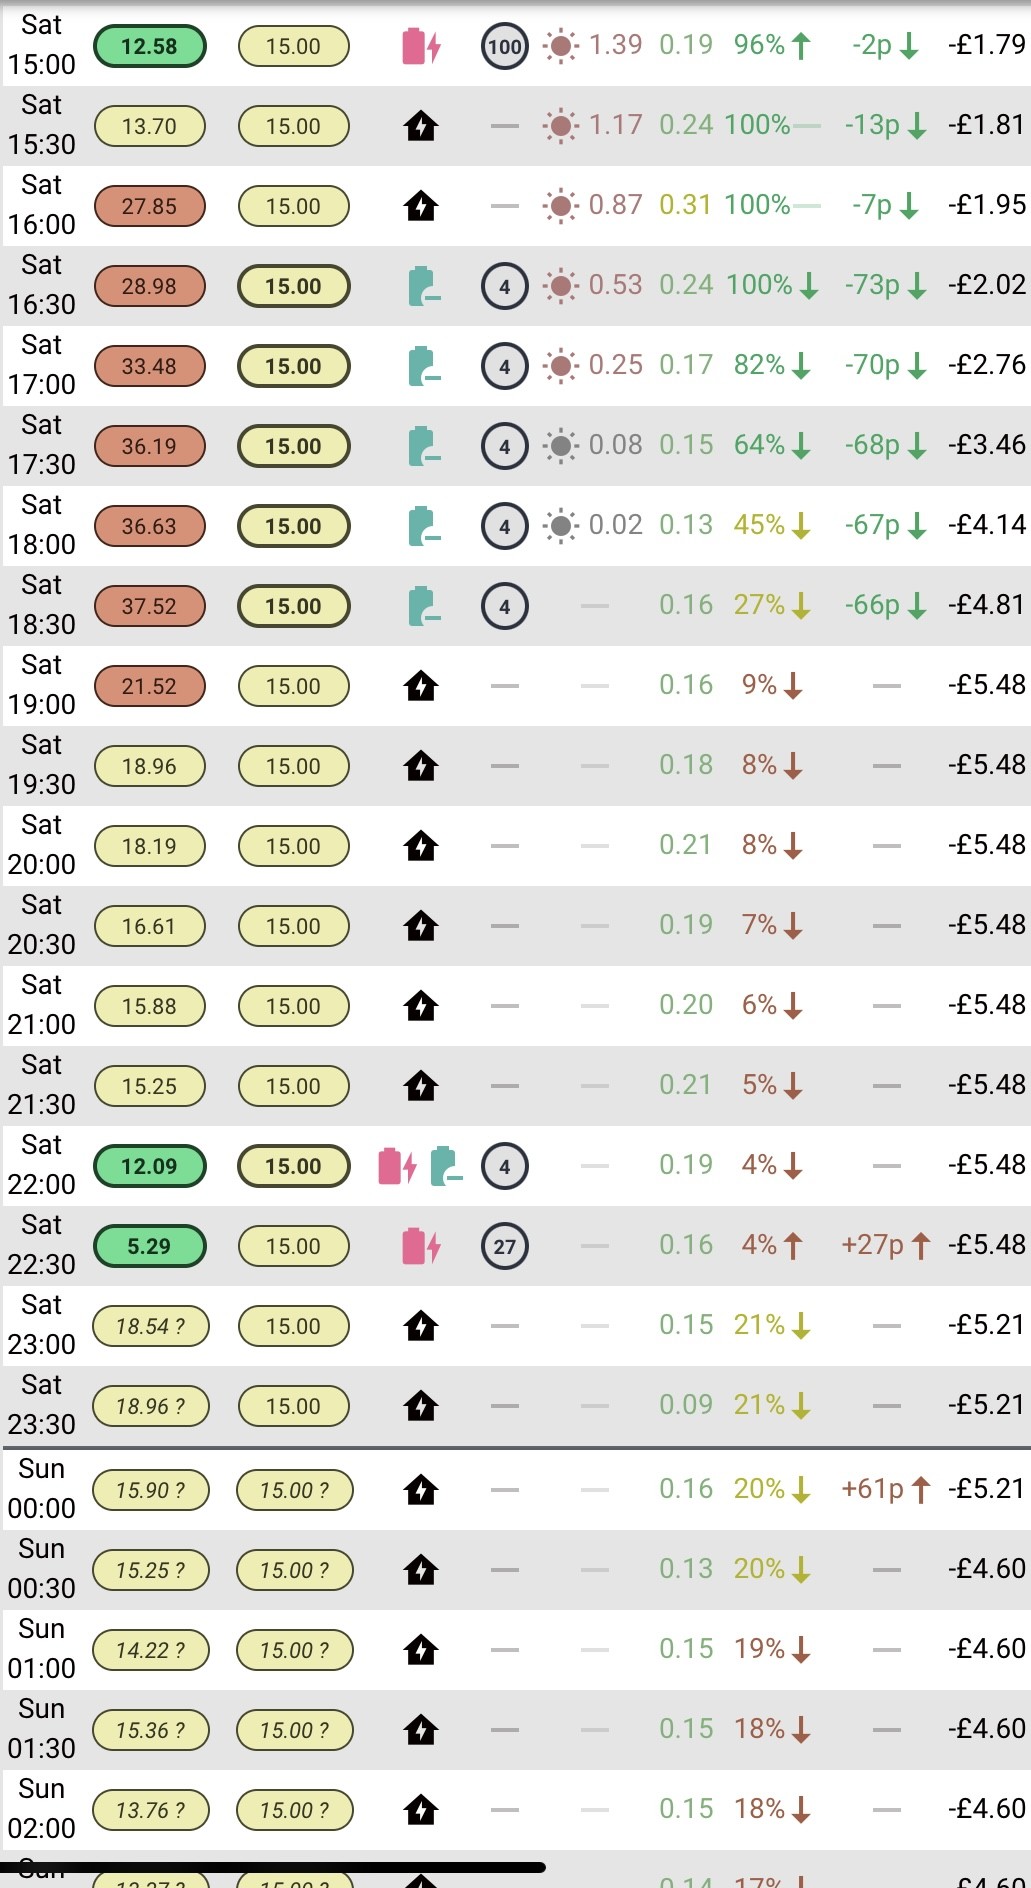
The Predbat plan you copied above is produced using the brilliant Predbat table card that reformats the standard Predbat HTML output and enables you to configure the order of the columns and which show. Look at the table card doc to see the configuration options https://github.com/pacemaker82/PredBat-Table-Card

On the energy dashboard, yes, use the gateway meters as you are doing for import, export, PV (or solaredge sensor).
For the battery charge and discharge I would suggest putting the individual AIO charge and discharge sensors rather than the gateway so you can see how each AIO is performing, but personal choice either way and you can always change it in the future.
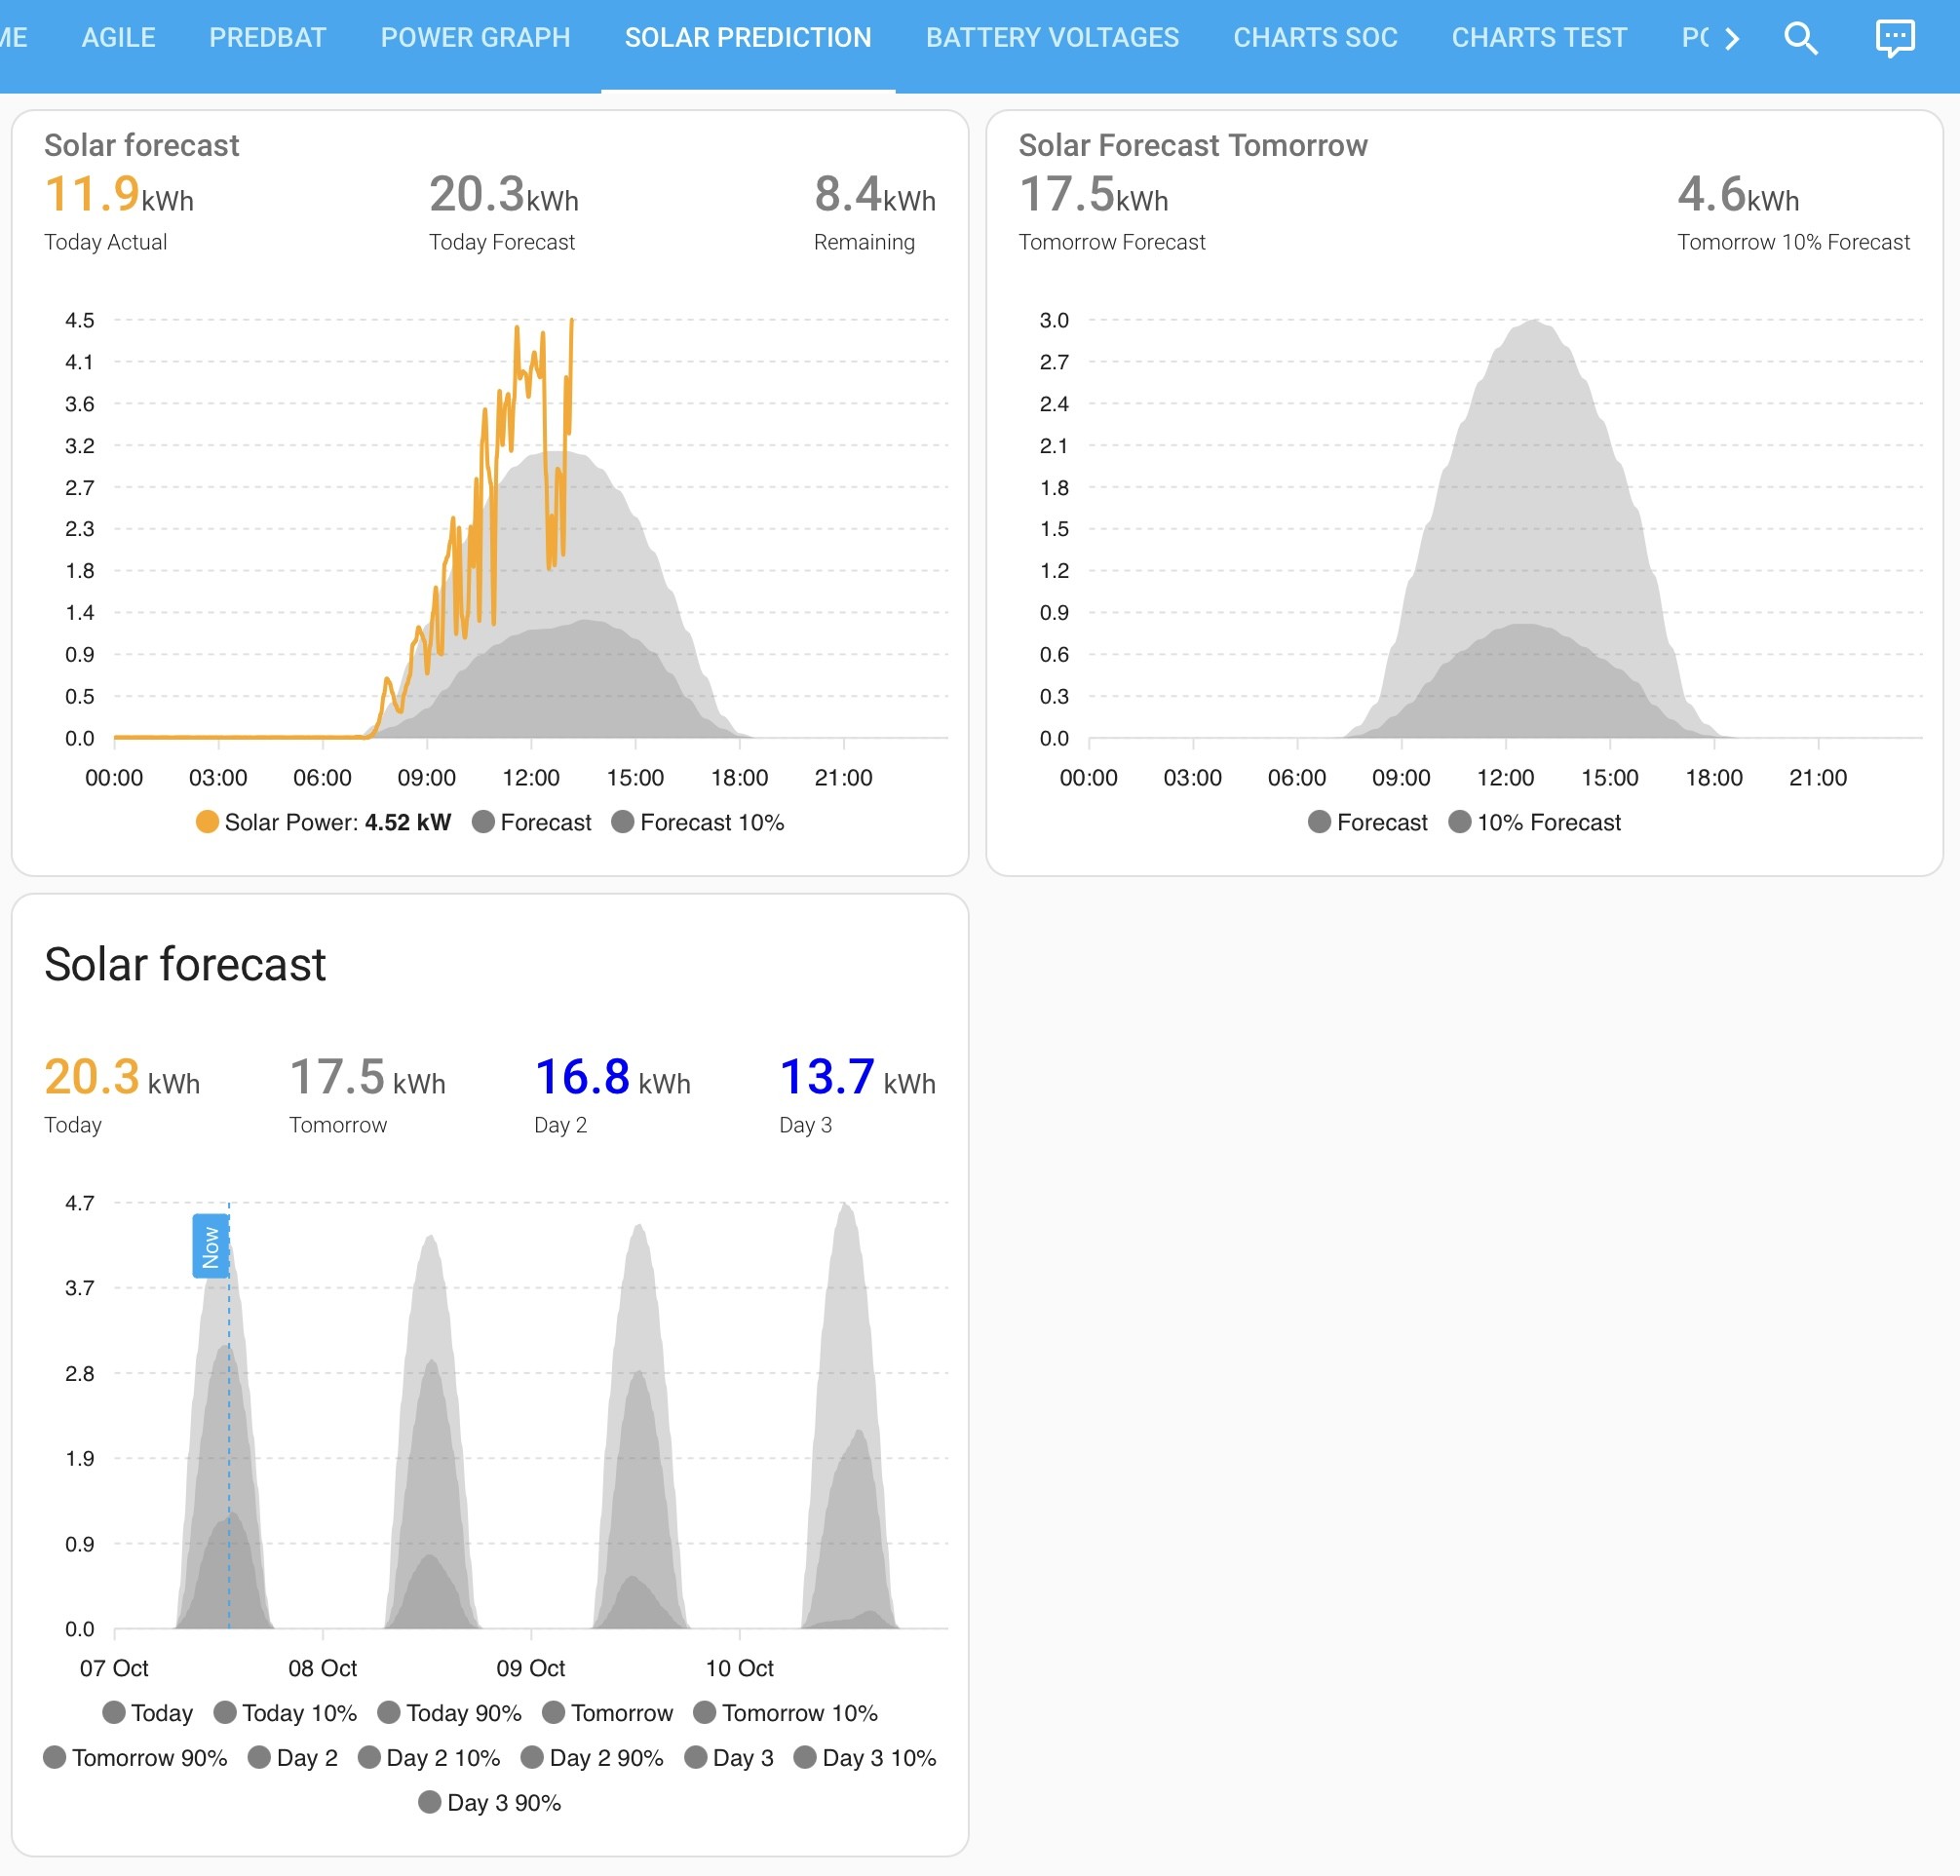
As you have installed the Solcast integration you can also show the solar prediction line on the solar graph.

Only other thing to add for the basic dashboard is the energy rate charged. This is covered in the Octopus energy integration (with again, quite a bit of contributions by me 😉) https://bottlecapdave.github.io/HomeAssistant-OctopusEnergy/setup/energy_dashboard/

D
#36 Daveb01

Rbor

This was what I was thinking for PV as well, I can go into the SolarEdge app and see what I want to and would still do that in the future, so I could remove the SolarEdge integration in the future to save cpu and disc.

I have use the GW meter sources where possible and the meter for Gas. However `I have not been able to identify the Octopus Mini specific ones yet.

Thank you for this so far. Would you be willing to send me a screen shot of your dashboard layout so I can compare yours, Geoffrey’s and my planed ones please?

D
#37 Daveb01

geoffreycoan

Thank you for all the advice again, I will keep SolarEdge integration in at the moment and see what it offers as you suggest. I look forward to seeing your dashboards. I will also look at others but as you have the most experience you have done a lot of work and thought about what you want to see and I can take advantage of this and go from there if your happy to share.

G
#38 geoffreycoan

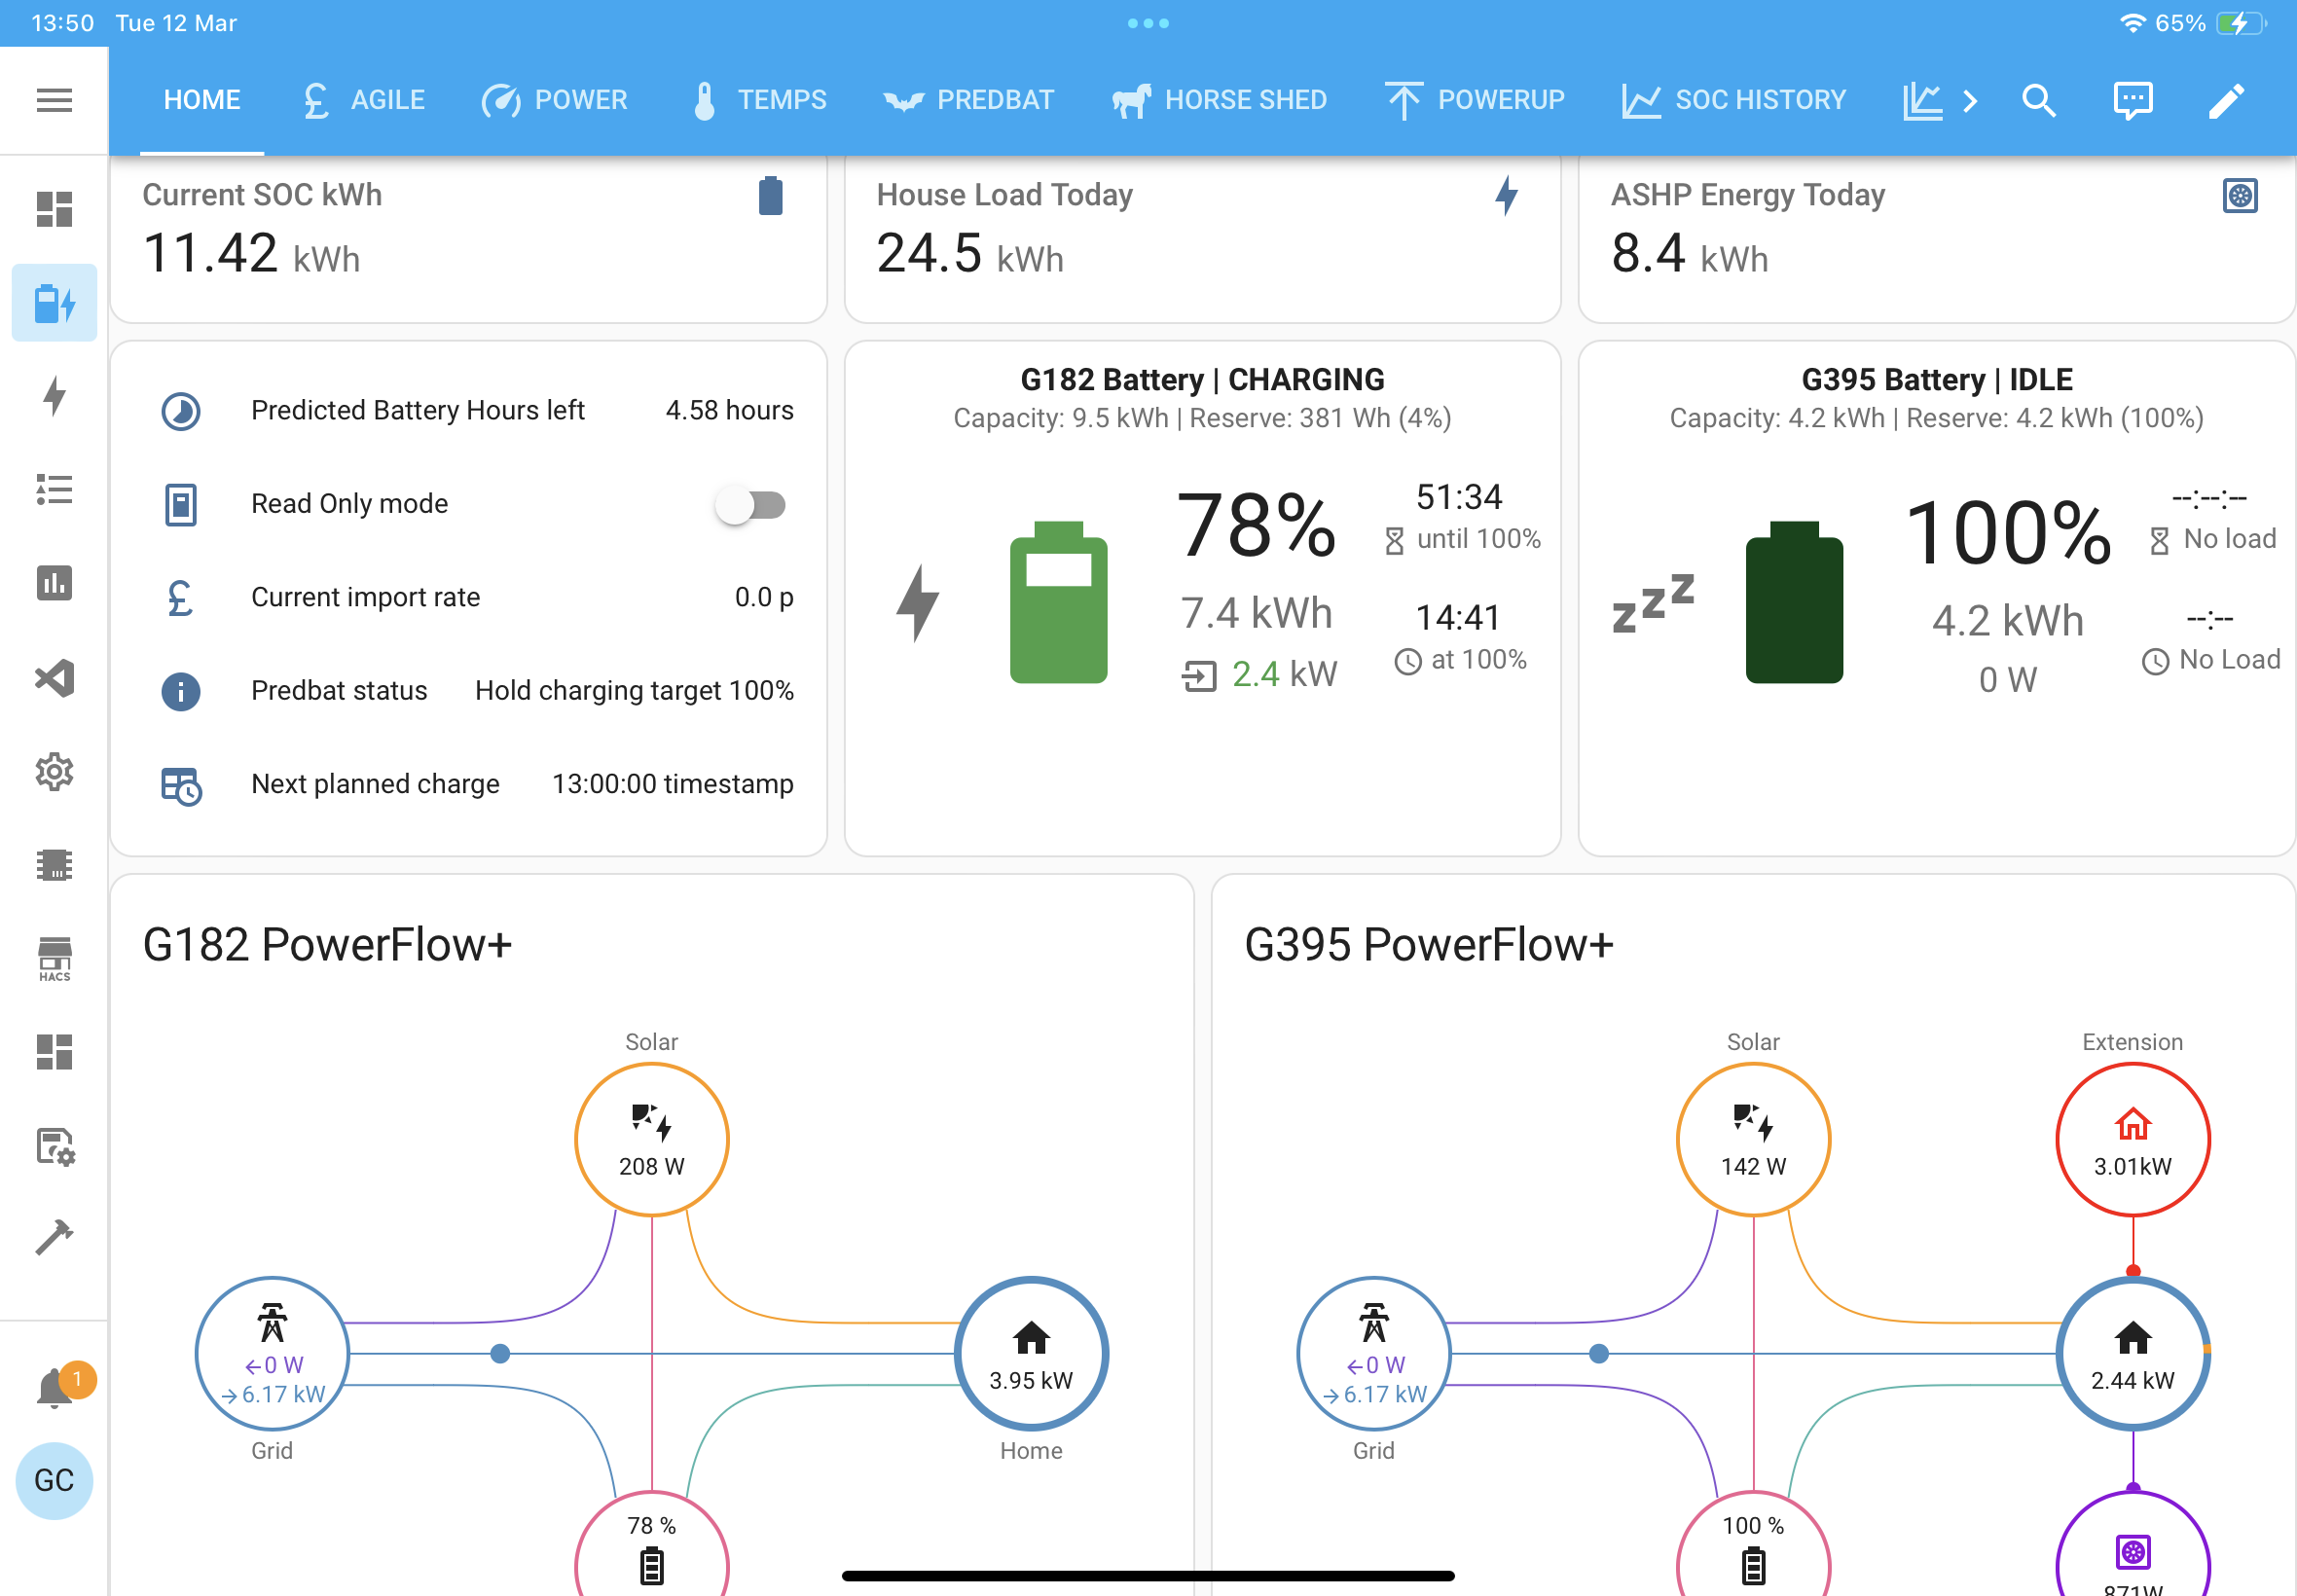
FWIW my GivEnergy dashboard in its raw format. You'll have to change my g_ and h_ sensors which are for my two Gen 1 hybrid inverters, and of course it has my inverter serial numbers in places as well. I have blanked out my electricity meter number but that's all

Suggest you just copy paste this into a blank dashboard and see what you want to copy to your own

keep_texts_in_tabs:
  enabled: true
views:
  - title: Home
    type: panel
    icon: ''
    badges: []
    cards:
      - type: vertical-stack
        cards:
          - type: horizontal-stack
            cards:
              - type: entity
                entity: predbat.soc_kw_h0
              - type: entity
                entity: sensor.calc_house_load_today
              - type: entity
                entity: sensor.ashp_energy_today
          - type: conditional
            conditions:
              - condition: screen
                media_query: '(min-width: 0px) and (max-width: 1023px)'
            card:
              type: vertical-stack
              cards:
                - type: horizontal-stack
                  cards:
                    - type: entities
                      entities:
                        - entity: predbat.battery_hours_left
                        - entity: switch.predbat_set_read_only
                        - entity: predbat.rates
                          name: Current import rate
                          icon: mdi:currency-gbp
                    - type: entities
                      entities:
                        - entity: predbat.status
                          name: Predbat status
                        - entity: predbat.best_charge_start
                          name: Next planned charge
                        - entity: predbat.cost_today
                          icon: mdi:currency-gbp
                - type: horizontal-stack
                  cards:
                    - type: custom:givtcp-battery-card
                      name: G182 Battery
                      soc_threshold_very_high: 80
                      soc_threshold_high: 60
                      soc_threshold_medium: 40
                      soc_threshold_low: 20
                      soc_threshold_very_high_colour:
                        - 0
                        - 69
                        - 23
                      soc_threshold_high_colour:
                        - 67
                        - 160
                        - 71
                      soc_threshold_medium_colour:
                        - 255
                        - 166
                        - 0
                      soc_threshold_low_colour:
                        - 219
                        - 68
                        - 55
                      soc_threshold_very_low_colour:
                        - 94
                        - 0
                        - 0
                      display_abs_power: true
                      display_type: 2
                      display_dp: 1
                      icon_status_idle: mdi:sleep
                      icon_status_charging: mdi:lightning-bolt
                      icon_status_discharging: mdi:home-battery
                      display_battery_rates: false
                      use_custom_dod: false
                      custom_dod: 100
                      calculate_reserve_from_dod: false
                      display_custom_dod_stats: false
                      display_energy_today: false
                      entity: sensor.g_sd2237g182_invertor_serial_number
                    - type: custom:givtcp-battery-card
                      name: G395 Battery
                      soc_threshold_very_high: 80
                      soc_threshold_high: 60
                      soc_threshold_medium: 40
                      soc_threshold_low: 20
                      soc_threshold_very_high_colour:
                        - 0
                        - 69
                        - 23
                      soc_threshold_high_colour:
                        - 67
                        - 160
                        - 71
                      soc_threshold_medium_colour:
                        - 255
                        - 166
                        - 0
                      soc_threshold_low_colour:
                        - 219
                        - 68
                        - 55
                      soc_threshold_very_low_colour:
                        - 94
                        - 0
                        - 0
                      display_abs_power: true
                      display_type: 2
                      display_dp: 1
                      icon_status_idle: mdi:sleep
                      icon_status_charging: mdi:lightning-bolt
                      icon_status_discharging: mdi:home-battery
                      display_battery_rates: false
                      use_custom_dod: true
                      custom_dod: 80
                      calculate_reserve_from_dod: true
                      display_custom_dod_stats: false
                      display_energy_today: false
                      entity: sensor.h_sd2237g395_invertor_serial_number
          - type: conditional
            conditions:
              - condition: screen
                media_query: '(min-width: 1024px)'
            card:
              type: horizontal-stack
              cards:
                - type: entities
                  entities:
                    - entity: predbat.battery_hours_left
                    - entity: switch.predbat_set_read_only
                    - entity: predbat.rates
                      name: Current import rate
                      icon: mdi:currency-gbp
                    - entity: predbat.status
                      name: Predbat status
                    - entity: predbat.best_charge_start
                      name: Next planned charge
                - type: custom:givtcp-battery-card
                  name: G182 Battery
                  soc_threshold_very_high: 80
                  soc_threshold_high: 60
                  soc_threshold_medium: 40
                  soc_threshold_low: 20
                  soc_threshold_very_high_colour:
                    - 0
                    - 69
                    - 23
                  soc_threshold_high_colour:
                    - 67
                    - 160
                    - 71
                  soc_threshold_medium_colour:
                    - 255
                    - 166
                    - 0
                  soc_threshold_low_colour:
                    - 219
                    - 68
                    - 55
                  soc_threshold_very_low_colour:
                    - 94
                    - 0
                    - 0
                  display_abs_power: true
                  display_type: 2
                  display_dp: 1
                  icon_status_idle: mdi:sleep
                  icon_status_charging: mdi:lightning-bolt
                  icon_status_discharging: mdi:home-battery
                  display_battery_rates: false
                  use_custom_dod: false
                  custom_dod: 100
                  calculate_reserve_from_dod: false
                  display_custom_dod_stats: false
                  display_energy_today: false
                  entity: sensor.g_sd2237g182_invertor_serial_number
                - type: custom:givtcp-battery-card
                  name: G395 Battery
                  soc_threshold_very_high: 80
                  soc_threshold_high: 60
                  soc_threshold_medium: 40
                  soc_threshold_low: 20
                  soc_threshold_very_high_colour:
                    - 0
                    - 69
                    - 23
                  soc_threshold_high_colour:
                    - 67
                    - 160
                    - 71
                  soc_threshold_medium_colour:
                    - 255
                    - 166
                    - 0
                  soc_threshold_low_colour:
                    - 219
                    - 68
                    - 55
                  soc_threshold_very_low_colour:
                    - 94
                    - 0
                    - 0
                  display_abs_power: true
                  display_type: 2
                  display_dp: 1
                  icon_status_idle: mdi:sleep
                  icon_status_charging: mdi:lightning-bolt
                  icon_status_discharging: mdi:home-battery
                  display_battery_rates: false
                  use_custom_dod: true
                  custom_dod: 80
                  calculate_reserve_from_dod: true
                  display_custom_dod_stats: false
                  display_energy_today: false
                  entity: sensor.h_sd2237g395_invertor_serial_number
          - type: horizontal-stack
            cards:
              - type: custom:power-flow-card-plus
                entities:
                  battery:
                    entity: sensor.g_sd2237g182_battery_power
                    state_of_charge: sensor.g_sd2237g182_soc
                    display_state: one_way
                  grid:
                    entity: sensor.g_sd2237g182_grid_power
                    invert_state: true
                    use_metadata: false
                  solar:
                    entity: sensor.g_sd2237g182_pv_power
                    display_zero_state: true
                  home: {}
                clickable_entities: true
                display_zero_lines:
                  mode: show
                  transparency: 50
                  grey_color:
                    - 189
                    - 189
                    - 189
                use_new_flow_rate_model: true
                w_decimals: 0
                kw_decimals: 1
                min_flow_rate: 0.75
                max_flow_rate: 10
                max_expected_power: 2600
                min_expected_power: 0.01
                watt_threshold: 1000
                transparency_zero_lines: 0
                title: G182 PowerFlow+
              - type: custom:power-flow-card-plus
                entities:
                  battery:
                    entity: sensor.h_sd2237g395_battery_power
                    state_of_charge: sensor.h_sd2237g395_soc
                    display_state: one_way
                  grid:
                    entity: sensor.h_sd2237g395_grid_power
                    invert_state: true
                    use_metadata: false
                  solar:
                    entity: sensor.h_sd2237g395_pv_power
                    display_zero_state: true
                  home:
                    subtract_individual: true
                  individual:
                    - entity: sensor.extension_power
                      name: Extension
                      icon: mdi:home-outline
                      color: red
                      display_zero_tolerance: 50
                    - entity: sensor.ashp_power
                      name: ASHP
                      icon: mdi:heat-pump-outline
                      color: '#9007DD'
                      display_zero_tolerance: 50
                clickable_entities: true
                display_zero_lines:
                  mode: show
                  transparency: 50
                  grey_color:
                    - 189
                    - 189
                    - 189
                use_new_flow_rate_model: true
                w_decimals: 0
                kw_decimals: 1
                min_flow_rate: 0.75
                max_flow_rate: 10
                max_expected_power: 2600
                min_expected_power: 0.01
                watt_threshold: 1000
                transparency_zero_lines: 0
                title: G395 PowerFlow+
          - type: horizontal-stack
            cards:
              - type: entities
                entities:
                  - entity: sensor.g_sd2237g182_soc
                  - entity: select.g_sd2237g182_mode
                  - entity: number.g_sd2237g182_target_soc
                  - entity: number.g_sd2237g182_battery_power_reserve
                  - type: custom:fold-entity-row
                    head:
                      type: section
                      label: Charge/Discharge Settings
                    entities:
                      - entity: select.g_sd2237g182_battery_pause_mode
                      - entity: select.g_sd2237g182_force_charge
                      - entity: number.g_sd2237g182_battery_charge_rate
                      - entity: switch.g_sd2237g182_enable_charge_schedule
                      - entity: select.g_sd2237g182_charge_start_time_slot_1
                      - entity: select.g_sd2237g182_charge_end_time_slot_1
                      - entity: select.g_sd2237g182_temp_pause_charge
                      - entity: select.g_sd2237g182_force_export
                      - entity: number.g_sd2237g182_battery_discharge_rate
                      - entity: switch.g_sd2237g182_enable_discharge_schedule
                      - entity: select.g_sd2237g182_discharge_start_time_slot_1
                      - entity: select.g_sd2237g182_discharge_end_time_slot_1
                title: G182 Inv1 Control
              - type: entities
                entities:
                  - entity: sensor.h_sd2237g395_soc
                  - entity: select.h_sd2237g395_mode
                  - entity: number.h_sd2237g395_target_soc
                  - entity: number.h_sd2237g395_battery_power_reserve
                  - type: custom:fold-entity-row
                    head:
                      type: section
                      label: Charge/Discharge Settings
                    entities:
                      - entity: select.h_sd2237g395_battery_pause_mode
                      - entity: select.h_sd2237g395_force_charge
                      - entity: number.h_sd2237g395_battery_charge_rate
                      - entity: switch.h_sd2237g395_enable_charge_schedule
                      - entity: select.h_sd2237g395_charge_start_time_slot_1
                      - entity: select.h_sd2237g395_charge_end_time_slot_1
                      - entity: select.h_sd2237g395_temp_pause_charge
                      - entity: select.h_sd2237g395_force_export
                      - entity: number.h_sd2237g395_battery_discharge_rate
                      - entity: switch.h_sd2237g395_enable_discharge_schedule
                      - entity: select.h_sd2237g395_discharge_start_time_slot_1
                      - entity: select.h_sd2237g395_discharge_end_time_slot_1
                title: G395 Inv2 Control
          - type: custom:hourly-weather
            entity: weather.met_office_daily
            icons: true
            show_wind: speed
            show_precipitation_probability: true
            show_date: boundary
            label_spacing: '1'
            num_segments: '12'
            name: Weather forecast
          - type: horizontal-stack
            title: Solar forecast
            cards:
              - type: entities
                entities:
                  - entity: sensor.solcast_pv_forecast_today
                  - entity: sensor.solcast_pv_10_forecast_today
                  - entity: sensor.sum_solar_energy_today
                    name: Total Solar Energy Today
                  - entity: sensor.solcast_pv_forecast_remaining_today
                  - entity: sensor.solcast_pv_peak_forecast_today_inv_1
              - type: entities
                entities:
                  - entity: sensor.solcast_pv_forecast_tomorrow
                  - entity: sensor.solcast_pv_10_forecast_tomorrow
                  - entity: sensor.solcast_pv_forecast_day_3
                  - entity: sensor.solcast_pv_forecast_day_4
                  - entity: sensor.solcast_pv_peak_forecast_tomorrow_inv_1
  - title: Power
    path: energy-meters
    type: custom:grid-layout
    icon: mdi:speedometer
    badges: []
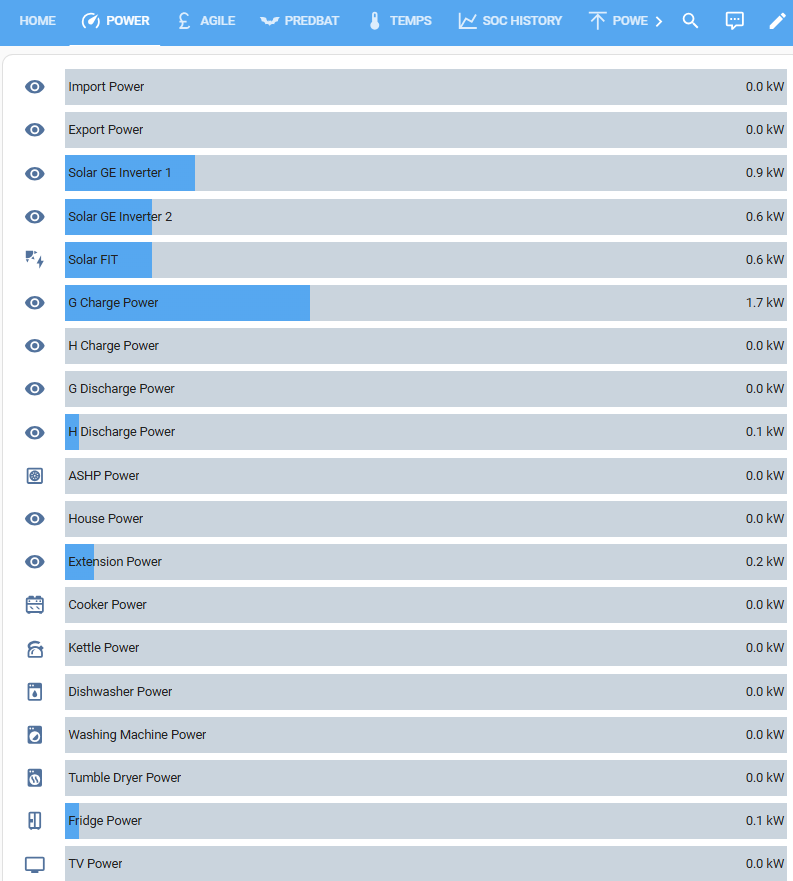
    cards:
      - type: custom:bar-card
        entities:
          - entity: sensor.g_sd2237g182_import_power
            name: Import Power
          - entity: sensor.g_sd2237g182_export_power
            name: Export Power
          - entity: sensor.g_sd2237g182_pv_power
            name: Solar GE Inverter 1
          - entity: sensor.h_sd2237g395_pv_power
            name: Solar GE Inverter 2
          - entity: sensor.fit_solar_power
            name: Solar FIT
          - entity: sensor.g_sd2237g182_charge_power
            name: G Charge Power
          - entity: sensor.h_sd2237g395_charge_power
            name: H Charge Power
          - entity: sensor.g_sd2237g182_discharge_power
            name: G Discharge Power
          - entity: sensor.h_sd2237g395_discharge_power
            name: H Discharge Power
          - entity: sensor.ashp_power
          - entity: sensor.g_sd2237g182_eps_power
            name: House Power
          - entity: sensor.extension_power
          - entity: sensor.cooker_power
          - entity: sensor.kettle_power
          - entity: sensor.dishwasher_power
          - entity: sensor.washing_machine_power
          - entity: sensor.tumble_dryer_power
          - entity: sensor.fridge_power
          - entity: sensor.tv_power
          - entity: sensor.internet_ha_power
          - entity: sensor.horse_shed_heater_power
          - entity: sensor.workshop_heater_power
          - entity: sensor.toby_bedroom_sockets_power
          - entity: sensor.toby_bedroom_light_power
          - entity: sensor.hot_tub_power
        max: 5
        decimal: 1
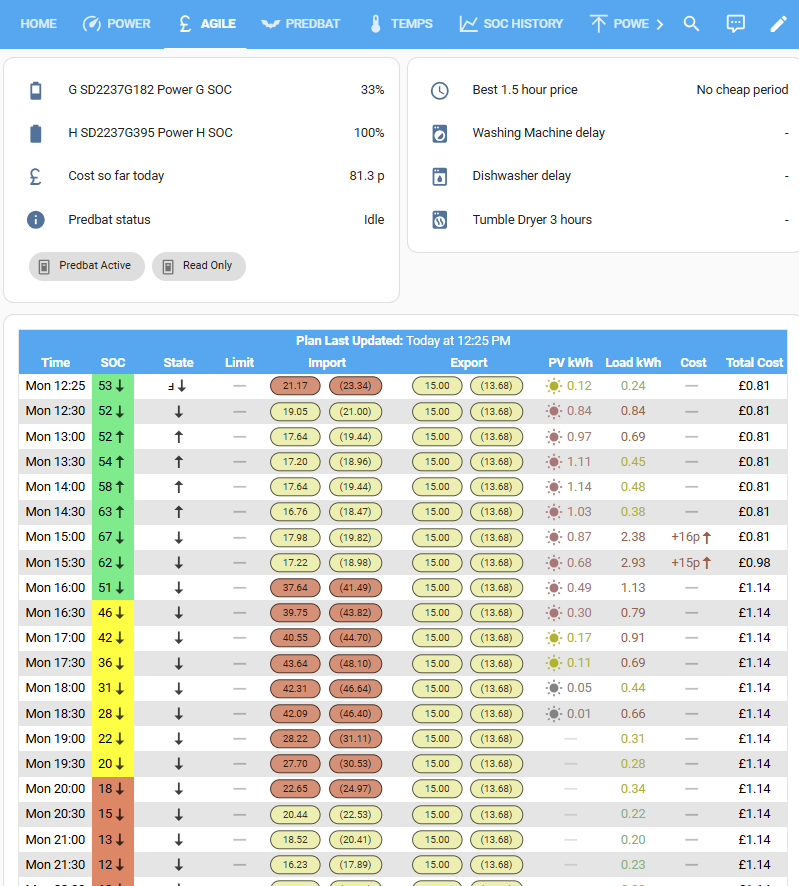
  - title: Agile
    path: octopus-agile-rates
    icon: mdi:currency-gbp
    type: custom:grid-layout
    badges: []
    cards:
      - type: horizontal-stack
        cards:
          - type: vertical-stack
            cards:
              - type: entities
                entities:
                  - entity: sensor.g_sd2237g182_soc
                  - entity: sensor.h_sd2237g395_soc
                  - entity: predbat.cost_today
                    icon: mdi:currency-gbp
                  - entity: predbat.status
                    name: Predbat status
                  - type: buttons
                    entities:
                      - entity: switch.predbat_active
                        name: Predbat Active
                      - entity: switch.predbat_set_read_only
                        name: Read Only
                show_header_toggle: false
          - type: vertical-stack
            cards:
              - type: entities
                entities:
                  - type: custom:template-entity-row
                    icon: mdi:clock-outline
                    name: Best 1.5 hour price
                    state: >-
                      {% set t_time =
                      state_attr('binary_sensor.octopus_energy_target_1_5_hour','target_times')
                      %} {% if t_time %} {{
                      (state_attr('binary_sensor.octopus_energy_target_1_5_hour','next_average_cost')
                      *100)|round(1) }} p/kWh @ {{
                      as_timestamp(t_time[0].start)|timestamp_custom('%a %-I:%M
                      %p') }} {% else %} No cheap period {% endif %}
                  - type: custom:template-entity-row
                    name: Washing Machine delay
                    icon: mdi:washing-machine
                    state: >-
                      {% set t_time =
                      state_attr('binary_sensor.octopus_energy_target_1_5_hour','target_times')
                      %} {% if t_time %} {{ (as_timestamp(t_time[0].start)
                      -as_timestamp(now())+(80*60))|timestamp_custom('%-H:%M',false)
                      }} {% else %} - {% endif %}
                  - type: custom:template-entity-row
                    name: Dishwasher delay
                    icon: mdi:dishwasher
                    state: >-
                      {% set t_time =
                      state_attr('binary_sensor.octopus_energy_target_1_5_hour','target_times')
                      %} {% if t_time %} {{ (as_timestamp(t_time[0].start)
                      -as_timestamp(now())-(30*60))|timestamp_custom('%-H:%M',false)
                      }} {% else %} - {% endif %}
                  - type: custom:template-entity-row
                    name: >-
                      {% set t_time =
                      state_attr('binary_sensor.octopus_energy_target_3_hour','target_times')
                      %} Tumble Dryer 3 hours {% if t_time %} from  {{
                      as_timestamp(t_time[0].start) |timestamp_custom('%a %-I:%M
                      %p') }}, delay {% endif %}
                    icon: mdi:tumble-dryer
                    state: >-
                      {% set t_time =
                      state_attr('binary_sensor.octopus_energy_target_3_hour','target_times')
                      %} {% if t_time %} {{ (as_timestamp(t_time[0].start)
                      -as_timestamp(now()))|timestamp_custom('%-H:%M',false) }}
                      {% else %} - {% endif %}
      - type: conditional
        conditions:
          - condition: screen
            media_query: '(min-width: 0px) and (max-width: 767px)'
        card:
          type: custom:predbat-table-card
          entity: predbat.plan_html
          columns:
            - time-column
            - soc-column
            - state-column
            - limit-column
            - import-column
            - pv-column
            - load-column
            - cost-column
            - total-column
          old_skool_columns:
            - soc-column
            - state-column
          odd_row_colour: '#181f2a'
          even_row_colour: '#2a3240'
          table_width: 100
          stack_pills: false
          force_single_line: true
      - type: conditional
        conditions:
          - condition: screen
            media_query: '(min-width: 768px)'
        card:
          type: custom:predbat-table-card
          entity: predbat.plan_html
          columns:
            - time-column
            - soc-column
            - state-column
            - limit-column
            - import-column
            - export-column
            - pv-column
            - load-column
            - cost-column
            - total-column
          old_skool_columns:
            - soc-column
            - state-column
          odd_row_colour: '#181f2a'
          even_row_colour: '#2a3240'
          table_width: 100
          fill_empty_cells: true
          stack_pills: false
      - type: entities
        entities:
          - type: custom:template-entity-row
            icon: mdi:clock-outline
            name: Best 1.5 hour price
            state: >-
              {% set t_time =
              state_attr('binary_sensor.octopus_energy_target_1_5_hour','target_times')
              %} {% if t_time %} {{
              (state_attr('binary_sensor.octopus_energy_target_1_5_hour','next_average_cost')
              *100)|round(1) }} p/kWh @ {{
              as_timestamp(t_time[0].start)|timestamp_custom('%a %-I:%M %p') }}
              {% else %} No cheap period {% endif %}
          - type: custom:template-entity-row
            icon: mdi:clock-outline
            name: Best 3 hour price
            state: >-
              {% set st_time =
              state_attr('binary_sensor.octopus_energy_target_3_hour','target_times')
              %} {% if st_time == None %} {{
              (state_attr('binary_sensor.octopus_energy_target_3_hour','next_average_cost')
              *100)|round(1) }} p/kWh @ {{
              as_timestamp(t_time[0].start)|timestamp_custom('%a %-I:%M %p') }}
              {% else %} No cheap period {% endif %}
      - type: custom:octopus-energy-rates-card
        title: Agile Import Rates
        currentEntity: >-
          event.octopus_energy_electricity_xxx_yyy_current_day_rates
        pastEntity: >-
          event.octopus_energy_electricity_xxx_yyy_previous_day_rates
        futureEntity: >-
          event.octopus_energy_electricity_xxx_yyy_next_day_rates
        cols: 3
        showday: true
        showpast: false
        cheapest: true
        unitrate: p
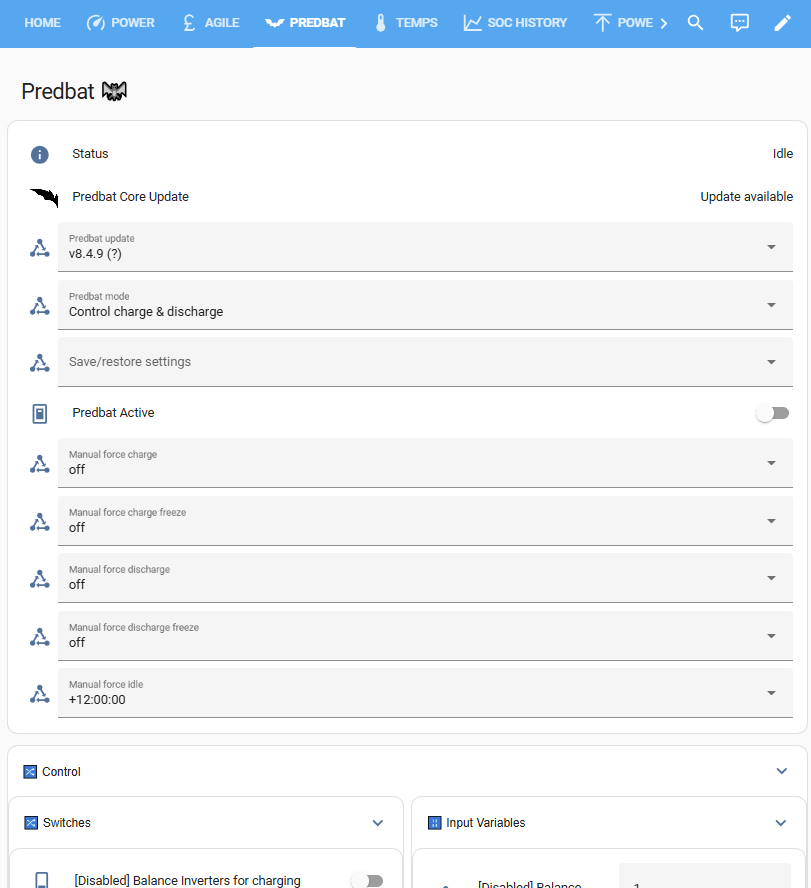
  - title: Predbat
    path: predbat
    icon: mdi:bat
    type: custom:grid-layout
    cards:
      - type: vertical-stack
        title: Predbat 🦇
        cards:
          - type: entities
            entities:
              - entity: predbat.status
              - entity: update.predbat_version
              - entity: select.predbat_update
              - entity: select.predbat_mode
              - entity: select.predbat_saverestore
              - entity: switch.predbat_active
              - entity: select.predbat_manual_charge
              - entity: select.predbat_manual_freeze_charge
              - entity: select.predbat_manual_discharge
              - entity: select.predbat_manual_freeze_discharge
              - entity: select.predbat_manual_idle
      - type: conditional
        conditions:
          - condition: screen
            media_query: '(min-width: 0px) and (max-width: 767px)'
        card:
          type: horizontal-stack
          cards:
            - type: vertical-stack
              cards:
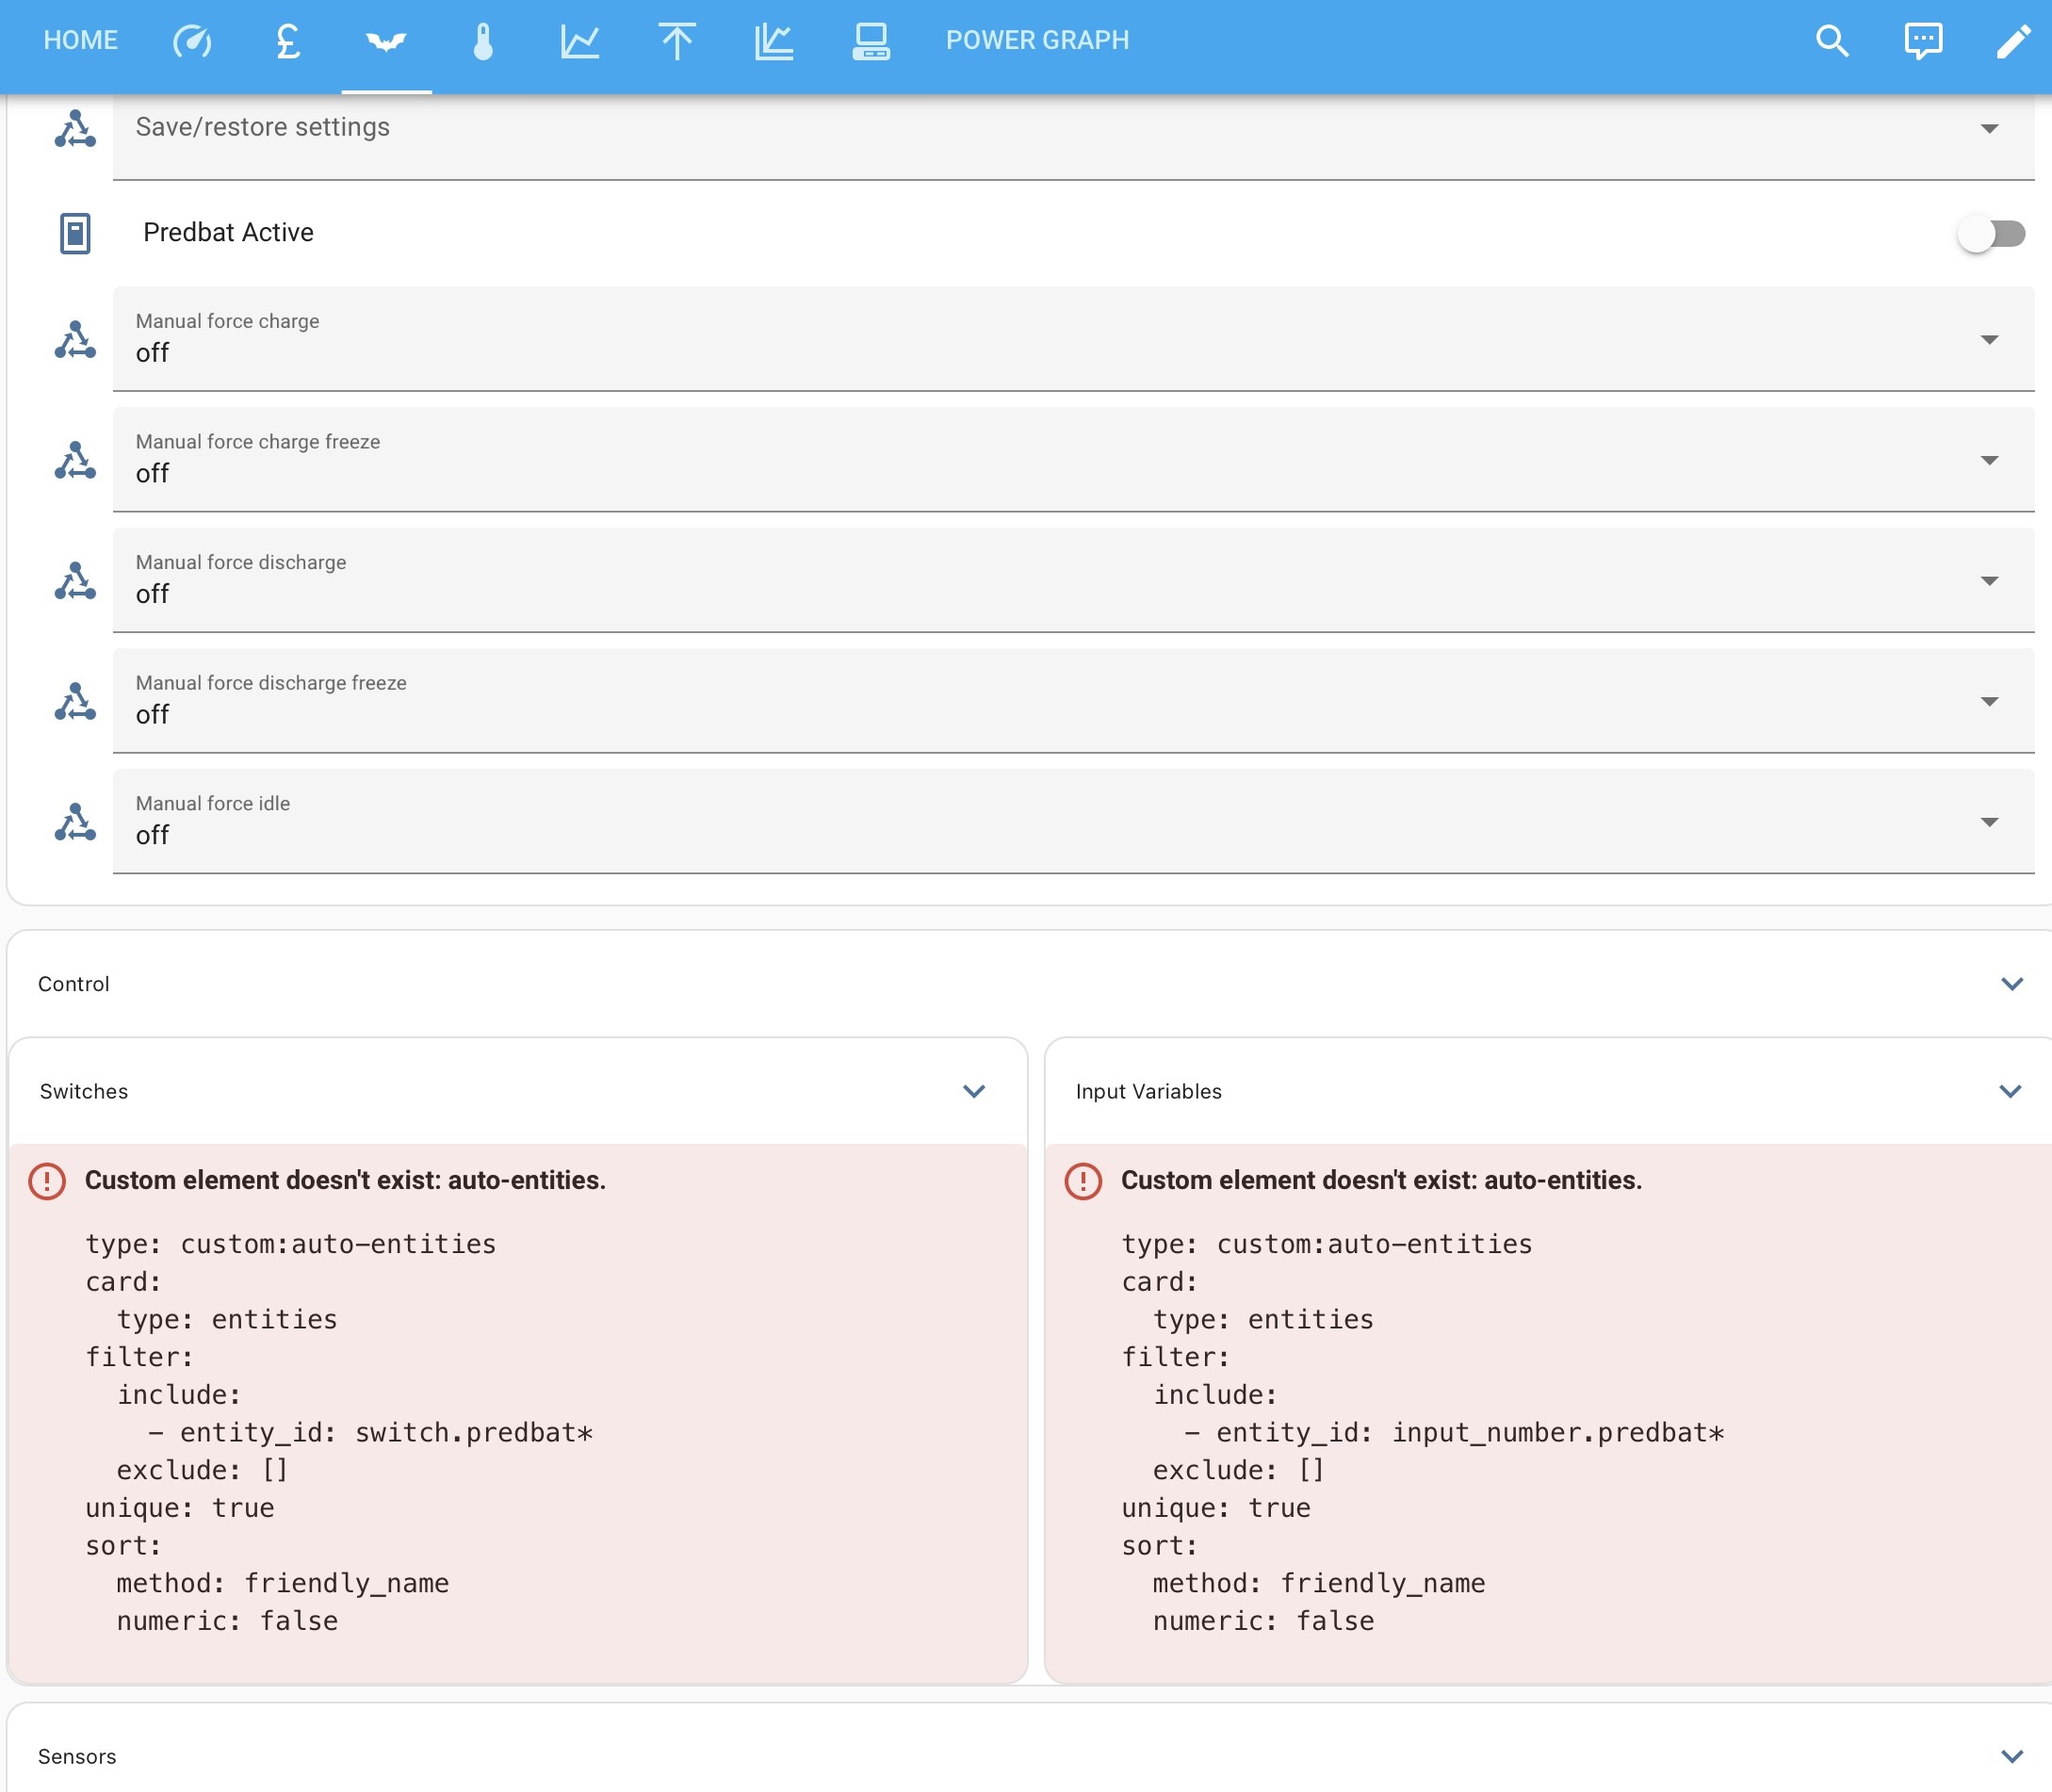
                - type: custom:collapsable-cards
                  title: 🔀 Control
                  defaultOpen: false
                  cards:
                    - type: custom:collapsable-cards
                      title: 🔀 Switches
                      defaultOpen: true
                      cards:
                        - type: custom:auto-entities
                          card:
                            type: entities
                          filter:
                            include:
                              - entity_id: switch.predbat*
                            exclude: []
                          unique: true
                          sort:
                            method: friendly_name
                            numeric: false
                    - type: custom:collapsable-cards
                      title: 🔢 Input Variables
                      defaultOpen: true
                      cards:
                        - type: custom:auto-entities
                          card:
                            type: entities
                          filter:
                            include:
                              - entity_id: input_number.predbat*
                            exclude: []
                          unique: true
                          sort:
                            method: friendly_name
                            numeric: false
                - type: custom:collapsable-cards
                  title: '#️⃣ Sensors'
                  defaultOpen: false
                  cards:
                    - type: custom:collapsable-cards
                      title: 💷 Cost Sensors
                      defaultOpen: false
                      cards:
                        - type: custom:auto-entities
                          card:
                            type: entities
                          filter:
                            include:
                              - entity_id: predbat.*cost*
                              - entity_id: predbat.*rate*
                              - entity_id: predbat.*metric*
                            exclude:
                              - entity_id: predbat.*start*
                              - entity_id: predbat.*end*
                              - entity_id: predbat.*duration*
                          unique: true
                          sort:
                            method: friendly_name
                            numeric: false
                    - type: custom:collapsable-cards
                      title: 🕛 Time/Duration Sensors
                      defaultOpen: false
                      cards:
                        - type: custom:auto-entities
                          card:
                            type: entities
                          filter:
                            include:
                              - entity_id: predbat.*start*
                              - entity_id: predbat.*end*
                              - entity_id: predbat.*duration*
                              - entity_id: predbat.*record*
                            exclude: []
                          unique: true
                          sort:
                            method: friendly_name
                            numeric: false
                    - type: custom:collapsable-cards
                      title: ⚡ Power Sensors
                      defaultOpen: false
                      cards:
                        - type: custom:auto-entities
                          card:
                            type: entities
                          filter:
                            include:
                              - entity_id: predbat.*soc*
                              - entity_id: predbat.*energy*
                              - entity_id: predbat.*load*
                              - entity_id: predbat.*battery*
                              - entity_id: predbat.*kw*
                              - entity_id: predbat.*power*
                            exclude: []
                          unique: true
                          sort:
                            method: friendly_name
                            numeric: false
                    - type: custom:collapsable-cards
                      title: 1️⃣ Binary Sensors
                      defaultOpen: false
                      cards:
                        - type: custom:auto-entities
                          card:
                            type: entities
                          filter:
                            include:
                              - entity_id: binary_sensor.predbat*
                            exclude: []
                          unique: true
                          sort:
                            method: friendly_name
                            numeric: false
      - type: conditional
        conditions:
          - condition: screen
            media_query: '(min-width: 768px)'
        card:
          type: vertical-stack
          cards:
            - type: custom:collapsable-cards
              title: 🔀 Control
              defaultOpen: true
              cards:
                - type: horizontal-stack
                  cards:
                    - type: custom:collapsable-cards
                      title: 🔀 Switches
                      defaultOpen: true
                      cards:
                        - type: custom:auto-entities
                          card:
                            type: entities
                          filter:
                            include:
                              - entity_id: switch.predbat*
                            exclude: []
                          unique: true
                          sort:
                            method: friendly_name
                            numeric: false
                    - type: custom:collapsable-cards
                      title: 🔢 Input Variables
                      defaultOpen: true
                      cards:
                        - type: custom:auto-entities
                          card:
                            type: entities
                          filter:
                            include:
                              - entity_id: input_number.predbat*
                            exclude: []
                          unique: true
                          sort:
                            method: friendly_name
                            numeric: false
            - type: custom:collapsable-cards
              title: '#️⃣ Sensors'
              defaultOpen: false
              cards:
                - type: horizontal-stack
                  cards:
                    - type: vertical-stack
                      cards:
                        - type: custom:collapsable-cards
                          title: 1️⃣ Binary Sensors
                          defaultOpen: false
                          cards:
                            - type: custom:auto-entities
                              card:
                                type: entities
                              filter:
                                include:
                                  - entity_id: binary_sensor.predbat*
                                exclude: []
                              unique: true
                              sort:
                                method: friendly_name
                                numeric: false
                        - type: custom:collapsable-cards
                          title: 💷 Cost Sensors
                          defaultOpen: false
                          cards:
                            - type: custom:auto-entities
                              card:
                                type: entities
                              filter:
                                include:
                                  - entity_id: predbat.*cost*
                                  - entity_id: predbat.*rate*
                                  - entity_id: predbat.*metric*
                                exclude:
                                  - entity_id: predbat.*start*
                                  - entity_id: predbat.*end*
                                  - entity_id: predbat.*duration*
                              unique: true
                              sort:
                                method: friendly_name
                                numeric: false
                        - type: custom:collapsable-cards
                          title: 🕛 Time/Duration Sensors
                          defaultOpen: false
                          cards:
                            - type: custom:auto-entities
                              card:
                                type: entities
                              filter:
                                include:
                                  - entity_id: predbat.*start*
                                  - entity_id: predbat.*end*
                                  - entity_id: predbat.*duration*
                                  - entity_id: predbat.*record*
                                exclude: []
                              unique: true
                              sort:
                                method: friendly_name
                                numeric: false
                    - type: custom:collapsable-cards
                      title: ⚡ Power Sensors
                      defaultOpen: false
                      cards:
                        - type: custom:auto-entities
                          card:
                            type: entities
                          filter:
                            include:
                              - entity_id: predbat.*soc*
                              - entity_id: predbat.*energy*
                              - entity_id: predbat.*load*
                              - entity_id: predbat.*battery*
                              - entity_id: predbat.*kw*
                              - entity_id: predbat.*power*
                            exclude: []
                          unique: true
                          sort:
                            method: friendly_name
                            numeric: false
  - title: Temps
    path: temps
    icon: mdi:thermometer
    type: custom:grid-layout
    badges: []
    cards:
      - type: entities
        entities:
          - entity: sensor.porch_temperature
          - entity: sensor.hall_temperature
          - entity: sensor.kitchen_temperature
          - entity: sensor.living_room_temperature
          - entity: sensor.bedroom_temperature
          - entity: sensor.horse_shed_temperature
          - entity: sensor.workshop_temperature
          - entity: sensor.freezer_temperature
      - type: history-graph
        entities:
          - entity: sensor.porch_temperature
          - entity: sensor.hall_temperature
          - entity: sensor.living_room_temperature
          - entity: sensor.bedroom_temperature
          - entity: sensor.kitchen_temperature
          - entity: sensor.workshop_temperature
          - entity: sensor.horse_shed_temperature
        hours_to_show: 8
        logarithmic_scale: false
      - type: history-graph
        entities:
          - entity: sensor.freezer_temperature
        hours_to_show: 8
        logarithmic_scale: false
        min_y_axis: -25
        max_y_axis: 0
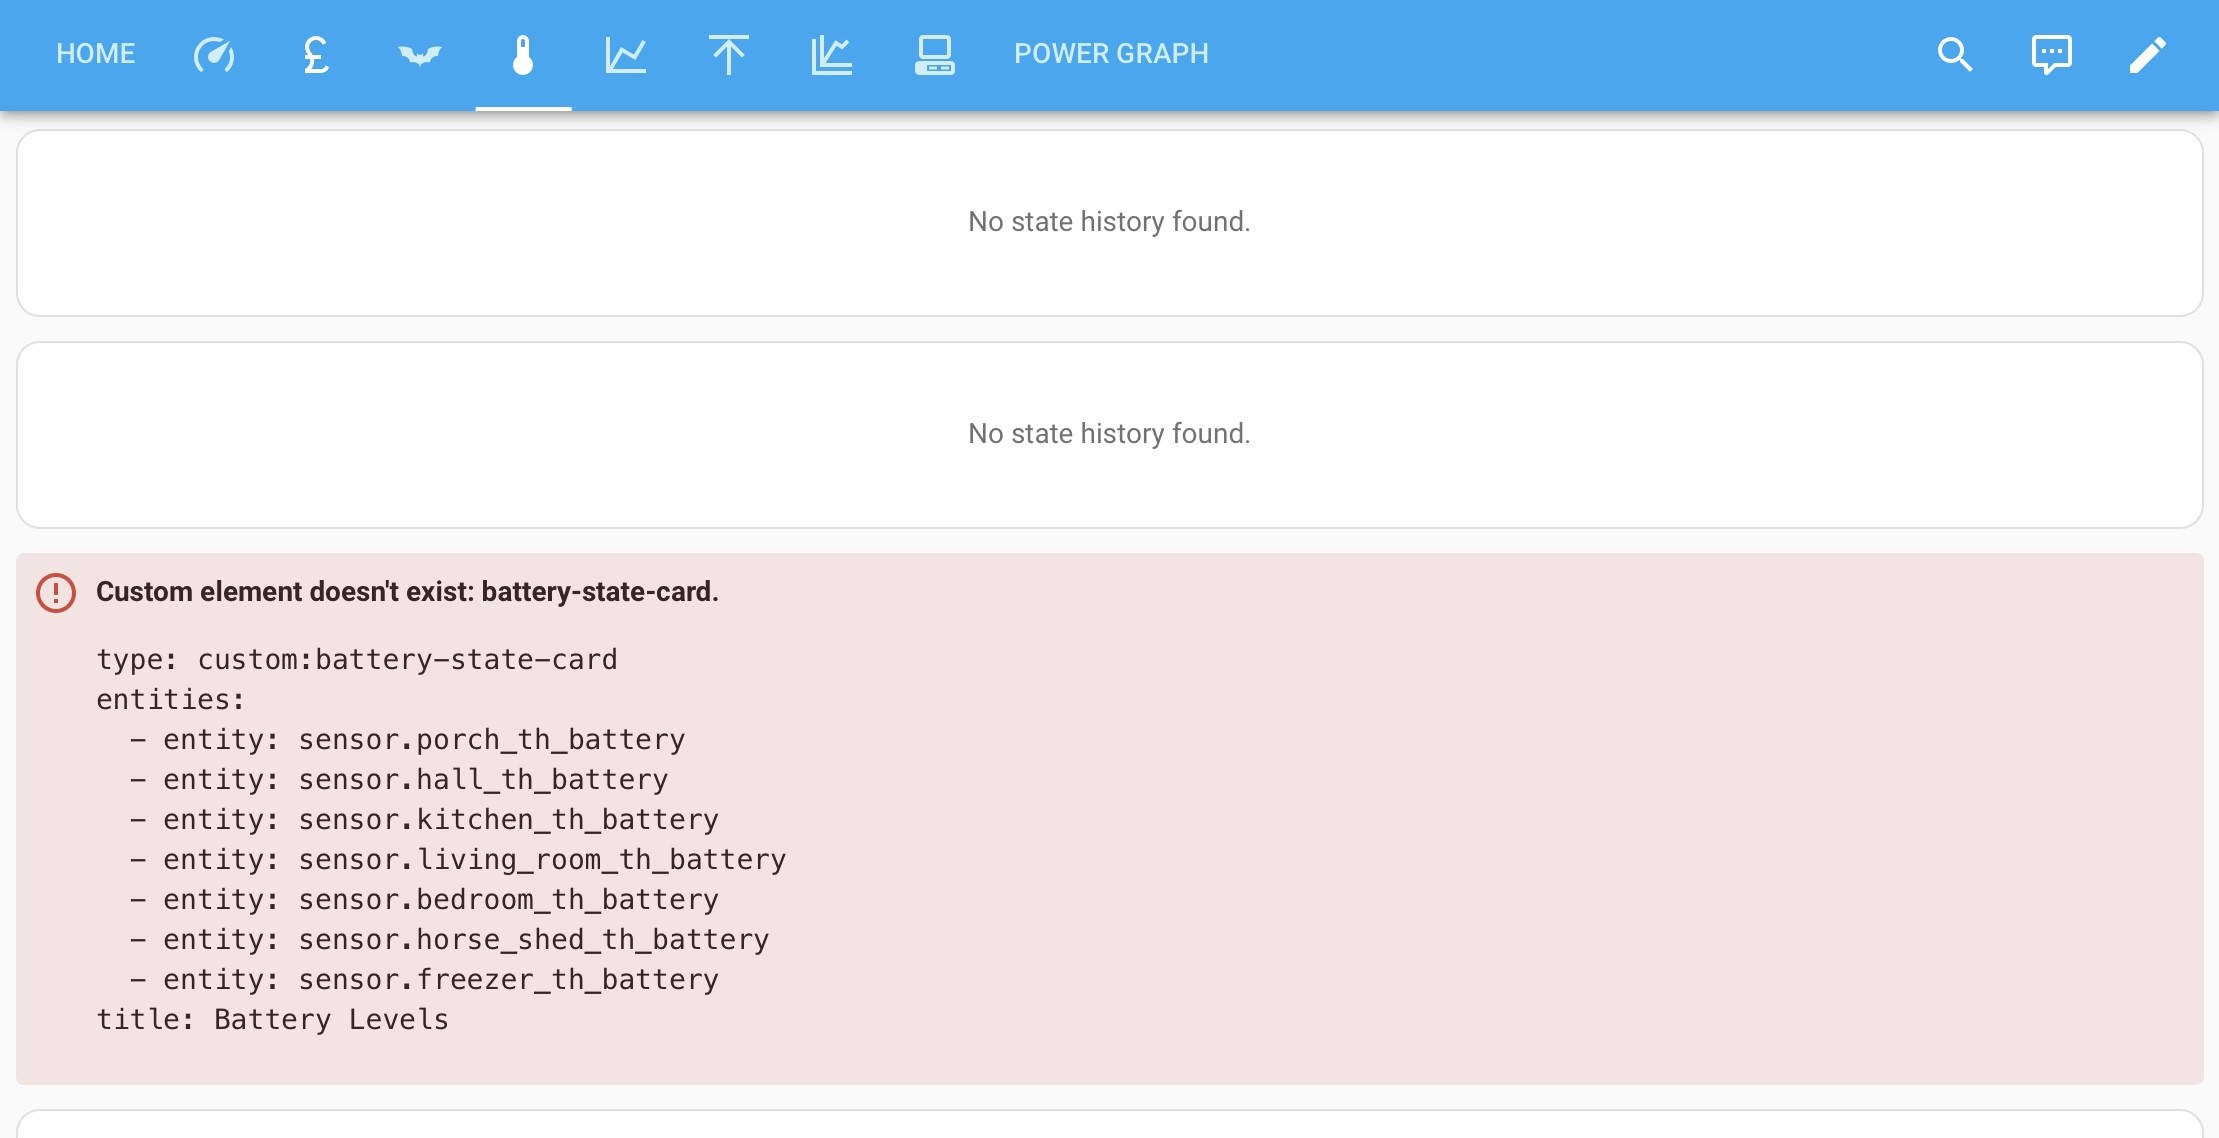
      - type: custom:battery-state-card
        entities:
          - entity: sensor.porch_th_battery
          - entity: sensor.hall_th_battery
          - entity: sensor.kitchen_th_battery
          - entity: sensor.living_room_th_battery
          - entity: sensor.bedroom_th_battery
          - entity: sensor.horse_shed_th_battery
          - entity: sensor.freezer_th_battery
        title: Battery Levels
      - type: history-graph
        entities:
          - entity: sensor.g_sd2237g182_invertor_temperature
          - entity: sensor.g_dx2327g139_battery_temperature
          - entity: sensor.h_sd2237g395_invertor_temperature
          - entity: sensor.h_bj2238g271_battery_temperature
          - entity: switch.inverter_1_fan
          - entity: switch.inverter_2_fan
        hours_to_show: 8
        logarithmic_scale: false
        max_y_axis: 70
        min_y_axis: 10
      - type: entities
        entities:
          - entity: climate.inverter_1_fan
          - entity: sensor.inverter_1_fans_on_today
          - entity: sensor.g_dx2327g139_battery_temperature
          - entity: climate.inverter_2_fan
          - entity: sensor.inverter_2_fans_on_today
          - entity: sensor.h_bj2238g271_battery_temperature
  - title: SoC History
    path: soc-history
    type: custom:grid-layout
    icon: mdi:chart-line
    cards:
      - type: history-graph
        entities:
          - entity: sensor.g_sd2237g182_soc
          - entity: sensor.h_sd2237g395_soc
          - entity: predbat.soc_kw_h0
          - entity: predbat.import_energy_h0
          - entity: sensor.g_sd2237g182_battery_power
          - entity: sensor.h_sd2237g395_battery_power
          - entity: predbat.rates
        hours_to_show: 18
      - type: history-graph
        entities:
          - entity: predbat.export_energy_h0
        hours_to_show: 18
      - type: history-graph
        entities:
          - entity: sensor.g_sd2237g182_pv_power
          - entity: sensor.h_sd2237g395_pv_power
          - entity: sensor.fit_solar_power
        hours_to_show: 18
      - type: history-graph
        entities:
          - entity: sensor.total_solar_power
        hours_to_show: 18
  - title: Powerup
    path: powerup
    icon: mdi:arrow-collapse-up
    type: custom:grid-layout
    badges: []
    cards:
      - type: entities
        entities:
          - entity: input_datetime.octopus_power_up_date
          - entity: input_datetime.octopus_power_up_start_time
          - entity: input_datetime.octopus_power_up_end_time
          - type: button
            name: Save Power Up event to Predbat
            icon: mdi:script-text-play-outline
            action_name: Execute
            tap_action:
              action: perform-action
              perform_action: shell_command.predbat_add_power_up_event
          - type: divider
          - entity: sensor.octopus_free_electricity_times
          - type: button
            icon: mdi:script-text-play-outline
            name: Set free electricity times
            action_name: Execute
            tap_action:
              action: perform-action
              perform_action: >-
                script.set_octopus_power_up_helpers_from_free_electricity_rest_sensor
          - type: divider
          - entity: sensor.octopus_power_up_times
          - type: button
            icon: mdi:script-text-play-outline
            name: Set Power Up electricity times
            action_name: Execute
            tap_action:
              action: perform-action
              perform_action: >-
                script.set_octopus_power_up_helpers_from_power_up_electricity_rest_sensor
      - show_name: true
        show_icon: false
        type: button
        tap_action:
          action: call-service
          service: shell_command.predbat_add_power_up_event
          target: {}
        name: Save Power Up event to Predbat
G
#39 geoffreycoan

Part 2 of my dashboard, it was too long to post as a single message!

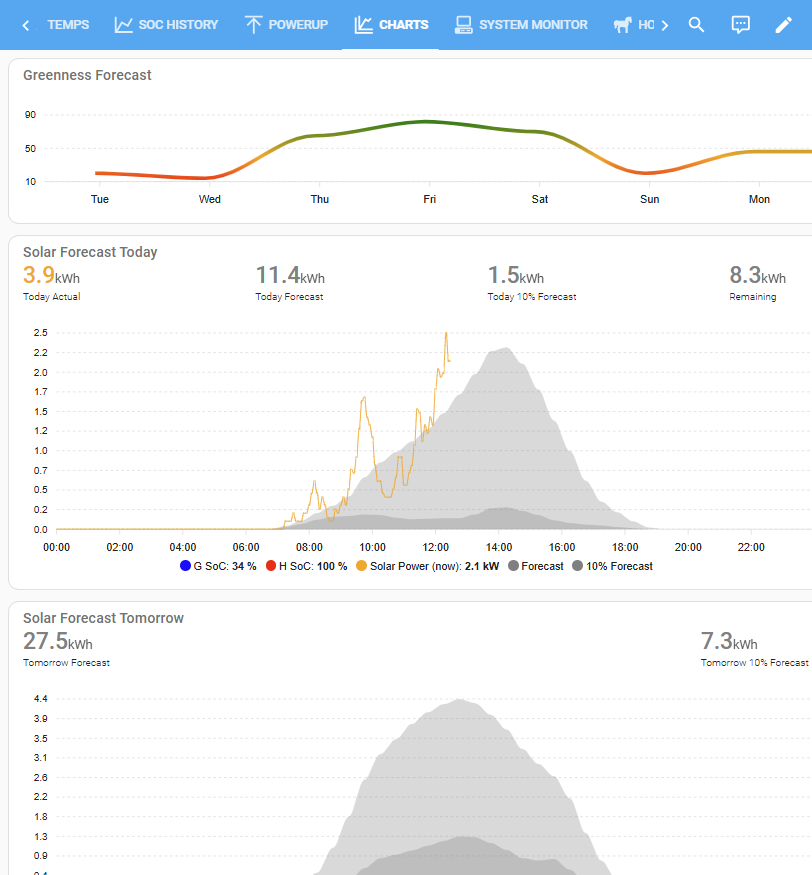
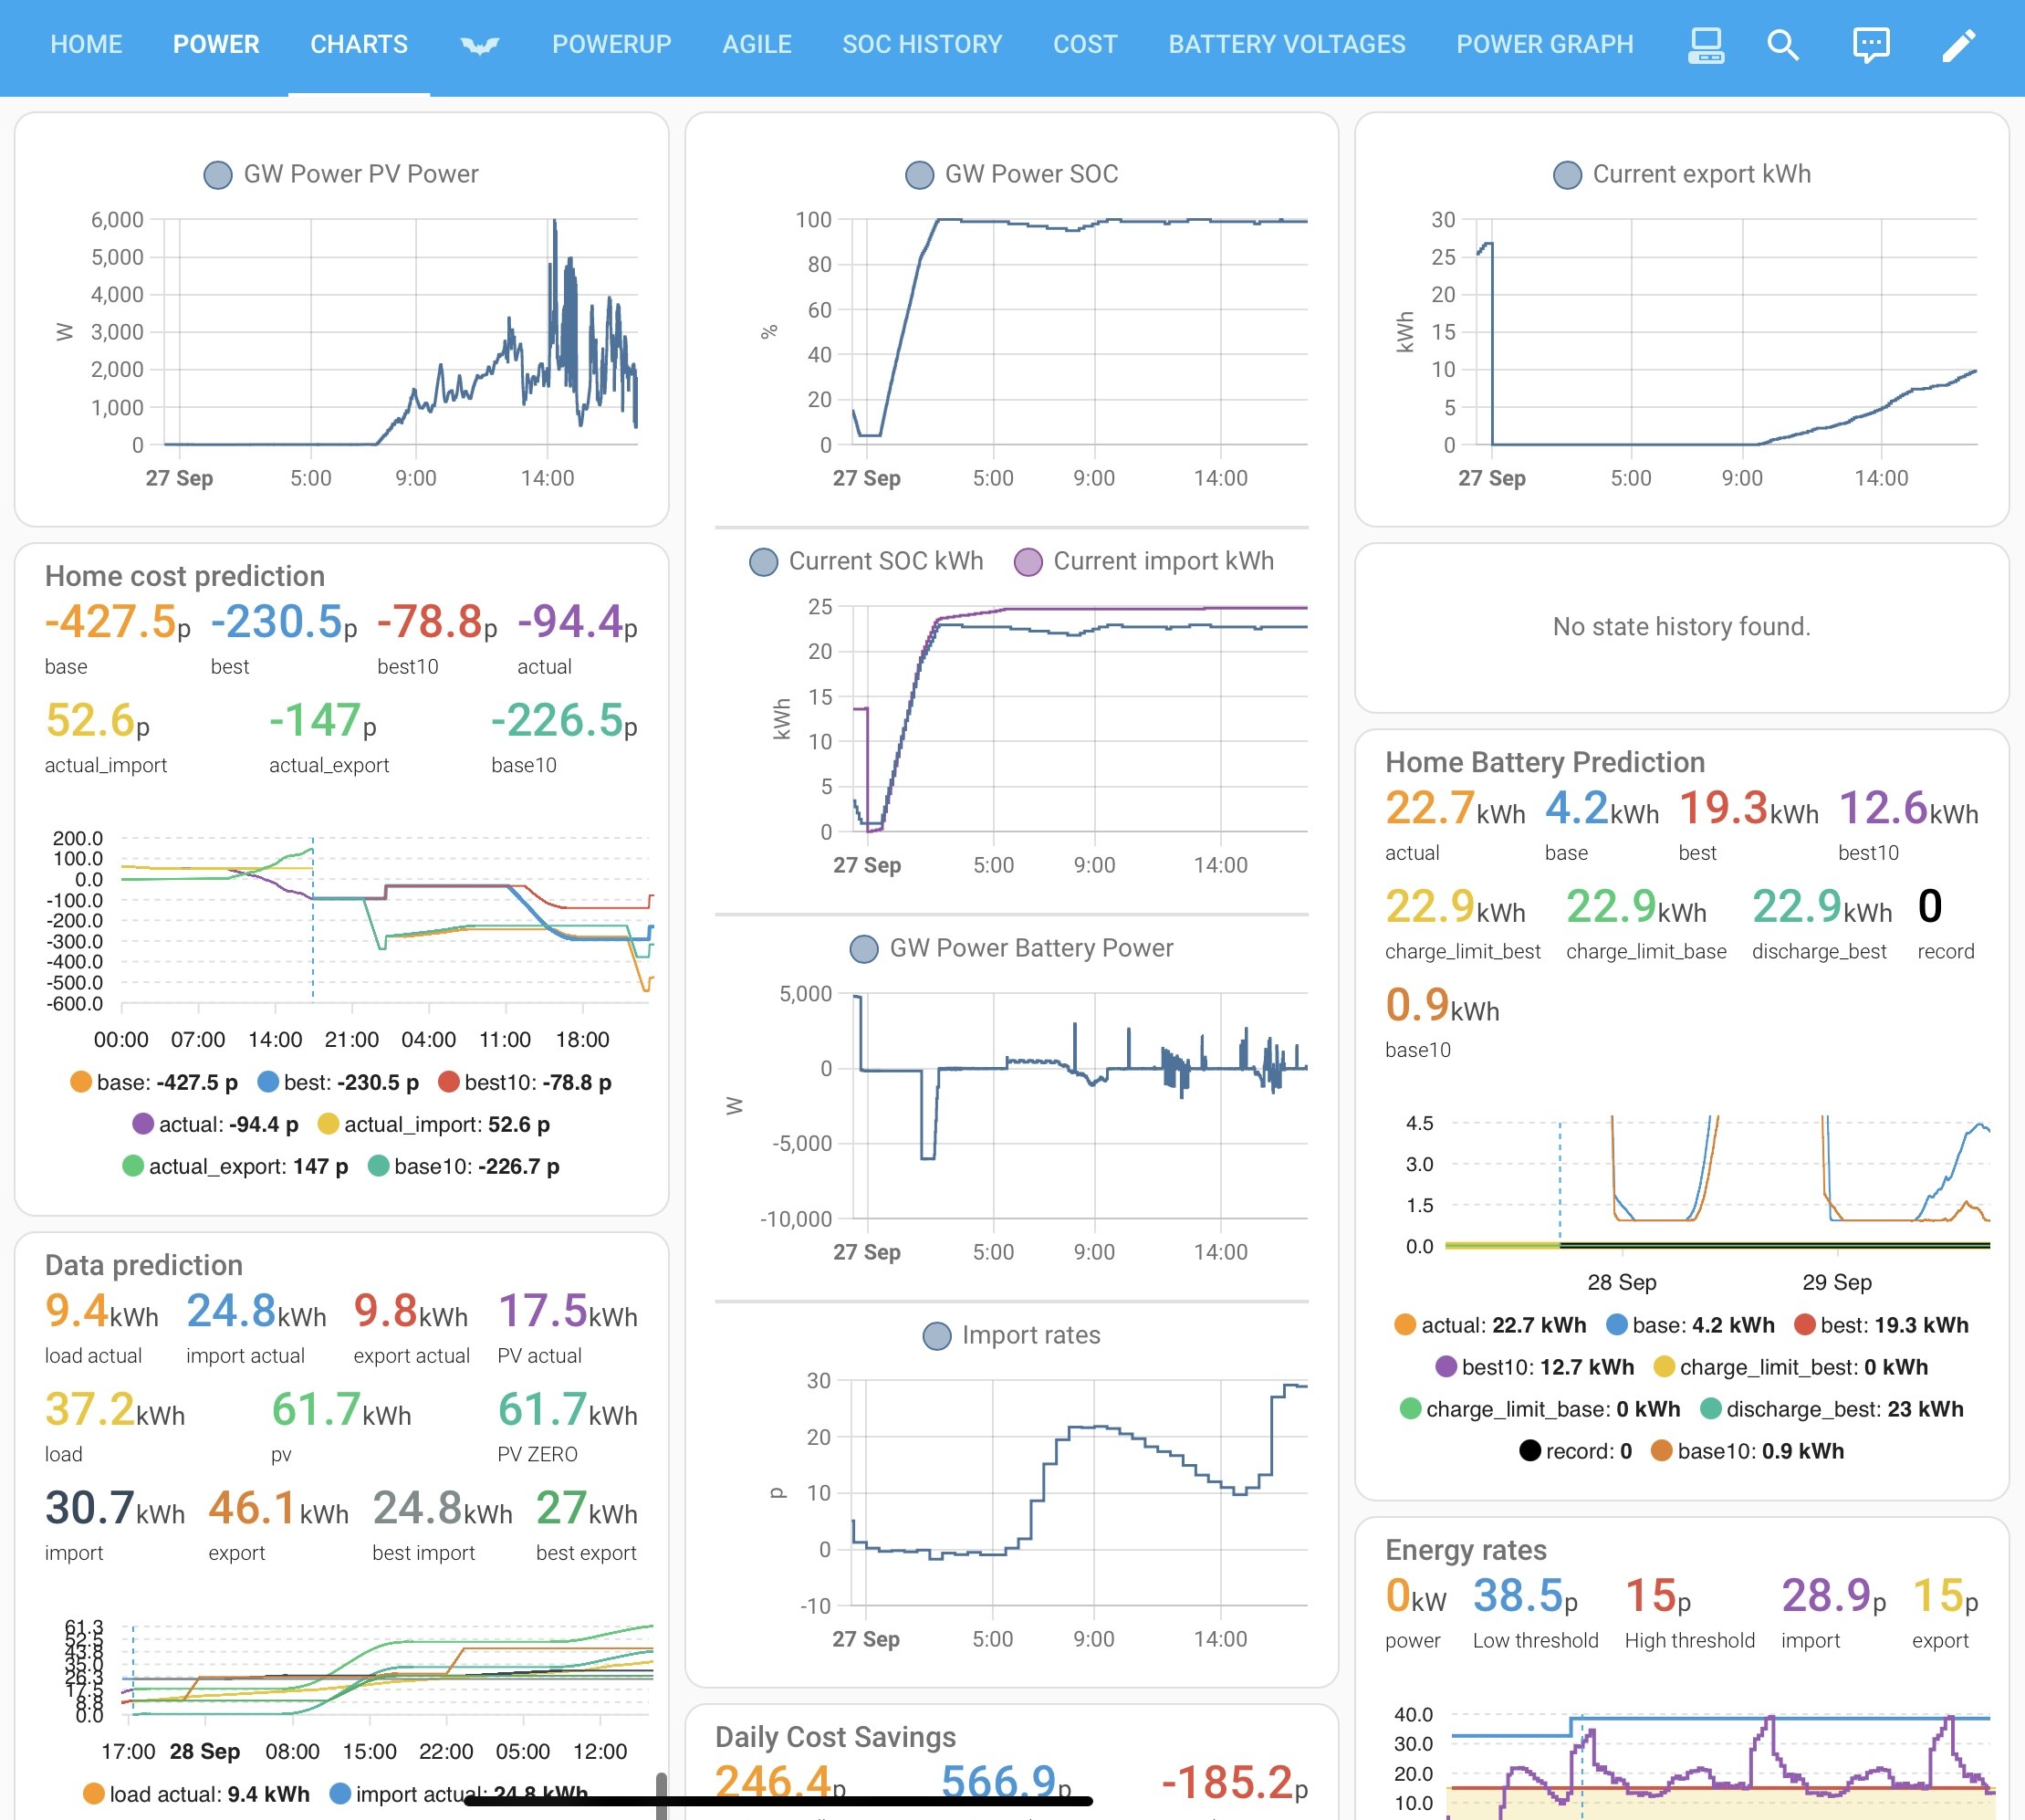
  - title: Charts
    path: charts
    icon: mdi:chart-multiple
    type: custom:grid-layout
    badges: []
    cards:
      - type: custom:apexcharts-card
        experimental:
          color_threshold: true
        header:
          show: true
          title: Greenness Forecast
        graph_span: 7d
        span:
          start: hour
        apex_config:
          chart:
            height: 135
          stroke:
            width: 4
          xaxis:
            labels:
              format: ddd
        series:
          - entity: sensor.octopus_energy_a_b09db615_greenness_forecast_current_index
            name: Forecast
            show:
              in_header: false
              legend_value: false
            color_threshold:
              - value: 0
                color: red
              - value: 40
                color: orange
              - value: 80
                color: green
            data_generator: |
              return entity.attributes.forecast.slice(0, 7).map((entry) => {
              return [new Date(entry.start), entry.greenness_score];
                });
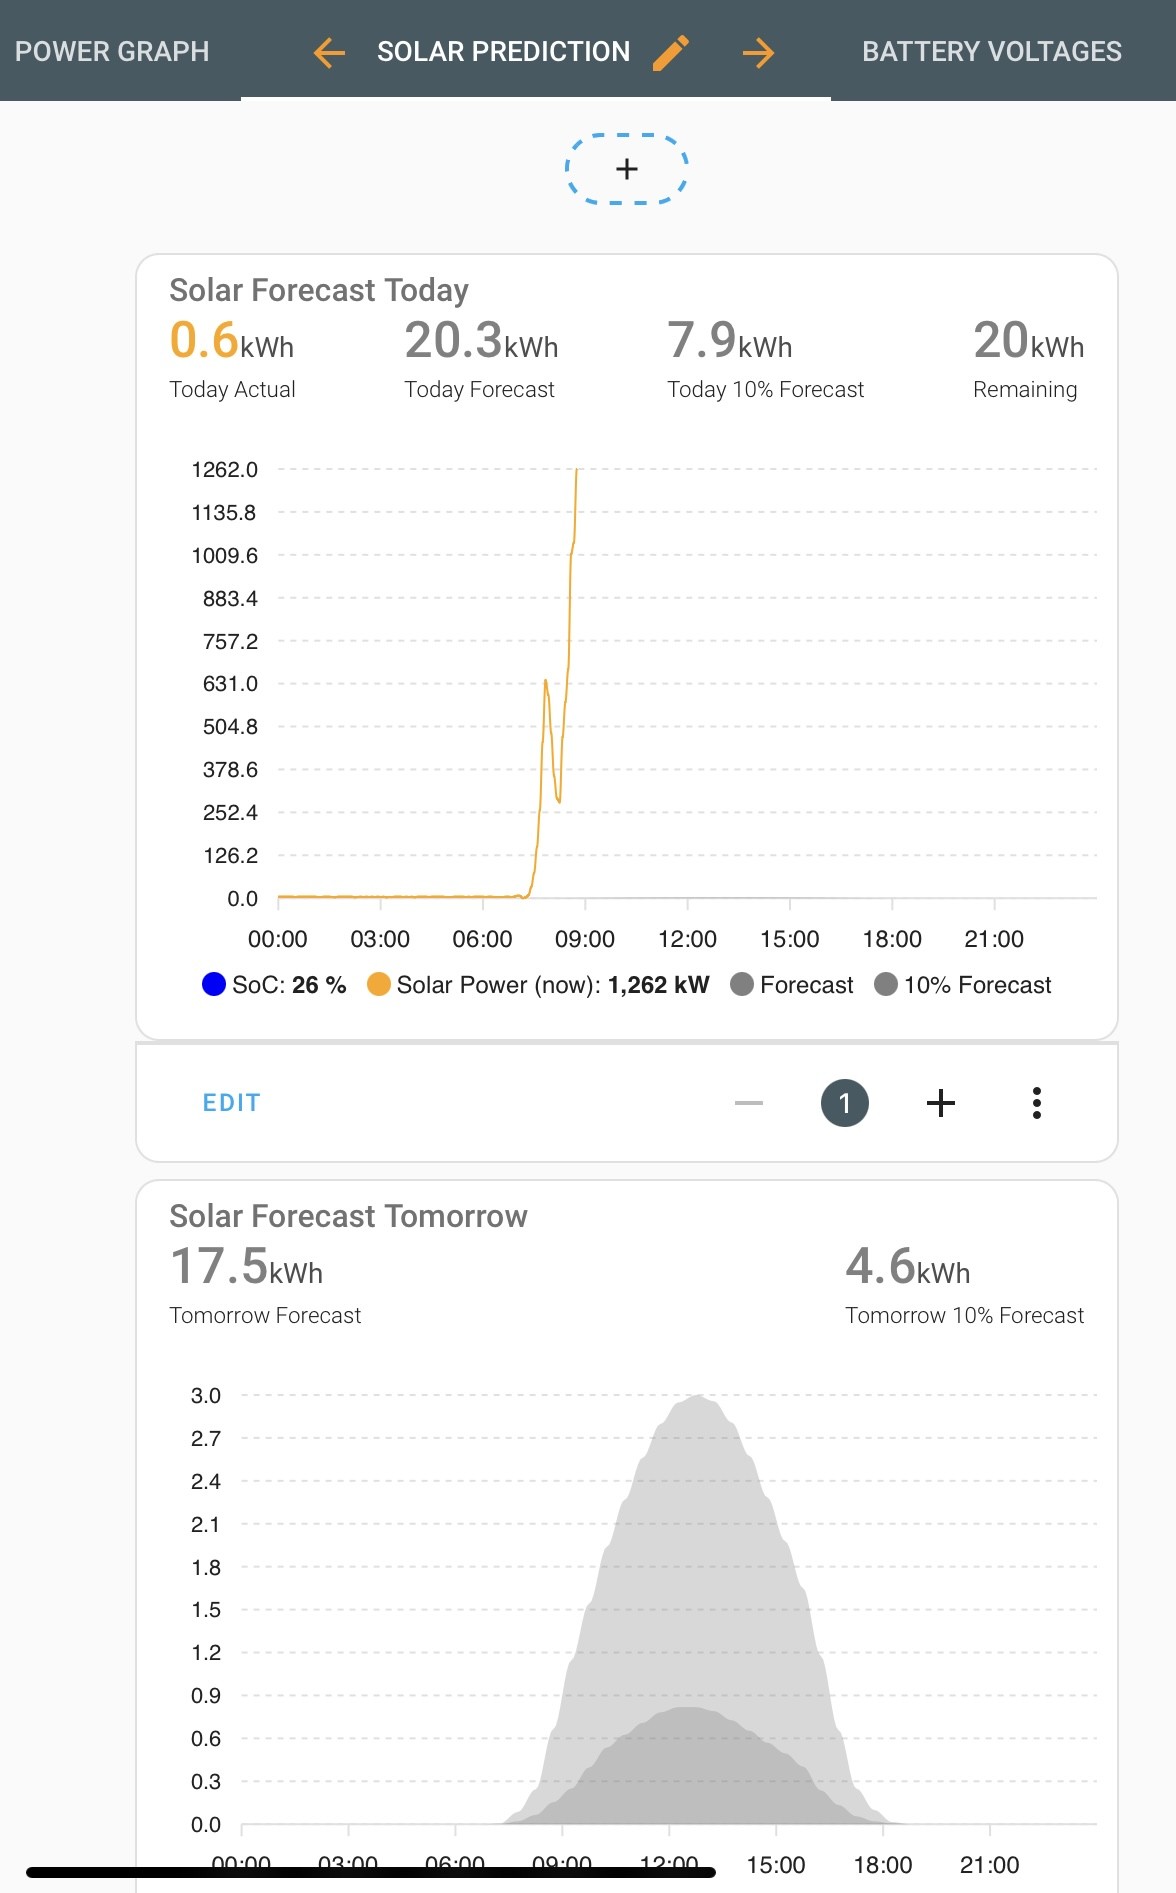
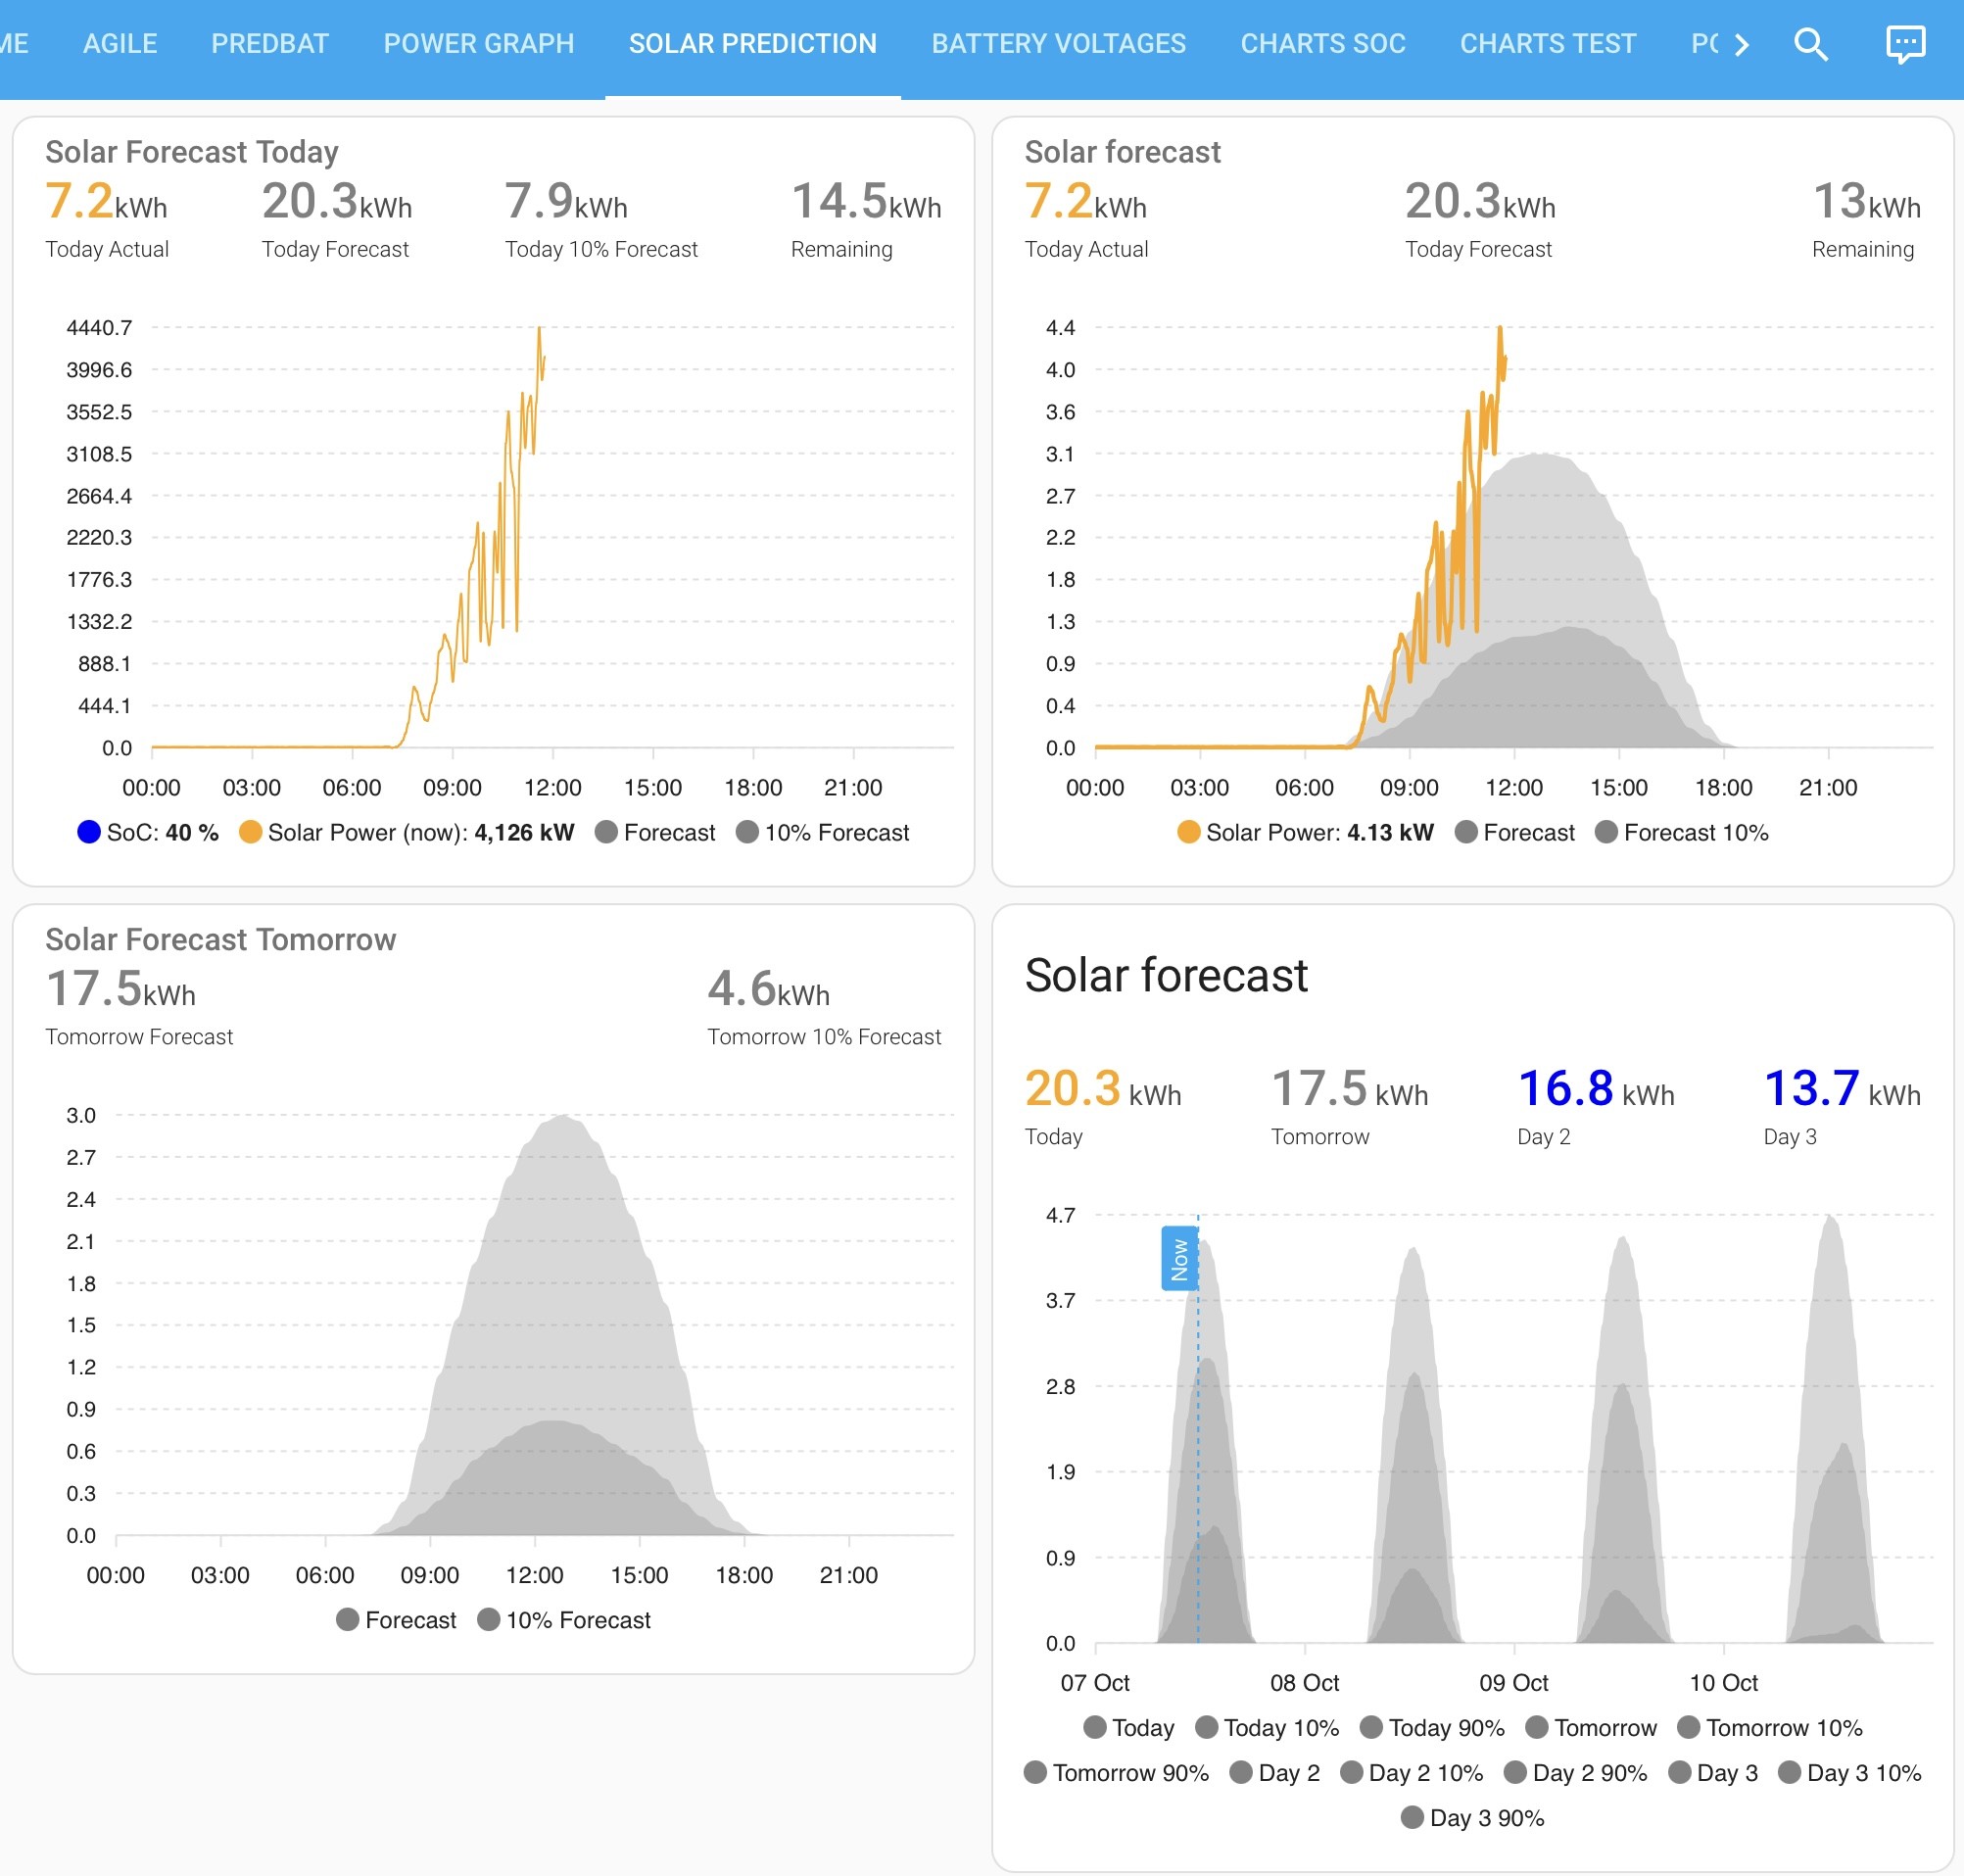
      - type: custom:apexcharts-card
        header:
          title: Solar Forecast Today
          show: true
          show_states: true
          colorize_states: true
        apex_config:
          chart:
            height: 300px
          tooltip:
            enabled: true
            shared: true
            followCursor: true
        graph_span: 24h
        span:
          start: day
        yaxis:
          - id: capacity
            show: false
            opposite: true
            decimals: 0
            max: 100
            min: 0
            apex_config:
              tickAmount: 10
          - id: kWh
            show: true
            min: 0
            apex_config:
              tickAmount: 10
          - id: header_only
            show: false
        series:
          - entity: sensor.g_sd2237g182_soc
            name: G SoC
            yaxis_id: capacity
            color: Blue
            stroke_width: 0
            unit: '%'
            extend_to: now
            show:
              legend_value: true
              in_header: false
          - entity: sensor.h_sd2237g395_soc
            name: H SoC
            yaxis_id: capacity
            color: Red
            stroke_width: 0
            unit: '%'
            extend_to: now
            show:
              legend_value: true
              in_header: false
          - entity: sensor.total_solar_power
            name: Solar Power (now)
            type: line
            stroke_width: 1
            float_precision: 2
            color: Orange
            yaxis_id: kWh
            unit: kW
            extend_to: now
            show:
              legend_value: true
              in_header: false
            group_by:
              func: avg
              duration: 5min
          - entity: sensor.solcast_pv_forecast_today
            name: Forecast
            color: Grey
            opacity: 0.3
            stroke_width: 0
            type: area
            time_delta: +15min
            extend_to: false
            yaxis_id: kWh
            show:
              legend_value: false
              in_header: false
            data_generator: |
              return entity.attributes.detailedForecast.map((entry) => {
                    return [new Date(entry.period_start), entry.pv_estimate];
                  });
          - entity: sensor.solcast_pv_forecast_today
            name: 10% Forecast
            color: Grey
            opacity: 0.3
            stroke_width: 0
            type: area
            time_delta: +15min
            extend_to: false
            yaxis_id: kWh
            show:
              legend_value: false
              in_header: false
            data_generator: |
              return entity.attributes.detailedForecast.map((entry) => {
                    return [new Date(entry.period_start), entry.pv_estimate10];
                  });
          - entity: sensor.sum_solar_energy_today
            yaxis_id: header_only
            name: Today Actual
            stroke_width: 2
            color: Orange
            show:
              legend_value: true
              in_header: true
              in_chart: false
          - entity: sensor.solcast_pv_forecast_today
            yaxis_id: header_only
            name: Today Forecast
            color: Grey
            show:
              legend_value: true
              in_header: true
              in_chart: false
          - entity: sensor.solcast_pv_forecast_today
            attribute: estimate10
            yaxis_id: header_only
            name: Today 10% Forecast
            color: Grey
            show:
              legend_value: true
              in_header: true
              in_chart: false
          - entity: sensor.solcast_pv_forecast_remaining_today
            yaxis_id: header_only
            name: Remaining
            color: Grey
            show:
              legend_value: true
              in_header: true
              in_chart: false
      - type: custom:apexcharts-card
        header:
          title: Solar Forecast Tomorrow
          show: true
          show_states: true
          colorize_states: true
        apex_config:
          chart:
            height: 300px
          tooltip:
            enabled: true
            shared: true
            followCursor: true
        graph_span: 24h
        span:
          start: day
          offset: +1day
        yaxis:
          - id: kWh
            show: true
            min: 0
            apex_config:
              tickAmount: 10
          - id: header_only
            show: false
        series:
          - entity: sensor.solcast_pv_forecast_tomorrow
            name: Forecast
            color: Grey
            opacity: 0.3
            stroke_width: 0
            type: area
            time_delta: +15min
            extend_to: false
            yaxis_id: kWh
            show:
              legend_value: false
              in_header: false
            data_generator: |
              return entity.attributes.detailedForecast.map((entry) => {
                    return [new Date(entry.period_start), entry.pv_estimate];
                  });
          - entity: sensor.solcast_pv_forecast_tomorrow
            name: 10% Forecast
            color: Grey
            opacity: 0.3
            stroke_width: 0
            type: area
            time_delta: +15min
            extend_to: false
            yaxis_id: kWh
            show:
              legend_value: false
              in_header: false
            data_generator: |
              return entity.attributes.detailedForecast.map((entry) => {
                    return [new Date(entry.period_start), entry.pv_estimate10];
                  });
          - entity: sensor.solcast_pv_forecast_tomorrow
            yaxis_id: header_only
            name: Tomorrow Forecast
            color: Grey
            offset: '-1day'
            show:
              legend_value: true
              in_header: true
              in_chart: false
              offset_in_name: false
          - entity: sensor.solcast_pv_forecast_tomorrow
            attribute: estimate10
            yaxis_id: header_only
            name: Tomorrow 10% Forecast
            color: Grey
            opacity: 0.3
            offset: '-1day'
            show:
              legend_value: true
              in_header: true
              in_chart: false
              offset_in_name: false
      - type: custom:apexcharts-card
        header:
          show: true
          title: Home Battery Prediction
          show_states: true
          colorize_states: true
        graph_span: 60h
        span:
          start: minute
          offset: '-12h'
        now:
          show: true
        yaxis:
          - min: 0
            max: 4.5
        series:
          - entity: predbat.soc_kw_h0
            stroke_width: 1
            curve: stepline
            name: actual
            extend_to: now
            show:
              in_header: raw
          - entity: predbat.soc_kw
            stroke_width: 1
            curve: smooth
            name: base
            data_generator: >
              let res = []; for (const [key, value] of
              Object.entries(entity.attributes.results)) { res.push([new
              Date(key).getTime(), value]); } return res.sort((a, b) => { return
              a[0] - b[0]  })
            show:
              in_header: raw
          - entity: predbat.soc_kw_best
            stroke_width: 3
            curve: smooth
            name: best
            data_generator: >
              let res = []; for (const [key, value] of
              Object.entries(entity.attributes.results)) { res.push([new
              Date(key).getTime(), value]); } return res.sort((a, b) => { return
              a[0] - b[0]  })
            show:
              in_header: raw
          - entity: predbat.soc_kw_best10
            stroke_width: 1
            curve: smooth
            name: best10
            data_generator: >
              let res = []; for (const [key, value] of
              Object.entries(entity.attributes.results)) { res.push([new
              Date(key).getTime(), value]); } return res.sort((a, b) => { return
              a[0] - b[0]  })
            show:
              in_header: raw
          - entity: predbat.best_charge_limit_kw
            stroke_width: 4
            curve: stepline
            name: charge_limit_best
            type: area
            opacity: 0.2
            data_generator: >
              let res = []; for (const [key, value] of
              Object.entries(entity.attributes.results)) { res.push([new
              Date(key).getTime(), value]); } return res.sort((a, b) => { return
              a[0] - b[0]  })
            show:
              in_header: raw
          - entity: predbat.charge_limit_kw
            stroke_width: 1
            curve: stepline
            name: charge_limit_base
            data_generator: >
              let res = []; for (const [key, value] of
              Object.entries(entity.attributes.results)) { res.push([new
              Date(key).getTime(), value]); } return res.sort((a, b) => { return
              a[0] - b[0]  })
            show:
              in_header: raw
          - entity: predbat.best_discharge_limit_kw
            stroke_width: 2
            curve: stepline
            name: discharge_best
            data_generator: >
              let res = []; for (const [key, value] of
              Object.entries(entity.attributes.results)) { res.push([new
              Date(key).getTime(), value]); } return res.sort((a, b) => { return
              a[0] - b[0]  })
            show:
              in_header: raw
          - entity: predbat.record
            stroke_width: 3
            curve: stepline
            name: record
            type: area
            opacity: 0.5
            color: black
            data_generator: >
              let res = []; for (const [key, value] of
              Object.entries(entity.attributes.results)) { res.push([new
              Date(key).getTime(), value]); } return res.sort((a, b) => { return
              a[0] - b[0]  })
            show:
              in_header: raw
          - entity: predbat.soc_kw_base10
            stroke_width: 1
            curve: smooth
            name: base10
            data_generator: >
              let res = []; for (const [key, value] of
              Object.entries(entity.attributes.results)) { res.push([new
              Date(key).getTime(), value]); } return res.sort((a, b) => { return
              a[0] - b[0]  })
            show:
              in_header: raw
      - type: custom:apexcharts-card
        header:
          show: true
          title: Home cost prediction
          show_states: true
          colorize_states: true
        graph_span: 48h
        span:
          start: day
          offset: +0h
        now:
          show: true
        series:
          - entity: predbat.metric
            stroke_width: 1
            curve: smooth
            name: base
            data_generator: >
              let res = []; for (const [key, value] of
              Object.entries(entity.attributes.results)) { res.push([new
              Date(key).getTime(), value]); } return res.sort((a, b) => { return
              a[0] - b[0]  })
            show:
              in_header: raw
          - entity: predbat.best_metric
            stroke_width: 2
            curve: smooth
            name: best
            data_generator: >
              let res = []; for (const [key, value] of
              Object.entries(entity.attributes.results)) { res.push([new
              Date(key).getTime(), value]); } return res.sort((a, b) => { return
              a[0] - b[0]  })
            show:
              in_header: raw
          - entity: predbat.best10_metric
            stroke_width: 1
            curve: smooth
            name: best10
            data_generator: >
              let res = []; for (const [key, value] of
              Object.entries(entity.attributes.results)) { res.push([new
              Date(key).getTime(), value]); } return res.sort((a, b) => { return
              a[0] - b[0]  })
            show:
              in_header: raw
          - entity: predbat.cost_today
            stroke_width: 1
            curve: smooth
            name: actual
            extend_to: now
            data_generator: >
              let res = []; for (const [key, value] of
              Object.entries(entity.attributes.results)) { res.push([new
              Date(key).getTime(), value]); } return res.sort((a, b) => { return
              a[0] - b[0]  })
            show:
              in_header: raw
          - entity: predbat.cost_today_import
            stroke_width: 1
            curve: smooth
            name: actual_import
            extend_to: now
            data_generator: >
              let res = []; for (const [key, value] of
              Object.entries(entity.attributes.results)) { res.push([new
              Date(key).getTime(), value]); } return res.sort((a, b) => { return
              a[0] - b[0]  })
            show:
              in_header: raw
          - entity: predbat.cost_today_export
            stroke_width: 1
            curve: smooth
            name: actual_export
            extend_to: now
            data_generator: >
              let res = []; for (const [key, value] of
              Object.entries(entity.attributes.results)) { res.push([new
              Date(key).getTime(), -value]); } return res.sort((a, b) => {
              return a[0] - b[0]  })
            show:
              in_header: raw
          - entity: predbat.base10_metric
            stroke_width: 1
            curve: smooth
            name: base10
            data_generator: >
              let res = []; for (const [key, value] of
              Object.entries(entity.attributes.results)) { res.push([new
              Date(key).getTime(), value]); } return res.sort((a, b) => { return
              a[0] - b[0]  })
            show:
              in_header: raw
      - type: custom:apexcharts-card
        header:
          show: true
          title: Energy rates
          show_states: true
          colorize_states: true
        graph_span: 72h
        span:
          start: day
          offset: +0h
        now:
          show: true
        series:
          - entity: predbat.grid_power_best
            name: power
            stroke_width: 1
            type: area
            opacity: 0.2
            data_generator: >
              let res = []; for (const [key, value] of
              Object.entries(entity.attributes.results)) { res.push([new
              Date(key).getTime(), value*5]); } return res.sort((a, b) => {
              return a[0] - b[0]  })
          - entity: predbat.rates
            attribute: threshold
            name: Low threshold
            curve: stepline
            stroke_width: 2
          - entity: predbat.rates_export
            attribute: threshold
            name: High threshold
            curve: stepline
            stroke_width: 2
          - entity: predbat.rates
            stroke_width: 2
            curve: stepline
            name: import
            data_generator: >
              let res = []; for (const [key, value] of
              Object.entries(entity.attributes.results)) { res.push([new
              Date(key).getTime(), value]); } return res.sort((a, b) => { return
              a[0] - b[0]  })
            show:
              in_header: raw
          - entity: predbat.rates_export
            stroke_width: 1
            type: area
            opacity: 0.2
            curve: stepline
            name: export
            data_generator: >
              let res = []; for (const [key, value] of
              Object.entries(entity.attributes.results)) { res.push([new
              Date(key).getTime(), value]); } return res.sort((a, b) => { return
              a[0] - b[0]  })
            show:
              in_header: raw
      - type: custom:apexcharts-card
        header:
          show: true
          title: Data prediction
          show_states: true
          colorize_states: true
        graph_span: 48h
        span:
          start: minute
          offset: '-1h'
        now:
          show: true
        yaxis:
          - min: 0
        series:
          - entity: predbat.load_energy_h0
            stroke_width: 1
            curve: smooth
            name: load actual
            extend_to: now
          - entity: predbat.import_energy_h0
            stroke_width: 1
            curve: smooth
            name: import actual
            extend_to: now
          - entity: predbat.export_energy_h0
            stroke_width: 1
            curve: smooth
            name: export actual
            extend_to: now
          - entity: predbat.pv_energy_h0
            stroke_width: 1
            curve: smooth
            name: PV actual
            extend_to: now
          - entity: predbat.best_load_energy
            stroke_width: 1
            curve: smooth
            name: load
            show:
              in_header: raw
            data_generator: >
              let res = []; for (const [key, value] of
              Object.entries(entity.attributes.results)) { res.push([new
              Date(key).getTime(), value]); } return res.sort((a, b) => { return
              a[0] - b[0]  })
          - entity: predbat.best_pv_energy
            stroke_width: 1
            curve: smooth
            name: pv
            show:
              in_header: raw
            data_generator: >
              let res = []; for (const [key, value] of
              Object.entries(entity.attributes.results)) { res.push([new
              Date(key).getTime(), value]); } return res.sort((a, b) => { return
              a[0] - b[0]  })
          - entity: predbat.best_pv_energy
            stroke_width: 1
            curve: smooth
            name: PV ZERO
            show:
              in_header: raw
            data_generator: >
              let x=hass.states['predbat.pv_energy_h0'].state; let res = []; for
              (const [key, value] of Object.entries(entity.attributes.results))
              { res.push([new Date(key).getTime(), (value-x)]); } return
              res.sort((a, b) => { return a[0] - b[0]  })
          - entity: predbat.import_energy
            stroke_width: 1
            curve: smooth
            name: import
            show:
              in_header: raw
            data_generator: >
              let res = []; for (const [key, value] of
              Object.entries(entity.attributes.results)) { res.push([new
              Date(key).getTime(), value]); } return res.sort((a, b) => { return
              a[0] - b[0]  })
          - entity: predbat.export_energy
            stroke_width: 1
            curve: smooth
            name: export
            show:
              in_header: raw
            data_generator: >
              let res = []; for (const [key, value] of
              Object.entries(entity.attributes.results)) { res.push([new
              Date(key).getTime(), value]); } return res.sort((a, b) => { return
              a[0] - b[0]  })
          - entity: predbat.best_import_energy
            stroke_width: 1
            curve: smooth
            name: best import
            show:
              in_header: raw
            data_generator: >
              let res = []; for (const [key, value] of
              Object.entries(entity.attributes.results)) { res.push([new
              Date(key).getTime(), value]); } return res.sort((a, b) => { return
              a[0] - b[0]  })
          - entity: predbat.best_export_energy
            stroke_width: 1
            curve: smooth
            name: best export
            show:
              in_header: raw
            data_generator: >
              let res = []; for (const [key, value] of
              Object.entries(entity.attributes.results)) { res.push([new
              Date(key).getTime(), value]); } return res.sort((a, b) => { return
              a[0] - b[0]  })
      - type: custom:apexcharts-card
        header:
          show: true
          title: Power
          show_states: true
          colorize_states: true
        graph_span: 48h
        span:
          start: minute
          offset: '-0h'
        now:
          show: true
        series:
          - entity: predbat.battery_power_best
            stroke_width: 1
            curve: smooth
            name: battery best
            unit: w
            data_generator: >
              let res = []; for (const [key, value] of
              Object.entries(entity.attributes.results)) { res.push([new
              Date(key).getTime(), value*1000.0]); } return res.sort((a, b) => {
              return a[0] - b[0]  })
          - entity: predbat.pv_power_best
            stroke_width: 1
            curve: smooth
            name: pv best
            unit: w
            data_generator: >
              let res = []; for (const [key, value] of
              Object.entries(entity.attributes.results)) { res.push([new
              Date(key).getTime(), value*1000.0]); } return res.sort((a, b) => {
              return a[0] - b[0]  })
          - entity: predbat.grid_power_best
            stroke_width: 1
            curve: smooth
            name: grid best
            unit: w
            data_generator: >
              let res = []; for (const [key, value] of
              Object.entries(entity.attributes.results)) { res.push([new
              Date(key).getTime(), value*1000.0]); } return res.sort((a, b) => {
              return a[0] - b[0]  })
          - entity: predbat.load_power_best
            stroke_width: 1
            curve: smooth
            name: load best
            unit: w
            data_generator: >
              let res = []; for (const [key, value] of
              Object.entries(entity.attributes.results)) { res.push([new
              Date(key).getTime(), value*1000.0]); } return res.sort((a, b) => {
              return a[0] - b[0]  })
      - type: custom:apexcharts-card
        header:
          show: true
          title: Calibration
          show_states: true
          colorize_states: true
        graph_span: 48h
        span:
          start: minute
          offset: '-36h'
        now:
          show: true
        yaxis:
          - min: 0
        series:
          - entity: predbat.soc_kw_h0
            stroke_width: 1
            curve: smooth
            name: actual
            extend_to: now
            show:
              in_header: raw
          - entity: predbat.soc_kw_best_h1
            stroke_width: 1
            curve: smooth
            name: h1
            offset: '-1h'
            show:
              in_header: raw
          - entity: predbat.soc_kw_best_h8
            stroke_width: 1
            curve: smooth
            name: h8
            offset: '-8h'
            show:
              in_header: raw
          - entity: predbat.soc_kw_best_h12
            stroke_width: 1
            curve: smooth
            name: h12
            offset: '-12h'
            show:
              in_header: raw
      - type: custom:apexcharts-card
        header:
          show: true
          title: In day adjustment
          show_states: true
          colorize_states: true
        graph_span: 24h
        span:
          start: day
          offset: '-0h'
        now:
          show: true
        yaxis:
          - min: 0
        series:
          - entity: predbat.load_energy_actual
            stroke_width: 1
            curve: smooth
            name: actual
            data_generator: >
              let res = []; for (const [key, value] of
              Object.entries(entity.attributes.results)) { res.push([new
              Date(key).getTime(), value]); } return res.sort((a, b) => { return
              a[0] - b[0]  })
            show:
              in_header: raw
          - entity: predbat.load_energy_predicted
            stroke_width: 1
            curve: smooth
            name: predicted
            data_generator: >
              let res = []; for (const [key, value] of
              Object.entries(entity.attributes.results)) { res.push([new
              Date(key).getTime(), value]); } return res.sort((a, b) => { return
              a[0] - b[0]  })
            show:
              in_header: raw
          - entity: predbat.load_energy_adjusted
            stroke_width: 1
            curve: smooth
            name: adjusted
            data_generator: >
              let res = []; for (const [key, value] of
              Object.entries(entity.attributes.results)) { res.push([new
              Date(key).getTime(), value]); } return res.sort((a, b) => { return
              a[0] - b[0]  })
            show:
              in_header: raw
      - type: custom:apexcharts-card
        header:
          show: true
          title: Daily Cost Savings
          show_states: true
          colorize_states: true
        graph_span: 7days
        span:
          start: day
          offset: '-6day'
        now:
          show: true
        series:
          - entity: predbat.savings_yesterday_predbat
            stroke_width: 1
            name: saving_predbat
            type: column
            group_by:
              func: last
              duration: 24hours
          - entity: predbat.savings_yesterday_pvbat
            stroke_width: 1
            name: saving_pvbat
            type: column
            group_by:
              func: last
              duration: 1day
          - entity: predbat.cost_yesterday
            stroke_width: 1
            type: column
            name: actual
            group_by:
              func: last
              duration: 1day
      - type: custom:apexcharts-card
        header:
          show: true
          title: Total Cost Saving
          show_states: true
          colorize_states: true
        graph_span: 30days
        span:
          start: day
          offset: '-29days'
        now:
          show: true
        series:
          - entity: predbat.savings_total_predbat
            stroke_width: 1
            curve: smooth
            name: Predbat saving
            attribute: pounds
            unit: £
          - entity: predbat.savings_total_pvbat
            stroke_width: 1
            curve: smooth
            name: PV/Battery saving
            attribute: pounds
            unit: £
  - title: System Monitor
    path: system-monitor
    icon: mdi:desktop-classic
    type: custom:grid-layout
    cards:
      - type: horizontal-stack
        cards:
          - type: vertical-stack
            cards:
              - type: custom:mushroom-entity-card
                entity: sensor.system_monitor_disk_usage
                name: Disk Utilisation
              - type: custom:mushroom-entity-card
                entity: sensor.system_monitor_memory_usage
                name: Memory Utilisation
              - type: custom:mushroom-entity-card
                entity: sensor.system_monitor_processor_use
                name: Processor Utilisation
              - type: custom:mushroom-entity-card
                entity: sensor.system_monitor_last_boot
                name: HA last booted
          - type: custom:mini-graph-card
            hours_to_show: 1
            points_per_hour: 720
            line_width: 1
            height: 150
            show:
              state: true
              title: false
              labels: true
            entities:
              - sensor.system_monitor_load_1m
              - sensor.system_monitor_load_5m
              - sensor.system_monitor_load_15m
      - type: horizontal-stack
        cards:
          - type: custom:mini-graph-card
            hours_to_show: 1
            points_per_hour: 720
            line_width: 1
            height: 150
            show:
              state: true
              title: false
              labels: true
            entities:
              - sensor.studio_code_server_cpu_percent
              - sensor.appdaemon_cpu_percent
          - type: custom:mini-graph-card
            hours_to_show: 1
            points_per_hour: 720
            line_width: 1
            height: 150
            show:
              state: true
              title: false
              labels: true
            entities:
              - sensor.studio_code_server_memory_percent
              - sensor.appdaemon_memory_percent
  - title: Horse Shed
    path: horse-shed
    icon: mdi:horse
    type: custom:grid-layout
    badges: []
    cards:
      - type: horizontal-stack
        cards:
          - type: entity
            entity: switch.horse_shed_heater
            state_color: true
            name: Heater
          - type: entity
            entity: sensor.horse_shed_temperature
            name: Temperature
          - type: entities
            entities:
              - entity: sensor.horse_shed_heater_power
                name: Current Power
              - entity: sensor.horse_shed_heater_energy_today
                name: Energy Today
          - type: entity
            entity: sensor.horse_shed_th_battery
            name: T&H Battery
      - type: history-graph
        entities:
          - entity: sun.sun
          - entity: sensor.horse_shed_temperature
          - entity: switch.horse_shed_heater
          - entity: sensor.horse_shed_heater_energy_today
        title: Horse Shed
        hours_to_show: 10
  - title: power graph
    path: power-graph
    type: custom:grid-layout
    badges: []
    cards:
      - type: custom:apexcharts-card
        experimental:
          color_threshold: true
        header:
          show: false
          floating: false
          title: 'G: Last 24h'
        graph_span: 24h
        show:
          last_updated: true
          loading: true
        apex_config:
          chart:
            zoom:
              type: x
              enabled: true
              autoScaleYaxis: false
            toolbar:
              show: true
              autoSelected: zoom
            xaxis.type: datetime
        series:
          - entity: sensor.g_sd2237g182_grid_power
            type: area
            name: Grid
            yaxis_id: power
            color: EA3546
            group_by:
              func: last
              duration: 5m
            stroke_width: 2
            extend_to: now
            show:
              extremas: false
              header_color_threshold: true
          - entity: sensor.g_sd2237g182_battery_power
            type: area
            name: Battery
            yaxis_id: power
            color: darkblue
            group_by:
              func: last
              duration: 5m
            stroke_width: 2
            extend_to: now
            show:
              extremas: false
              header_color_threshold: true
          - entity: sensor.g_sd2237g182_pv_power
            type: area
            name: PV
            yaxis_id: power
            group_by:
              func: last
              duration: 5m
            color: f9ce1d
            stroke_width: 2
            extend_to: now
          - entity: sensor.g_sd2237g182_load_power
            type: area
            name: Load
            yaxis_id: power
            group_by:
              func: last
              duration: 5m
            color: 1B998B
            stroke_width: 2
            extend_to: now
          - entity: sensor.g_sd2237g182_soc
            type: line
            name: SoC
            yaxis_id: soc
            color: 3f51b5
            group_by:
              func: last
              duration: 5m
            stroke_width: 1
            extend_to: now
            show:
              extremas: false
              header_color_threshold: true
        yaxis:
          - id: power
            align_to: 0.5
            min: ~-5
            max: ~5
            apex_config:
              tickAmount: 6
          - id: soc
            min: 0
            max: 100
            opposite: true
            apex_config:
              tickAmount: 4
      - type: custom:apexcharts-card
        experimental:
          color_threshold: true
        header:
          show: false
          floating: false
          title: Last 24h
        graph_span: 24h
        show:
          last_updated: true
          loading: true
        apex_config:
          chart:
            zoom:
              type: x
              enabled: true
              autoScaleYaxis: false
            toolbar:
              show: true
              autoSelected: zoom
            xaxis.type: datetime
        series:
          - entity: sensor.h_sd2237g395_grid_power
            type: area
            name: Grid
            yaxis_id: power
            color: EA3546
            group_by:
              func: last
              duration: 5m
            stroke_width: 2
            extend_to: now
            show:
              extremas: false
              header_color_threshold: true
          - entity: sensor.h_sd2237g395_battery_power
            type: area
            name: Battery
            yaxis_id: power
            color: darkblue
            group_by:
              func: last
              duration: 5m
            stroke_width: 2
            extend_to: now
            show:
              extremas: false
              header_color_threshold: true
          - entity: sensor.h_sd2237g395_pv_power
            type: area
            name: PV
            yaxis_id: power
            group_by:
              func: last
              duration: 5m
            color: f9ce1d
            stroke_width: 2
            extend_to: now
          - entity: sensor.h_sd2237g395_load_power
            type: area
            name: Load
            yaxis_id: power
            group_by:
              func: last
              duration: 5m
            color: 1B998B
            stroke_width: 2
            extend_to: now
          - entity: sensor.h_sd2237g395_soc
            type: line
            name: SoC
            yaxis_id: soc
            color: 3f51b5
            group_by:
              func: last
              duration: 5m
            stroke_width: 1
            extend_to: now
            show:
              extremas: false
              header_color_threshold: true
        yaxis:
          - id: power
            align_to: 0.5
            min: ~-5
            max: ~5
            apex_config:
              tickAmount: 6
          - id: soc
            min: 0
            max: 100
            opposite: true
            apex_config:
              tickAmount: 4
  - title: Battery voltages
    path: battery-voltages
    type: sections
    max_columns: 2
    sections:
      - type: grid
        cards:
          - type: entities
            entities:
              - sensor.g_dx2327g139_battery_cell_1_voltage
              - sensor.g_dx2327g139_battery_cell_2_voltage
              - sensor.g_dx2327g139_battery_cell_3_voltage
              - sensor.g_dx2327g139_battery_cell_4_voltage
              - sensor.g_dx2327g139_battery_cell_5_voltage
              - sensor.g_dx2327g139_battery_cell_6_voltage
              - sensor.g_dx2327g139_battery_cell_7_voltage
              - sensor.g_dx2327g139_battery_cell_8_voltage
              - sensor.g_dx2327g139_battery_cell_9_voltage
              - sensor.g_dx2327g139_battery_cell_10_voltage
              - sensor.g_dx2327g139_battery_cell_11_voltage
              - sensor.g_dx2327g139_battery_cell_12_voltage
              - sensor.g_dx2327g139_battery_cell_13_voltage
              - sensor.g_dx2327g139_battery_cell_14_voltage
              - sensor.g_dx2327g139_battery_cell_15_voltage
              - sensor.g_dx2327g139_battery_cell_16_voltage
          - type: history-graph
            entities:
              - sensor.g_dx2327g139_battery_cell_1_voltage
              - sensor.g_dx2327g139_battery_cell_2_voltage
              - sensor.g_dx2327g139_battery_cell_3_voltage
              - sensor.g_dx2327g139_battery_cell_4_voltage
              - sensor.g_dx2327g139_battery_cell_5_voltage
              - sensor.g_dx2327g139_battery_cell_6_voltage
              - sensor.g_dx2327g139_battery_cell_7_voltage
              - sensor.g_dx2327g139_battery_cell_8_voltage
              - sensor.g_dx2327g139_battery_cell_9_voltage
              - sensor.g_dx2327g139_battery_cell_10_voltage
              - sensor.g_dx2327g139_battery_cell_11_voltage
              - sensor.g_dx2327g139_battery_cell_12_voltage
              - sensor.g_dx2327g139_battery_cell_13_voltage
              - sensor.g_dx2327g139_battery_cell_14_voltage
              - sensor.g_dx2327g139_battery_cell_15_voltage
              - sensor.g_dx2327g139_battery_cell_16_voltage
            hours_to_show: 18
          - chart_type: line
            period: 5minute
            type: statistics-graph
            entities:
              - sensor.g_dx2327g139_battery_cell_1_voltage
              - sensor.g_dx2327g139_battery_cell_2_voltage
              - sensor.g_dx2327g139_battery_cell_3_voltage
              - sensor.g_dx2327g139_battery_cell_4_voltage
              - sensor.g_dx2327g139_battery_cell_5_voltage
              - sensor.g_dx2327g139_battery_cell_6_voltage
              - sensor.g_dx2327g139_battery_cell_7_voltage
              - sensor.g_dx2327g139_battery_cell_8_voltage
              - sensor.g_dx2327g139_battery_cell_9_voltage
              - sensor.g_dx2327g139_battery_cell_10_voltage
              - sensor.g_dx2327g139_battery_cell_11_voltage
              - sensor.g_dx2327g139_battery_cell_12_voltage
              - sensor.g_dx2327g139_battery_cell_13_voltage
              - sensor.g_dx2327g139_battery_cell_14_voltage
              - sensor.g_dx2327g139_battery_cell_15_voltage
              - sensor.g_dx2327g139_battery_cell_16_voltage
            stat_types:
              - max
            hide_legend: true
      - type: grid
        cards:
          - type: entities
            entities:
              - sensor.h_bj2238g271_battery_cell_1_voltage
              - sensor.h_bj2238g271_battery_cell_2_voltage
              - sensor.h_bj2238g271_battery_cell_3_voltage
              - sensor.h_bj2238g271_battery_cell_4_voltage
              - sensor.h_bj2238g271_battery_cell_5_voltage
              - sensor.h_bj2238g271_battery_cell_6_voltage
              - sensor.h_bj2238g271_battery_cell_7_voltage
              - sensor.h_bj2238g271_battery_cell_8_voltage
              - sensor.h_bj2238g271_battery_cell_9_voltage
              - sensor.h_bj2238g271_battery_cell_10_voltage
              - sensor.h_bj2238g271_battery_cell_11_voltage
              - sensor.h_bj2238g271_battery_cell_12_voltage
              - sensor.h_bj2238g271_battery_cell_13_voltage
              - sensor.h_bj2238g271_battery_cell_14_voltage
              - sensor.h_bj2238g271_battery_cell_15_voltage
              - sensor.h_bj2238g271_battery_cell_16_voltage
          - type: history-graph
            entities:
              - sensor.h_bj2238g271_battery_cell_1_voltage
              - sensor.h_bj2238g271_battery_cell_2_voltage
              - sensor.h_bj2238g271_battery_cell_3_voltage
              - sensor.h_bj2238g271_battery_cell_4_voltage
              - sensor.h_bj2238g271_battery_cell_5_voltage
              - sensor.h_bj2238g271_battery_cell_6_voltage
              - sensor.h_bj2238g271_battery_cell_7_voltage
              - sensor.h_bj2238g271_battery_cell_8_voltage
              - sensor.h_bj2238g271_battery_cell_9_voltage
              - sensor.h_bj2238g271_battery_cell_10_voltage
              - sensor.h_bj2238g271_battery_cell_11_voltage
              - sensor.h_bj2238g271_battery_cell_12_voltage
              - sensor.h_bj2238g271_battery_cell_13_voltage
              - sensor.h_bj2238g271_battery_cell_14_voltage
              - sensor.h_bj2238g271_battery_cell_15_voltage
              - sensor.h_bj2238g271_battery_cell_16_voltage
          - chart_type: line
            period: 5minute
            type: statistics-graph
            entities:
              - sensor.h_bj2238g271_battery_cell_1_voltage
              - sensor.h_bj2238g271_battery_cell_2_voltage
              - sensor.h_bj2238g271_battery_cell_3_voltage
              - sensor.h_bj2238g271_battery_cell_4_voltage
              - sensor.h_bj2238g271_battery_cell_5_voltage
              - sensor.h_bj2238g271_battery_cell_6_voltage
              - sensor.h_bj2238g271_battery_cell_7_voltage
              - sensor.h_bj2238g271_battery_cell_8_voltage
              - sensor.h_bj2238g271_battery_cell_9_voltage
              - sensor.h_bj2238g271_battery_cell_10_voltage
              - sensor.h_bj2238g271_battery_cell_11_voltage
              - sensor.h_bj2238g271_battery_cell_12_voltage
              - sensor.h_bj2238g271_battery_cell_13_voltage
              - sensor.h_bj2238g271_battery_cell_14_voltage
              - sensor.h_bj2238g271_battery_cell_15_voltage
              - sensor.h_bj2238g271_battery_cell_16_voltage
            stat_types:
              - max
              - min
            hide_legend: true

#40 PianSom

FWIW the top part of my landing page -

G
#41 geoffreycoan

Screenshots:

Home:


Power:

Agile:

Predbat config:

Temps are a load of temperature monitors around the house

Soc history is the soc history graphs and other useful graphs

Powerup is to handle the Octopus free electricity and powerup events

Charts are the Predbat charts - the top 3 are the most useful (greenness index and solar actual vs forecast):

System Monitor is CPU and memory monitor for HA

Horse shed is the temperature controlled automatic heating in my wife's horse shed

Power Graph is as per the GE dashboard

Battery voltages are trend graphs for my battery cell voltages

D
#42 Daveb01

PianSom

Hi yah, I have been messing about with the Dashboard all day and have not got very far. This is mainly due to what Entirety I need to add to get the correct setting. The other issue is I have 2 x AIO and I have to use the GW. When I click Entirty I have about 300 items to chose from and each time it’s not right I have to start again.

Can you tell me what you have set for the Power Flow chart please?

I am doing a compare to see what one I like:- Plus or GivTCP

D
#43 Daveb01

geoffreycoan

This looks very impressive and I like the layout. So starting from the top I have made a start but do not know how to get the other ones at the top. What cards are they? Are the custome ones or ones already in the repository?

Yours

Mine (so far)

#44 PianSom

Daveb01
Here's what I use atm -

type: custom:power-flow-card-plus
entities:
  battery:
    entity: sensor.givtcp_XXXXXX_battery_power
    state_of_charge: sensor.givtcp_XXXXXX_soc
    display_state: one_way
    color_icon: true
    color_circle: true
    color_value: false
  grid:
    entity: sensor.givtcp_XXXXXX_grid_power
    invert_state: true
    display_state: one_way
    color_icon: true
    color_circle: true
    use_metadata: false
    color_value: false
    display_zero_tolerance: 25
  solar:
    entity: sensor.givtcp_XXXXXX_pv_power_string_1
    display_zero_state: true
    icon: mdi:solar-panel-large
    color_icon: true
    color_value: false
    display_zero_tolerance: 0
  home:
    color_icon: true
clickable_entities: true
display_zero_lines:
  mode: transparency
  transparency: 90
  grey_color:
    - 189
    - 189
    - 189
use_new_flow_rate_model: true
w_decimals: 0
kw_decimals: 1
min_flow_rate: 0.25
max_flow_rate: 5
max_expected_power: 6000
min_expected_power: 0.01
transparency_zero_lines: 0
disable_dots: false
dashboard_link: /energy
watt_threshold: 0

Docs - https://github.com/flixlix/power-flow-card-plus

D
#45 Daveb01

I like the Power Flow charts but prefer the Plus version but would like to add GAS and EPS, is this possible please?

Plus I do not know what to pick for the SOC

#46 PianSom

Searching in the HA Settings / Device & Services / Entities tab for "battery_power", "grid_power" and "pv_power" should limit your choices to useful things which you can try out

G
#47 geoffreycoan

Daveb01 I like the Power Flow charts but prefer the Plus version but would like to add GAS and EPS, is this possible please?

I too prefer the power flow plus card. As well as the main home/solar/grid/battery you can have up to 4 different individual devices. I have my extension power (via a Shelly EM CT clamp) and my ASHP power (also a CT clamp). You can add your EPS by just finding the right sensor name in entities as @PianSom says. Gas I doubt you will be able to include; the power flows show live real-time power flowing in your home so unless you have a way of reading your gas meter in real time then its not going to work [the Octopus Home Mini might do this, it does for my electric import but I don't know about gas].

Here's the fragment of the PF+ card for individual devices:

          individual:
            - entity: sensor.extension_power
              name: Extension
              icon: mdi:home-outline
              color: red
              display_zero_tolerance: 50
            - entity: sensor.ashp_power
              name: ASHP
              icon: mdi:heat-pump-outline
              color: '#9007DD'
              display_zero_tolerance: 50

Daveb01 This looks very impressive and I like the layout. So starting from the top I have made a start but do not know how to get the other ones at the top. What cards are they? Are the custome ones or ones already in the repository?

The dashboard uses the grid layout which is a custom layout type https://github.com/thomasloven/lovelace-layout-card and then uses a vertical stack to align everything and horizontal stack for each line.
Home Assistant now has a sections view which is much more powerful but is still experimental and improved each and every release of HA. Its just not promoted to mainstream so I haven't swapped over to it yet, but if I was building a new dashboard I would start with it.

The top big boxes are just entity cards, one card per entity on the top row.
Then underneath the 'predicted hours, predbat status' etc are two more entity cards, together on a horizontal row, but for each entity card there are several entities on it.

Beneath the power flows are my 'control' entities for the inverter, the key controls I check what predbat is doing and can change if I put predbat into read only and want to override the inverter - very similar to the quick actions in the givenergy app, just lower level of control.
These too are entity cards, only addition is a fold entity row https://github.com/thomasloven/lovelace-fold-entity-row about half way down that enables me to collapse the less frequently used controls away in a 'show more' section

#48 PianSom

geoffreycoan [the Octopus Home Mini might do this, it does for my electric import but I don't know about gas].

Neither the OHMini nor the OHPro nor the Hildebrand Glow give live gas pricing - a limitation of the metering, I believe. Takes at least 30 mins to arrive, I think.

As a result, I tend to look at the Energy dashboard for the slightly delayed flows. That’s why I link to it at the bottom of the Power Flow Plus card (with the dashboard_link option)

R
#49 Rbor

Daveb01 You can learn a lot about finding an entity ID by searching like this

There's a lot of different ways of getting the info out of HA and I probably use a different way each time as I learn more.
In the dashboard, select the pencil and then EDIT bottom right of the bit you want to add code 2, Select 'Code Editor' and copy in the YAML. The number XXXXX is your inverter code. Then save and you shoudl have a nice visual power flow image.


This code should work using your inverter number.
You should just be able to copy it in. (When I type, I have ``` either side of the code so that you can copy it in.)
I think the code was provided to me by geoffreycoan

type: custom:power-flow-card-plus
entities:
  battery:
    entity: sensor.givtcp_ce2218g352_battery_power
    state_of_charge: sensor.givtcp_ce2218g352_soc
    display_state: one_way
  grid:
    entity: sensor.givtcp_ce2218g352_grid_power
    invert_state: true
    use_metadata: false
  solar:
    entity: sensor.givtcp_ce2218g352_pv_power
    display_zero_state: true
  clickable_entities: true
  display_zero_lines:
    mode: show
    transparency: 50
    grey_color:
      - 189
      - 189
      - 189
  use_new_flow_rate_model: true
  w_decimals: 0
  kw_decimals: 1
  min_flow_rate: 0.75
  max_flow_rate: 10
  max_expected_power: 2600
  min_expected_power: 0.01
  watt_threshold: 1000
  transparency_zero_lines: 0
  title: PowerFlow+

Experiment, learn and you will soon be able to pass on your own tricks to us all.

Hope this helps.

Rob

D
#50 Daveb01

Thank you so much guys, I have learned a lot. As I have 2 x AIO some of the Entities work but don’t produce the correct values/numbers. This is why it’s taking so long, I but in an entity then have to check octopus app or SolarEdge app etc to see it is the same.

I think I have got it going now, just needed solar today to compare. I have had to go from GivTCP back to SolarEdge. I have also found a Gas setting that works, it’s either the meter from Octopus Mini or Octopus?


Can not get EPS working (yet) these are the only ones that come up (more homework needed)
I get no circle, and no reading. EPS I think comes from the GW not the AIO’s. I can select EPS in the GivTCP Dashboard, so will see if there is any code there to point me in the right direction.

G
#51 geoffreycoan

@Daveb01 You can always look at the entity history by either clicking on the entity in devices & services / entities (as searched above), or by using the history graph (left hand column) and selecting the entities to graph.

It looks from your screenshot that you have the old entity names prefixed givtcpX`_ as well as your new named ones AIO1_ etc. The givtcp ones are showing as unavailable (in lighter grey in the dropdown list) so you want to tidy those up as it’s cluttering things up for finding sensors and in the entity lists.

You may be able to just delete them by clicking on the entity from the entities list, cog top right corner, then delete, or (I suspect) that as these are created by MQTT then HA won’t let you delete them directly and you will have to use the MQTT Explorer add-on to delete them - instructions for installing this and deleting entities given earlier in this thread.

I would have thought the EPS entities come from the gateway. AIO entities will be just the individual AIO parts that the gateway then combines

D
#52 Daveb01

geoffreycoan

Hi Geoffrey, I pasted in your code above on a new Dashboard (Test) and it did not do much expected (until I edited the code with my S/N etc. however I did the easiest one first but got an error (see pic). Now you have said you installed a custom Dashboard do you think this error is because of this?

If I install the custom one as you have linked to, will it get yours working so I can use the code?

D
#53 Daveb01

geoffreycoan

Your right I have loads

G
#54 geoffreycoan

Daveb01 got an error (see pic). Now you have said you installed a custom Dashboard do you think this error is because of this?

If I install the custom one as you have linked to, will it get yours working so I can use the code?

yes the error you are seeing is because the grid layout card type isn’t recognised by Home Assistant. Install it via HACS and you should then be able to use my dashboard (once you change the entity ids). You’ll probably find other custom cards I have used like the weather forecast and the bar charts that are missing, so I can find those if/when you need them.

Daveb01 Your right I have loads

It’s not going to cause HA to stop working, but is confusing to try to finding entities when you have old duplicates, so suggest you do try removing the ones you don’t need that are appearing with a red status as you showed above.
Take a backup first !

D
#55 Daveb01

geoffreycoan

Wow that took over an hour all done 😀👍 (the reason it took so long was each AIO has settings, each AIO has 4 batteries which have settings, each battery has settings x 2 AIO’s)

All sorted and a backup done before and after.

So one for the documentation or note to all, when setting up GivTCP (put the name you would like don’t leave it, go back and change it in step 1 of the configuration.

“Friendly Name of Device”

G
#56 geoffreycoan

Daveb01 So one for the documentation or note to all, when setting up GivTCP (put the name you would like don’t leave it, go back and change it in step 1 of the configuration.

I’ll put it in the documentation now that I’ve written the GivTCP and MQTT install instructions, it fits well in there

D
#57 Daveb01

Thank you all for your advice and help today 👍🍺

I have backed up, deleted all the old stuff on GivTCP and MQTT, checked the devices and no errors.
I have got the Flow chart in a good state and checked the data is the same in my apps e.g SolarEdge, Octopus, GE.
I am now ready to add some more Dashboard items.

G
#58 geoffreycoan

Daveb01 excellent. I personally turned some of the options on the givtcp battery card off, I wasn’t really interested in max charge rate and the ‘so far today’ figures, but personal choice.

On my ‘home’ screen I then have a number of the GivTCP control entities so I can see what they are doing, and if I want to, I can tweak them (after setting predbat to read only mode to stop it overwriting them in the next 5 minute run!). It’s useful to include them even if you don’t ever want to change them directly because it helps you understand what Predbat is instructing the inverter to do. Having said that, maybe a more advanced topic!

Another view of what’s happening that I find useful is the bar graphs, showing individually for my inverters, grid and solar what is flowing where https://community.givenergy.cloud/d/4996-basic-config-of-predbat-after-staring-from-scratch/41 which uses this HACS bar chart component https://github.com/custom-cards/bar-card

Over time I have added more energy monitors to the house with Shelly EM CT clamps to measure certain circuits and My LocaL Bytes smart plugs for individual appliances. A couple of Shelly PM’s as well now to monitor other circuits.
Even without these, the bar graphs are a different way to see things from the power flow card.

One thing I have done is standardise my energy and power monitors on kW/kWh units rather than the default Watts/Watt hours. I just think it’s easier to read, but again personal choice. You can change this under each individual entity configuration

D
#59 Daveb01

geoffreycoan

The dashboard uses the grid layout which is a custom layout type https://github.com/thomasloven/lovelace-layout-card and then uses a vertical stack to align everything and horizontal stack for each line.

Home Assistant now has a sections view which is much more powerful but is still experimental and improved each and every release of HA. It’s just not promoted to mainstream so I haven't swapped over to it yet, but if I was building a new dashboard I would start with it. I am using this for my sections

The top big boxes are just entity cards, one card per entity on the top row.
Then underneath the 'predicted hours, predbat status' etc are two more entity cards, together on a horizontal row, but for each entity card there are several entities on it.

Beneath the power flows are my 'control' entities for the inverter, the key controls I check what predbat is doing and can change if I put predbat into read only and want to override the inverter - very similar to the quick actions in the givenergy app, just lower level of control.
These too are entity cards, only addition is a fold entity row https://github.com/thomasloven/lovelace-fold-entity-row about half way down that enables me to collapse the less frequently used controls away in a 'show more' section not done this yet either

Reference the above, I am finding it difficult to install the Lovelace things as the install instructions are not clear to me at the moment.

I have managed to get the hang of the first three boxes “Entity” Card, so now down to Inverter Control, Weather & Solar Forcast. Are these Entity or Entities card as just noticed there are 2?

The second question is about the Horizontal Stack & Vertical stack cards. Do I add then at any time and configure or do they need to be added at the start of the Dashboard config?

G
#60 geoffreycoan

Daveb01 Reference the above, I am finding it difficult to install the Lovelace things as the install instructions are not clear to me at the moment

the install instructions are indeed confusing and seem to guide you in a convoluted (maybe old) way to install it.

Simply install the same as any other HACS component. Search for the component in hacs, click on it, then ‘download’ in the bottom right corner then refresh the browser window

D
#61 Daveb01

Went to The Met Office and saw they are not doing the api for new users, there going to sunset the project. 🙁☔️

G
#62 geoffreycoan

Daveb01 Oh that’s a pain, I didn’t know that https://www.metoffice.gov.uk/services/data/datapoint/datapoint-retirement-faqs

Looks like I’ve got another 6 months of the current service and then will have to change to another provider. I liked the trust value of Met Office but it only provides forecast to 3 hour granularity and I wanted hourly forecasts. Met Office also doesn’t provide rain level forecasts, only rain probability.

I have accuweather installed (loads and loads of sensors including rain level forecast, but only a single daily forecast) and met.no installed (hourly forecasts for temperature only, 3 hourly forecasts for the rest of the weather, rain probability and amount of rain). Met.no is probably the nearest equivalent for me but there are other forecasting engines around for HA

D
#64 Daveb01

geoffreycoan

I have sorted the cards now except the collapsible card, where can I find this please?

G
#65 geoffreycoan

Daveb01 I have sorted the cards now except the collapsible card, where can I find this please?

Collapsible cards are here https://github.com/RossMcMillan92/lovelace-collapsable-cards and install instructions are covered in the predbat documentation for ‘setting up a simple control dashboard’ https://springfall2008.github.io/batpred/output-data/#creating-a-compact-predbat-control-dashboard

Do have a look at the instructions and code wot I wrote for checking that givtcp and predbat are running and raise an alert if they aren’t https://springfall2008.github.io/batpred/output-data/#automated-monitoring-that-predbat-and-givtcp-are-running-ok

D
#66 Daveb01

geoffreycoan

Thanks for the heads up, I have had to update the app.yaml. It had givtcp_ as default, as I changed mine to gw, AIO-1 & AIO-2 the lines went red. I was going to ping you, but worked it out, change GivTCP to gw_xxxxxxx (my s/n).

You may want to put a note, if you change the GivTCP setup name, update Predbat as well. This would be only for ultra beginners like me, you experts would have spotted it 😀. Plus it does say in the Predbat docs ensure this matches, which it did, when I first set it up, but no mention to change it if you change something else, I am a bit slow in putting tow and tow together.

What I have been doing is: add the card to your Dashboard, if it resolves the issue move it to my Home-Test Dashboard. If it does not, edit and look at yaml. If I can not resolve it I will come back here. The home is proving to be the hardest one to sort.

G
#67 geoffreycoan

Daveb01 sounds like you are making progress and learning lots. As you have discovered, you have to keep apps.yaml in sync with your GivTCP setup so if you change the sensor names then apps.yaml will need tweaking.

For a lot of my sensors I have changed the display names and some of my sensors I have changed the actual sensor names as well. I felt I didn’t need to see the serial numbers of my inverters so prominently on my dashboards. Of course if you do change sensor names you’ll need to change apps.yaml to match. The watchdog integration is useful for spotting inconsistencies in your setup.

D
#68 Daveb01

geoffreycoan

I can find Watchdog dev is that it via (Hass.io)?

D
#69 Daveb01

I have looked at my plan for the first time and it seems weird that it is exporting for so long? 2 x AIO exporting at 12000 kWh (empty in 2.5 hrs)

I would normally export for say 2 hrs before the minus import (blue) then charge the battery and export at 15p during the day if there is sun. It also seems to be importing at the higher rate later on ?


G
#70 geoffreycoan

Daveb01 I can find Watchdog dev is that it via (Hass.io)?

Sorry I meant watchman which I think you already have installed from HACS https://github.com/dummylabs/thewatchman

Daveb01 I have looked at my plan for the first time and it seems weird that it is exporting for so long? 2 x AIO exporting at 12000 kWh (empty in 2.5 hrs)

Have a read of the documentation on the Predbat plan to help you understand what it is showing you https://springfall2008.github.io/batpred/predbat-plan-card/

But in short, it’s not showing any forced exporting or importing at all, it shows the battery naturally falling and rising in line with house load and solar. I would guess Predbat is in Monitor mode, you might want to change that https://springfall2008.github.io/batpred/what-does-predbat-do/#predbat-modes but its all covered step by step in the installation guide.

D
#71 Daveb01

geoffreycoan

Doh stupid me, yes it’s in Monitor mode as still working on Dashboard. So the plan is correct 👍. Not ready to switch over yet. Still lots to do and understand, reading and getting the right sensors, integrations in the right cards.

I have also learned to leave things and try not to fix everything that comes up, e.g after a reboot, a few errors (red), woke up this morning and no errors in Predbat at all.

The only log with an issue is MQTT, I keep getting this

G
#72 geoffreycoan

Daveb01 The only log with an issue is MQTT, I keep getting this

That’s perfectly normal, mine does the same. It seems that GivTCP doesn’t keep the connection to MQTT alive in between each poll for data, so you get repeated connects and disconnects. The MQTT Explorer add-on does keep the connection alive but not GivTCP for some reason.

When you do get ready to start turning predbat on, follow the installation guide. Best to set read only first then set the mode you want then you can learn what predbat is planning on doing and tweak any configuration items first before it starts changing things.

D
#73 Daveb01

geoffreycoan

Thank you for this advice 🍺, will keep you posted when ready to move to the next Predbat stage.

At the moment I am looking at your cards and trying to get them working in my HA. It’s not as easy as I thought it would be but learning loads. E.g move a card to my test dashboard, but then worked out it needed Horizontal or vertical card.

I still have a few cards missing:


Very happy with the Charts they worked out of the box once I got the card and changed the yaml.

G
#74 geoffreycoan

Daveb01

Going through the missing cards in turn, and whilst I have used these ones, you don’t necessarily have to do the same nor graph/examine everything I thought I wanted to. Over time what I have looked at changes, I used to look at the Predbat home cost prediction charts a lot but since the advent of the HTML predbat plan I find it gives me pretty much everything in one place.
But play around with things, see what you like, what you don’t

Mushroom entity card is a a prettier version of the standard entity card and is one of a set of restyled cards. Not even sure why I chose to use that for just that one view, maybe I was trying it out:
https://github.com/piitaya/lovelace-mushroom

You will need to add the system monitor integration (a standard HA integration) and turn on the specific things you want to monitor.

Mini graph card https://github.com/kalkih/mini-graph-card

Auto entities is covered in the install instructions for the predbat control dashboard I linked to earlier.

Battery state card is much the same as the standard entity card but can optionally colour code the icon based on battery level. I have a number of Govee bluetooth temperature and humidity monitors around the house which are battery powered so this enables me to visually see what batteries are getting low.
https://github.com/maxwroc/battery-state-card

R
#75 Rbor

geoffreycoan General questions about dashboards and views.
This thread has prompted me to look back at my own dashboards and views – something that I have neglected for some time. Time has allowed me to forget some of the tricks that I learnt many months ago.
I have added to my collection of HACS cards over time but there are so many .....
And I certainly don't have the number of views on my entities that you have.

  1. Do you have a stock types of dashboard and view that you start with?
    If I add a new view, these are my options:

Have I added the 'layout' option myself or is it something introduced with HAOS updates? (I am currently on Core 2024.9.2 and I know that 2024.9.3 is available).

  1. Do you start constructing a card using the visual editor which seems to compile a lot of code behind the scenes before looking at the code editor?

I learnt a lot by looking at your raw dashboard code that you uploaded way back in #36 and #37.
Did you assemble this as one card containing all the others or using many cards?
As more of a project, I am thinking of starting afresh with HA and predbat which I currently run from a pi4 with attached SSD. I purchased a pi5 earlier this year with the intention of 'upgrading' my setup. I don't really want to restore from a backup to a new HA on pi5 to avoid all the guff that accumulates. It is much more work but I hope my knowledge has improved substantially from my 'rabbit-level' when I embarked on Predbat at the end of January 2024.
At least the sun returned yesterday after recent dismal days and poor generation. And today (Sat) is looking really promising.

Thanks

Rob

G
#76 geoffreycoan

Rbor Have I added the 'layout' option myself or is it something introduced with HAOS updates? (I am currently on Core 2024.9.2 and I know that 2024.9.3 is available).

Do you start constructing a card using the visual editor which seems to compile a lot of code behind the scenes before looking at the code editor?

The ‘layout-card’ suffixed view types are custom types provided by the HACS layout-card component. The rest are out of the box HA options.

The main default option for laying out cards on a HA dashboard was Masonry which works fine enough but has really annoying behaviours of moving the cards around if you view the same dashboard on different sized devices (eg phone, tablet, PC).

I used Grid layout to get around with sub-sections of horizontal and vertical cards that as it keeps everything aligned in a grid, and then Home Assistant introduced the ability to display different cards based on the screen width so I have now slight variations of parts of the dashboard depending on whether I’m using a phone or not - e.g. the battery cards are laid out with 2 elements across the screen if on a phone, or 3 across with a wider device. The predbat plan shows more detail (effective rates) if viewed on a tablet vs less if viewed on a phone.

Since then HA have introduced the sections feature which gives loads more control over the dashboard layout, size of the cards, etc. It has had new features added to each release of HA over the last few months so will be the default option (replacing Masonry) at some point soon. It is marked as ‘experimental’ due to this but it’s perfectly usable.
I intend to re-do my dashboard in the future but what I have works now so I’m waiting until sections becomes fully mainstream and I watch some videos on how to use all the new features (probably Smart Home Junkie or Everything Smart Home will be the main ones I wait for).

Meanwhile I keep tweaking and changing things. The target times that tell me the delay to program into the washing machine to run it on cheap overnight agile import got changed recently for example and what’s above is probably a hybrid of old and new that’s changed again. I’m still using Appdaemon to run Predbat not the Predbat addon and one reason for that is that I used Octoblock to work out the cheap periods for the washing machine, this was then displayed with a horrible HTML card. I have now swapped over to using target rate sensors from the Octopus integration and a Jinja code card that enables me to create custom display sensors for the washing machine delay time.

To answer your question though, start off in the visual editor it’s much easier. I only edit in YAML when I want to tweak things or cut/paste to move components around the grid although you can now do this in the sections UI so its much easier

D
#77 Daveb01

Note to all with AIO or 2 x AIO doing a Battery Voltage Card.
The pic is my case as I have two but it will apply to anyone with an AIO.

Each AIO has 4 x battery packs
Each battery pack has 24 Cells (I did not know this)
So if you use Geoffrey’s yaml, be prepared to be typing a lots, plus scrolling down the card to see it all. (I will see if there is a better card once all the data in there)

Geoffrey - am I looking for a drop in voltage that I could put say a notification for if it drops below xxx

G
#78 geoffreycoan

Daveb01 Each AIO has 4 x battery packs
Each battery pack has 24 Cells (I did not know this)

Interesting. My 9.5 and 5.2 have 16 cells, so yes, lots more sensors. This is a good example where editing the dashboard in yaml is a bit easier than editing via the UI as you can copy/paste

Geoffrey - am I looking for a drop in voltage that I could put say a notification for if it drops below xxx

Yes you can create an automation with lots of individual cell voltage triggers ‘when voltage goes below X, trigger the automation’

You should have somewhere in one of these threads I shared how I send notifications, I have a common script that calls the notification action, with parameters of the message to alert and whether it is a critical alert or not (plays a sound and doesn’t auto-cancel off the screen). Just makes it easier to do each time I want to send an alert.
As well as multiple triggers for an automation you can set variables in those triggers, and then use those variables in the message text, e.g. each trigger sets a variable of the cell number and the current voltage. See the givtcp error monitor in the predbat output data docs for an example of doing this.

Whilst I’m here, and you have multiple AIO’s, would appreciate your input to https://community.givenergy.cloud/d/4986-experiences-with-givtcp3-and-predbat/73

R
#79 Rbor

geoffreycoan Thanks for advice and useful videos. I have just watch a Smart Home Junkie video and found in very constructive.
I have used Grid layout before and have found it very versatile.

I am afraid that too many videos race through with mouse pointing all over the place. Seem to have been put together as "Look what I can do" rather than "This is how to set up a view".

I will take a look at the Experimental Settings and I will work on improving my dashboard views.

Rob

D
#80 Daveb01

geoffreycoan

Hi Geoffrey, I have got my test Home page Dashboard up and running (it will need a few tweaks with your and other help). I have created my new Home Dashboard and will move the things from test home I like (and can prove ther working correctly with the correct Entity.

As WW will be charging the first week of October, I would like to move to HA & Predbat (scary for me). Do you have any pointers before I do?

If it does not do what I want it to (within the first 2 days) how do I over ride Predbat please.? Do I need to put it back into Monitor?

I have set up the Predbat Dashboard (hopefully the same as yours) see pics. (With the exception of a card that I did before getting yours). Last pic, does yours cover this or should I keep it?


G
#82 geoffreycoan

Daveb01 As WW will be charging the first week of October, I would like to move to HA & Predbat (scary for me). Do you have any pointers before I do?

The pointers are all in the install documentation !

https://springfall2008.github.io/batpred/install/#ready-to-light-the-touch-paper

Basically set Predbat to charge and discharge mode and turn read only on. That way Predbat will plan your charging and discharging but will not make any changes. When you are ready for it to start controlling your inverters, turn read only off.

If it does not do what I want it to (within the first 2 days) how do I over ride Predbat please.? Do I need to put it back into Monitor?

Turn read only back on and Predbat will stop making any commands to the inverters.

But before you make that step, if there is a specific session or a few that you want Predbat to do something different, you can override the session behaviour by selecting the time slot from the appropriate select controls on the dashboard above. e.g. force charge at 03:00, just choose ‘03:00’ from the ‘manual force charge’ dropdown list.

If it all gets too much you can set Predbat to read only and manually control the inverter from the givtcp controls on the first page of the dashboard. There are quick access controls to start a forced charge or a forced discharge from now for NN minutes that you can use.

I have set up the Predbat Dashboard (hopefully the same as yours) see pics. (With the exception of a card that I did before getting yours). Last pic, does yours cover this or should I keep it?

The last pic looks like just a selection of controls that are already on the predbat control tab. The control tab presents all the predbat controls grouped by switches, input numbers, etc, the extra screen is just a subset of those controls.

Daveb01 I tried to copy this one as well to see if it is better, but I get an error when I try to save it. Any ideas please?

https://springfall2008.github.io/batpred/output-data/#creating-a-compact-predbat-control-dashboard

I get this error

Sorry there is a step missing from the instructions which I will add to the documentation, my bad:

After you click the pencil icon (step 1), you then need to create a new view, so click the plus symbol top right, enter a title for the view, then click save

Then add card, scroll to the end, manual, copy paste the yaml code for the dashboard, etc. But you’ll just get the same control dashboard I gave you earlier

D
#83 Daveb01

geoffreycoan

Thank you for all the advice you have given me over the past month or so.

I am down to the last bit of the page and would like to get this going but it’s not clear where to put the code? Can you help please. Also I am doing HA etc on my iPad not iPhone, will it still work? Or do,I have to have it on my iPhone as well?

Automated monitoring that Predbat and GivTCP are running OK

https://springfall2008.github.io/batpred/output-data/#creating-a-compact-predbat-control-dashboard

G
#84 geoffreycoan

Daveb01 I am down to the last bit of the page and would like to get this going but it’s not clear where to put the code?

The automated monitoring bits of code are automations that run in the background in Home Assistant and will trigger when something happens. You’ve already created one automation for the solcast update, these are two more, one to check givtcp is running and one for predbat running.

Settings / Automations & Scenes / Create Automation / Create new automation / three dots edit in YAML and copy/paste the entire automation script in. You will need to change it for your inverter and battery id’s.

There is a new version of both of these that will be incorporated into the predbat documentation soon, so you’d be better to take these versions

https://github.com/gcoan/batpred/blob/main/docs/output-data.md

The new versions additionally checks for Predbat ‘stalled’ and will restart Predbat, GivTCP or Mosquitto broker if required.

Also I am doing HA etc on my iPad not iPhone, will it still work? Or do,I have to have it on my iPhone as well?

The scripts send an alert to specified devices that are running the HA Companion app. I have the app on both my phone and ipad but if you just configure it to alert to your ipad there’s no issue with that. Obviously having it on your phone is useful if you are out and about (but then you’ll need to think about setting up remote access if you want to control Home Assistant)

D
#85 Daveb01

geoffreycoan

Predbat on and in Read only mode.

I have paused all schedules in WW.

Will now give it 2 days to see what my plan looks like, will post it here if it does not look right.

🤞 no errors in Predbat log 👍

One thing I have noticed is Solcast entities has “forecast_forecast” entries on some lines? Is this because I have two arrays set up, or have a done something wrong?

G
#86 geoffreycoan

Great progress and good luck with the swapover, do share your plan

Daveb01 One thing I have noticed is Solcast entities has “forecast_forecast” entries on some lines? Is this because I have two arrays set up, or have a done something wrong?

No, nothing wrong. This is a quirk of the way HA works and the naming conventions. The integration is called ‘Solcast PV forecast’ and a number of the sensors are called ‘forecast day 3’ etc. So the default sensor name gets both bits concatenated together and you get the double ‘forecast’ in the name.
Similar thing happens with a number of the GivTCP entities that are named for example ‘G <serial no> Energy G Battery Energy Charge Today kWh’. I just rename the sensors and entity names to make them more readable.

Of course any change to sensor entity id you will need to amend apps.yaml or any dashboard yaml if you use these sensors anywhere

D
#87 Daveb01

geoffreycoan

Here is the plan after 16:30 today. Hhhmmm not sure yet, I have a few reservations at the moment (I hope Predbat is still gathering info).

  1. As I have 2 x AIO the GW can export at 12000 kWh (might reduce this to 6000 KWh) so in a nutshell both will be flat in 2.5 hrs if at 100%. Not sure I am ready to discharge fully and then charge back up all the time. The plan looks like it will discharge for 5.5 hrs from 18:00? Am I reading this correctly?

  2. Why is it charging at prices above the 15p at 08:00? As I have 2 x AIO my batteries last about 1.5 days if left alone. If it’s sunny longer. Is there a setting I can add to limit the charging to say anything below 12p and export at 15p?

  3. Not sure the SOC is correct so think this would alter the charge/discharge plan.

  4. Have I got it all wrong and should let Predbat do its thing, or is it not really up for 2 x AIO’s yet and may need a few tweaks?

Any thoughts will be very much appreciated 👍😀


G
#88 geoffreycoan

I suggest you go and study https://springfall2008.github.io/batpred/predbat-plan-card/#understanding-the-predbat-plan because you've made a lot of wrong assumptions about what the plan is showing.

  1. The plan looks like it will discharge for 5.5 hrs from 18:00? Am I reading this correctly?

No the inverter is in Eco/idle mode and the battery state is slowly dropping in response to house load.

  1. Why is it charging at prices above the 15p at 08:00?

It's not, the battery SoC is going up as your predicted solar generation is higher than your predicted house load

Is there a setting I can add to limit the charging to say anything below 12p and export at 15p?

No, Predbat doesn't work like this. It will do a cost optimisation based on minimising your expenditure, importing at cheap rates, exporting when there is excess energy that's not needed for house load.

  1. Not sure the SOC is correct so think this would alter the charge/discharge plan.

Clearly the SoC is important as if its wrong the plan will be wrong. Why do you think the SoC is wrong? The plan starts with SoC at 96%, is this different from what you think it is?

  1. Have I got it all wrong and should let Predbat do its thing, or is it not really up for 2 x AIO’s yet and may need a few tweaks?

Yes you have got it pretty much all wrong. Go and study the documentation again and understand what the different states mean (and the arrows up and down). Look at the cost column as well and think about how the cost (up or down) correlates to the state and SoC changing from one period to the next.

I don't see anything that concerns me with that plan.

And its usually not worth looking more than about 24, 30 hours forward either.

D
#89 Daveb01

geoffreycoan

Thank you again, so glad I am wrong. More reading required then 😎👍

I also think it is good for this post, a first timer to see these things, make assumptions and get answers from you guys.

G
#90 geoffreycoan

Daveb01 Yep, it certainly is a good walkthrough for other newcomers, taking them through the whole process. I'm trying to strike the right balance in advising and pointing you at the documentation vs giving long explanations so you get your head around what Predbat is doing and why so you can be another Predbat Ninja !!

R
#91 Rbor

Daveb01 I started my Predbat journey at the end of January this year. I set up Predbat, monitored for a day and then just went with it. I rarely go a day without checking everything and the forums. I have learnt so much and I consult the documentation countless times. I have watched the videos many times.
geoffreycoan has seen how my understanding has improved as one of his apprentice Predbat Ninjas.

We all make the early mistake of expecting Predbat to fill the battery up with solar and then to use the battery when generation stops. Predbat is wiser than we are – it compares grid import rates and will decide if it is cheaper to charge the battery from the grid or to take the gain from export cash. This is especially so with Agile.

My advice is to let Predbat loose and to develop your understand of what Predbat is doing over time. We all question Predbat's decisions but I usually fall back to the mantra 'Predbat is wiser than I am'.
Of course, Predbat is not perfect and can be improved but 'walk before you can run'.

Best of luck with your journey into PredbatLand.

Rob


D
#92 Daveb01

Rbor

Thank you Rob very good advice. Perhaps when I switch it over from read only, I should not look at it for a day or two, trust Predbat. Then start the process of tweaking this (after reading docs, IF REQUIRED 👍😀

D
#93 Daveb01

geoffreycoan

For some reason 2 of my cards have shrunk to the middle of the screen, any ideas? (See pics).


Geoffrey I like your Predbat card but can not get it like yours any ideas please. (See last pics)

R
#94 Rbor

Daveb01 You won't be able to resist looking at Predbat for a day or two. Nor should you do so!
Watch what Predbat is doing and learn by its actions.
e.g.

  • You may question why Predbat is charging when import rates is high.
  • Look at the PV.
  • If it exceeds load, Predbat will be charging from PV and not from grid. If you are lucky and have excess PV, the excess will be exported: income for you.

Which tariff are you on? This makes a difference in how you might expect Predbat to behave.

...... and consult the wonderful documentation. You can often quickly find a topic by typing a key word into 'Search docs' at the top:

Last advice from me is not to 'over-tweak'. It is all too easy to get lost and to lose track of how much you have changed defaults.

  • We are probably all guilty of this!
    .......and any tweaks will affect Predbat's behaviour.

  • If you have the Web UI, the config page shows all the defaults and shows in red any changes.

I am 8 months in to Predbat and I learn something new every day as my understanding improves.

Rob

G
#95 geoffreycoan

Daveb01 For some reason 2 of my cards have shrunk to the middle of the screen, any ideas? (See pics).

I think you are using the sections view, its not something I have tried yet, but it might be that you need to change the view settings to allow it to use all the screen estate:

Daveb01 Geoffrey I like your Predbat card but can not get it like yours any ideas please. (See last pics)

You have seen the default predbat plan, pictures per the documentation.

I and a number of others on this forum use the brilliant Predbat table card which can reformat the stock Predbat plan, customise what columns you see, in what order, and change the styling of them. Details in the predbat documentation https://springfall2008.github.io/batpred/predbat-plan-card/#customising-and-reformatting-the-predbat-plan

Copies of my configuration of using this card are in the YAML earlier. You'll see two versions, one for display on a tablet/PC and one with less data for smaller width screens such as a phone

D
#96 Daveb01

I have been busy most of the day, tried to login to HA on iPad and get this error in a red box at bottom.

Error Code:
NSURLErrorDomain -1004

G
#97 geoffreycoan

Daveb01 NSURLErrorDomain -1004

If I google search for that message I get https://community.home-assistant.io/t/nsurlerrordomain-1205-error-in-companion-app-help-please/639828

which is all about accessing HomeAssistant remotely via mobile data on O2 (O2 block the entire duckdns domain which means the duckdns add-on doesn’t work unless you open a VPN first).
But I’m guessing that you haven’t got as far as creating duckdns remote access?

Is it as simple as the HA server isn’t running and hence you’re getting an error when you try to connect?

D
#98 Daveb01

geoffreycoan

I have not done remote access yet.

I can see HA on my network, just can not connect, rebooted a number of times, still no luck.

G
#99 geoffreycoan

Daveb01 I don’t know., I’ve always found HA fairly robust and if it does detect an error it comes back even if it’s with an empty database.

What are you running HA on, is it a Raspberry Pi with an SD card rather than an SSD? Possibly SD card corrupted?

Try closing the companion app on your tablet, rebooting it, maybe try connecting to the http://homeassistant.local:8123 address via a web browser rather than using the companion app.

Can only suggest googling for the error code.

D
#100 Daveb01

geoffreycoan

Done all of above, will try my Mac next instead of iPad, (does not connect via iPhone either)
I deleted the HA Server in the app (on other suggestion) and it won’t connect and get the same error.
Could it be anything to do with a certificate? As HA is def running and has the correct IP.

G
#101 geoffreycoan

Daveb01 By default HA doesn’t use HTTPS so if you haven’t setup duckdns then it won’t be a certificate error (and anyway the certificates auto renew with duckdns).

You could try the more info to see what that says. It looks like it’s failing to connect to the HA server.

Try manually connecting a web browser to http://homeassistant.local:8123 or http://<HA IP address>:8123

One possible issue is your internet router. I once had that the router stopped recognising the homeassistant.local DNS name, fixed by a reboot of the router, but I tend to use the HA IP address to circumvent this.

D
#102 Daveb01

geoffreycoan

Does not say much about error 1004.

Have tried all the above connections, no joy. Very upset at moment as spent a month setting it all up and was going to switch over Predbat this morning.

It seems to be working and on the network but I can’t connect for some reason. The log files are huge and will take a while to go though, but again this was out of the blue and totally unexpected.

I ended up getting a HA yellow in the end with SSD, so it maybe a good time to test a failure, reset the yellow, install Google backup, sync and install the full backup from yesterday morning or the day before? Would be the last result, if I can not get it going today.

Thank you for your help again and suggestions.

J
#103 JasonF

I have a couple of things to add here.

Battery scaling for multiple AIO’s is not 0.85%, givtcp is pulling the capacity from the gateway at 27kwk, the portal reports it at 27.16 so the scaling should be 1.0059 to get them to match. Check the two entities in givtcp to see what yours is reporting.

In terms of charge discharge rates, I just posted on the main predbat channel, I also do not want to always charge and discharge at 12kw (when I have my car plugged in) but predbat seems to always force it back to 100. I have tried the charge scaling option and also put a limit in the apps.yaml but still it pushed the inverter rate to 12kw through givtcp. If I can’t control the rate, I’ll have to switch rest off.

G
#105 geoffreycoan

JasonF Battery scaling for multiple AIO’s is not 0.85%, givtcp is pulling the capacity from the gateway at 27kwk, the portal reports it at 27.16 so the scaling should be 1.0059 to get them to match. Check the two entities in givtcp to see what yours is reporting.

I saw your github ticket on the potential rounding of the kWh battery capacity.

r/e the scaling possibly not being required, is this a function of GivTCP v3 that it now correctly reports capacity as 13.5 for each AIO, or is it the summation of AIO capacity in the gateway (for multi-AIO’s) that gets the capacity correct?

Need someone with a single AIO and GivTCP v2 (which did need the battery scaling set) and GivTCP v3 so I can update the installation instructions appropriately.

J
#106 JasonF

geoffreycoan

Yeah let’s see what he says about the rounding, because if it is that then no scaling would be needed.

I just checked what give tcp says for the individual batteries and it’s still 16.48 so single AIO will still need scaling. But for multiple its doesn’t look necessary. (It’s weird because the GE portal shows individual AIO’s as 13.58 for a while now, so I don’t know why GIVTcp still reports a higher value)

D
#107 Daveb01

JasonF

I will check the Battery Scaling once I get back into HA.

With regard to import and export at 12 kWh, I was going to test a few things one at a time to see what happens.

  1. Comment out all three options in yaml, set the export to say 6 kWh in the GE cloud, and see if it gets changed, look at the logs to see what changed it (you-Server-WW-Predbat), fyi, I tried a similar thing with WW and it still exported/imported at 12 kWh. This maybe a beta issue that has not been solved yet when working with 3rd party automations.

  2. I am not sure what effect Predbat would have if I commented out the inverter limit. I already have export rate commented out & inverter limit charge & discharge.

Inverter control configurations

inverter_limit - One per inverter. When set defines the maximum AC output power in watts for your inverter or micro-inverters (e.g. 3600). This will help to emulate clipping when your solar produces more than the inverter can handle, but it won't be that accurate as the source of the data isn't minute by minute. If you have a separate Solar inverter as well then add the solar inverter limit to the battery inverter limit to give one total amount.
For example, if you have a GivEnergy hybrid inverter you should set export_limit to 3600 or 5000 depending on which size inverter you have. If though you have a GivEnergy All-in-one (6kW AC limit) and a 5kW Solis solar inverter, you should set inverter_limit to 11000 (6000+5000).

export_limit - One per inverter (optional). When set defines the maximum watts of AC power your inverter can export to the grid at (e.g. 2500). This will emulate the software export limit setting in the Inverter that you will have if your G98/G99 approval was lower than your maximum inverter power (check your install information for details). If you do not set an export limit then it's the same as the inverter limit.

inverter_limit_charge and inverter_limit_discharge - One per inverter (optional). When set in watts, overrides the maximum charge/discharge rate settings used when controlling the inverter. This can be used if you need to cap your inverter battery rate (e.g. charge overnight at a slower rate to reduce inverter/battery heating) as Predbat will normally configure all timed charges or discharges to be at the inverter's maximum rate.

J
#108 JasonF

None of it does anything to the actual inverter. It seems to be used in the plans etc, but the behaviour it passes to give tcp seems to be “set it to 100%” of the inverters reported rate.

I’m waiting for a response on the other thread as we might need the GivTCP developer to implement something to be able to control it. The api is picking up when you lower the rate in the GE portal, but it still reports the maximum possible rate to predbat which i assume it’s looking at and saying set it back to the max.

I assume it hasn’t really been a consideration because very few people can push 12kw!!

J
#109 JasonF

Actually I haven’t tried these:

inverter_limit_charge and inverter_limit_discharge - One per inverter (optional). When set in watts, overrides the maximum charge/discharge rate settings used when controlling the inverter. This can be used if you need to cap your inverter battery rate (e.g. charge overnight at a slower rate to reduce inverter/battery heating) as Predbat will normally configure all timed charges or discharges to be at the inverter's maximum rate.

Let me give it a go.

J
#110 JasonF

Ok that works.

However it’s not super elegant, because I don’t want it set to 80% all the time. I only want it lower when my car is plugged in, which means I have to edit that file. I’m going to speak to the the GivTcp developer and see if he will consider and enhancement to help make it more dynamic.

D
#111 Daveb01

JasonF

Another thing I am not sure about if I just read this - inverter_limit - One per inverter.

So I have a 6 kWh PV inverter, 2 x AIO inverters (at 6 kWh), plus the GW (which is not an Inverter, but is now controlling 2 x inverters.

So in Predbat do I put 18000 or 12000 (which is the total the GW can do with 2 x AIO) as the PV is already coming through at 6 kWh, but you can not limit this in the GW. GE Cloud says 12000. So this is what I have entered but not commented out.

J
#112 JasonF

I’ve put mine in is 12000, I didn’t know the significance of this number. I’ve exceeding 12kw with battery charging and car charging before, I haven’t noticed it doing anything. Someone else can probably give a better answer.

J
#113 JasonF

JasonF I think you should put 12000+solar inverter. It should indicate the total power that could be delivered to your house from the various inverters. Again with the larger number we have I don’t think it will affect your plans.

D
#114 Daveb01

Update on me not being able to connect to HA. There was an update of HA just now in the Apple App Store. I updated and now it’s even worse. I get the front screen (pic 1), the the next one just sits there NO scanning wheel, when I press “Enter IP address manually” nothing happens. Not very happy today 😡🙁.

So if I had reset HA, I would still not have been able to connect. Where next??? Why am I the only one this is happening to 🥴


J
#115 JasonF

Are you sure HA is running and the IP hasn’t changed?

D
#116 Daveb01

I have until the 12th to get this sorted (not looking good)

Subscription
Read more information on our newly introduced subscription model here.

You can find your subscription status below.

Subscription: Trial
Status: Active
Ends on: 10-Oct-2024

J
#117 JasonF

Daveb01 what’s this?

D
#118 Daveb01

JasonF

It’s on a fixed IP, I have check the LED’s and flashing correctly.

D
#119 Daveb01

JasonF

Sorry Wonder Watt, that’s what I am using at moment, as was going to Predbat this morning, it’s in Read only when I lost connection.

J
#120 JasonF

You haven’t hidden it behind a Vlan or something your phone can’t connect to? Your phone is on WiFi and not trying to access it remotely?

Can you ssh into it using the ip address? Just because the light it on doesn’t mean HA is running.

J
#121 JasonF

Daveb01 sounds like HA might have crashed if nothing else has changed. Reboot it?

R
#122 Rbor

Daveb01
Yes, definitely try http://homeassistant.local:8123 (from geoffreycoan).

I find that I get a more reliable connection within a browser than the app.

I use the IP address in my URL. From your screenshot, yours would be:
http://10.0.130.60:8123

I do also use the app on iPad and iPhone but not remotely as I don't have a subscription.

It is worth switching off your computer with HA on (I think you said you were using a yellow.)
I have been in the situation where a reboot of HA didn't do the trick but turning off my pi and back on again worked.

Also try quitting the app and opening afresh.

If all else fails, restoring your backup should get you back.

Rob

D
#123 Daveb01

Rbor

Just tried both in browser, just says can not connect to server. I hope it is not an Apple issue as upgraded to 18 a few days ago, but could still connect via the app. It was working yesterday, when I went to bed, and was going to go full Predbat this morning at 8 am.

I will keep trying today and look at a full reset and restore from backup. (Looks like the only option). But worried it will still be the same. Will keep you guys posted.

There are a few similar posts on the GivTCP v3, so not convinced it was something updated in the back ground, but I did not click auto update on any add-on.

D
#124 Daveb01

JasonF

I have rebooted it about 10 times, think I will unplug it leave it for an hour then try again.

G
#125 geoffreycoan

Lots of comments, so chipping in a few points myself:

inverter_limit should be set to AC inverter capacity + Solar AC capacity as per earlier comments. It’s only used in predbat’s modelling of the plan.

export_limit is also only used in the plan, Predbat relies on the inverter to impose any DNO export limits, this is so Predbat can model the inverter behaviour correctly.

inverter_limit_charge and _discharge do as it says in the instructions, cause Predbat to modify the rate that the inverter (or gateway) is instructed to operate at instead of the default max value. As you spotted @JasonF it needs to be set to an actual value in apps.yaml so is difficult to change without editing the file.
You could put in a feature request to Predbat for Trefor to change the logic so it allows both a fixed value OR a Home Assistant helper sensor name. That way you could dynamically change the helpers in an automation thentoggle the switch.predbat_active to force Predbat to recalculate.

Daveb01 Its not IOS 18 related or the update to the Companion app. I’ve been on IOS 18 on my iPad for a week or so and upgraded on my phone a day or so ago, and it’s all working fine to me.

The fact that you can’t connect via a browser makes me think the device has crashed. In the list of suggested fixes that PianSom made, one of the suggestions was to plug a physical keyboard and monitor into the device and see what you get on the console. I am not that familiar with the Yellow but I’d guess it works the same as a Pi and you can do this.

J
#126 JasonF

geoffreycoan

You could put in a feature request to Predbat for Trefor to change the logic so it allows both a fixed value OR a Home Assistant helper sensor name.

This is a good idea. Do I just raise it on the GitHub?

D
#128 Daveb01

geoffreycoan

Not going well 😡

Reset Yellow as could not log in, installed Google backup, downloaded the backup from 30th Sep. Reinstalled and get the same error and can not login.

Rebooted and backup not installed. Plus I can not get NVMe SSD working, will not move disk. So thinking it maybe the SSD has failed.

I can not see a way to wipe the SSD in HA.

G
#129 geoffreycoan

Daveb01 oh nightmare, I don't have any experience of the HA yellow, I'm sorry

Found this article on connecting an SSD to the yellow: https://yellow.home-assistant.io/guides/add-ssd-existing-installation/ but I guess you already are using that.

And a bunch of videos that may help? https://www.bing.com/search?pglt=41&q=home+assistant+yellow+format+ssd

Can you unplug the SSD and plug it into anything else you might have to see if it works or can be formatted?

Maybe just get the SSD replaced is the simplest option as it'll be under warranty

R
#130 Rbor

Daveb01

This sounds more like a local network problem. It is strange that HA was working OK in the evening but not the following morning which points to network. It could even be a dodgy network cable.
If you log into your router, can you find your pi on your network?

When you say that your 'Reset Yellow', what did you do?
I have found this video for factory resetting yellow, if it is any use:
https://www.youtube.com/watch?v=8TWkwoFbrz4&t=49s
Did you do all this? I would check out other things before trying this.

As @geoffreycoan has stated, its not IOS 18 related or related to an update to the Companion app. I’ve also been on IOS 18 on my iPad and iPhone for a week or so and it’s all working fine to me.
The Apple app is a go-between.

I would certainly try plugging a USB keyboard and mouse into the yellow and connect to a monitor/TV with an HDMI cable. You are then bypassing other devices and you will know if the yellow is working.
I can do this with my pi.

Rob

Rob

D
#131 Daveb01

So an update after 5 hrs of messing about and a second factory restart.

Took out the SSD, rebuilt, reinstalled HA, got connected, installed Google drive, downloaded the full back up from the 30th this time. We are back hoooorahhhh. Good thing is I proved to myself I can do a full reset and backup restore now. What a learning curve.

Put SSD back in and it sees it but will not move disk, so think it either needs reformatting or returned and I will get another one (I think I saw HA needs a blank SSD to work, but can not find how to do it in HA (yet).

My iPad would also not connect, went in via browser, in Mobile add-on, deleted my iPad annd all back working as well.

So not my network or cable, it could be the SSD failed, or the below, as not sure how this works? They all seem to expire after 3 months, unless I disable expiry. I have also created a long lived token.

So all in all a great learning process but not sure what really went wrong. Predbat switched back on in read only again.

Last thing is to catch up on the best settings for 2 x AIO.

R
#132 Rbor

Daveb01 👋👋👋
I really admire your resilience.

Which app are you using on iOS?
I am using just the stock Home Assistant app.

Rob

G
#133 geoffreycoan

Daveb01 as not sure how this works? They all seem to expire after 3 months, unless I disable expiry. I have also created a long lived token

The tokens are just details of where you have logged in via. So you can revoke the token, e.g. if you lose your phone or a device gets hacked. The tokens auto renew themselves; mine show several created 6 months ago and expiry 3 months away. You don’t need a long lived access token that is if you want to authenticate something external to HA to interact with HA, e.g. send data in to HA

well done for your perseverance in getting it all working again, it does rather sound like an SSD failure. Good job you had a backup, but do turn on automatic daily backups!

D
#134 Daveb01

geoffreycoan
@Rbor

Thank you both. I have set backup at 09:00 everyday, 7 local, 14 Google.

D
#135 Daveb01

JasonF

Hi Jason, now I am back online, can I make it clear to myself what you have tried and what settings you have in apps.yaml for a 2 x AIO. Do you have a PV inverter as well?

I have 1x SolarEdge 6 KWH PV inverter
1 x AIO 6 kWH
1 x AIO 6 kWH
1 x GW

This is what I have set plus Battery Scaling 0.85

Q1 - if I want to only export to grid at 6000 does grid export limit work? But I still get 12000 to house?

Q2 - you tried charge and discharge set to 6000 and that worked but no good if you want max to charge 12000 and 6000 discharge to house say?

Q3 - if I leave settings as below, and it’s July again, will I export battery’s at 12 kWh plus PV at 6 kWh = 18 kWh going to grid (DNO would not be happy?)

Q4 - is the debate still open on battery scaling for 2 x AIO’s?

D
#136 Daveb01

Rbor

Same HA app in iPadOS

J
#137 JasonF

Daveb01

Q1 - if I want to only export to grid at 6000 does grid export limit work? But I still get 12000 to house? - No idea, mine is set to 12000, and I have it controlled by the inverter limit to 80%, based on this I’d say it’s used for planning and doesn’t control anything. I think you’ll get the same for export and to the house using the inverter setting, you’ll never need 12kw out of the batteries to your house.

Q2 - you tried charge and discharge set to 6000 and that worked but no good if you want max to charge 12000 and 6000 discharge to house say? - there are two different settings for the inverter limits so this seems possible. I just charge and discharge at the same rate though.

Q3 - if I leave settings as below, and it’s July again, will I export battery’s at 12 kWh plus PV at 6 kWh = 18 kWh going to grid (DNO would not be happy?) - your DNO would have set a limit if they had a problem with with.

Q4 - is the debate still open on battery scaling for 2 x AIO’s? - you need to check the entities I mentioned. If you battery capacity entity for the gateway is 27kw then your scaling should be 1.0059 as I mentioned.

D
#138 Daveb01

Looks like they have fixed the HA app, new update out this morning.

R
#139 Rbor

geoffreycoan So where do I find these tokens?

Rob

G
#140 geoffreycoan

Rbor geoffreycoan So where do I find these tokens?

Rob

It took me ages to find them myself, going round and round the menu options, eventually googling for the answer.

Click on the bottom right your username, then the Security tab.

D
#141 Daveb01

JasonF

Hi Jason, thank you for your thoughts, I am thinking the same as you, I don’t think I need more than 6 kWh going to the house or the grid when discharging the batteries. I have not had any issue when I had one AIO. I got the second AIO to support the house load for longer really.

So what do I need to set in apps.yaml to limit the battery discharge to 6 kWh for home and grid please.

I have looked at my apps.yaml twice and can not find this setting, can you screen shot yours please or add the code in the reply please. (I have the other 2 settings btw)

inverter_limit_charge and inverter_limit_discharge - One per inverter (optional). When set in watts, overrides the maximum charge/discharge rate settings used when controlling the inverter. This can be used if you need to cap your inverter battery rate (e.g. charge overnight at a slower rate to reduce inverter/battery heating) as Predbat will normally configure all timed charges or discharges to be at the inverter's maximum rate.

J
#142 JasonF

Daveb01 it’s these: inverter_limit_charge and inverter_limit_discharge

You can’t differentiate the rate for house vs charge discharge. The inverters only operate at one rate and this is set on the AIOs and not the gateway. So the discharge setting covers export and house, so if you want to export at 10kw, that’s what you’ll also get for battery to house. Obviously there is a separate value for charge.

I have both of mine set to 9600 which is the equivalent of 80% - which will then allow each AIO to charge and discharge at 4.8kw which I’ve found to be a good point for efficiency.

D
#143 Daveb01

JasonF

What line in yaml are these settings please, I don’t have them (or can not see them for some reason)

Can you screen shot your setting please?

G
#144 geoffreycoan

Daveb01 you can put them anywhere you want in the apps.yaml file, just align them the same as the other entries, the order of the entries in the file isn’t significant.

For some reason they are not in the default GivTCP template so I’ll add them in for other new users.

I do have a job on the to-do list to tidy up the template files as the different files per inverter are inconsistent, the order of things in the file doesn’t match the install instructions and I’d like to collapse down to having as few variants of the config file as possible for ease of maintenance. But that’s on. the less urgent documentation list !

J
#145 JasonF

Daveb01 you have to add them in, I put them near the other inverter stuff. They weren’t in mine either by default.

D
#146 Daveb01

Hi all, so things I have done today:-

Checked HA was working ok this morning
Changed a few settings as suggested by Jason (for 2 x AIO)
Added the two missing settings in apps.yaml and set to 9600 (see how this works for me)
Put the Crucial P3 Plus SSD 1TB M.2 NVMe in my old laptop to see if it was working (nope nothing)
Amazon sending a new one out tomorrow, failed one returned.
As promised here are tomorrows Predbat plan (with the updated settings)

Please comment if you see anything not right.


G
#147 geoffreycoan

Daveb01 all looks sensible, its grid charging in one cheap slot overnight, doing a bit of discharging to reduce your battery level then charging at the cheap rate in the middle of the day tomorrow.

And then beyond tomorrow to Sunday, who knows, its a day away, the rates will change so not worth thinking about.

Personally I don't like this version of the plan with the battery symbols as I have to think what each one means, I much prefer the explicit words as to what's happening, but horses for courses.

I notice in your plan you have the standing charge set so that's the cause of the cost jump at midnight. Personally I focus on just the consumption cost as I can't influence the standing charge so have commented that line out of apps.yaml. Again, personal choice

D
#148 Daveb01

geoffreycoan

Thank you for the comments. I am still working on the Dashboard and trying to get it like yours for the table above, it got delayed due to the HA issue.

I will comment out the standing charge as well, as the yaml still needs tweaking and advice on what to tweak.

The plan is to get the SSD installed again tomorrow, leave it in read only over the weekend, while I work on the dashboard and go for it Monday morning.

Thank you all again have a good weekend. 👍🍺

D
#149 Daveb01

JasonF

Hi Jason, just a fyi on the below.

I have both of mine set to 9600 which is the equivalent of 80% - which will then allow each AIO to charge and discharge at 4.8kw which I’ve found to be a good point for efficiency.

I set mine the same, however going onto the GE Cloud and looking at the settings it seems I can not set 80%, I can set 79% or 82% only. I have settled for 79% and changed my apps.yaml to match these settings. (9570W). If I think this is to high I will reduce it in the future.

The reason I have changed it is because if the setting with 2 x AIO is fixed and we try to put in a number that it does not recognise we may get an error.

Pic 1 is 79%
Pic 2 is 82%


J
#150 JasonF

GiveTCP will set it for you. So put 9600 on your config file and when you turn predbat on it’ll set it.

J
#151 JasonF

Mines set to 80% fine for weeks.

G
#152 geoffreycoan

This may be a throwback to the older inverters where the charge and discharge rate was converted into a scale from 0 to 50, so when you set discharge rate=2600, I can see GivTCP sending the value 50 to the inverter.
This results in ‘lumpiness’ in setting the charge and discharge rates, you can’t set them evenly to every Watt value.

Maybe the AIO works differently but the GivEnergy Portal doesn’t recognise this but GivTCP allows you to set a specific watt value?

R
#153 Rbor

geoffreycoan A favour ....

Can you take a look at the conversation I have had with @"Wavy Davy" at the bottom of the 'First night with Predbat' thread.
Issue is a large home assistant.db file which is can fill up an HA backup.
It is really an HA issue rather than predbat but if it is leading to enormous backup files, could be a real problem for Predbat backups. My db file is about 3.7 Gb in size but it isn't part of my backups (unlike @"Wavy Davy").

Could we just delete the file? Forums suggest methods for reducing its size, which can take hours apparently. I am well out of my depth here. For the moment, I am keeping well away from the file, having nearly lost my HA and Predbat as my pi completely froze after I attempted to look at the db in file editor.

Thanks

Rob

G
#154 geoffreycoan

Rbor Can you take a look at the conversation I have had with @"Wavy Davy" at the bottom of the 'First night with Predbat' thread.
Issue is a large home assistant.db file which is can fill up an HA backup.

i did start catching up on the first night with Predbat thread, but there’s so much to go through, its quite daunting!

Managed to read about 70 posts but its back up to 150 unread now ☹️

But if it’s home_assistant_v2.db then don’t delete it, this is your main HA database that contains all your sensor history. There are ways to reduce the amount of data in it and I’ve been writing an article on how I’ve been reducing my own from 2.7 to about 1.7Gb at the moment but I wanted to get down to significantly smaller before I shared ‘my journey’, which is another reason why I’ve been distracted from the main predbat thread.
If its something else then maybe it is safe to delete, I’ll try to read some more of the thread and respond….

R
#155 Rbor

Wavy Davy geoffreycoan

i did start catching up on the first night with Predbat thread, but there’s so much to go through, its quite daunting!

I think we have done a reasonable job in responding to issues but without your guiding eye to check whether we have blundered. You work on these 'getting started' threads is really useful. So I have checking back through 'First night' will not be quite as daunting as you fear.

I remember you saying that you were trying to get your file sizes down. There are many home assistant threads about recorder issues which are claimed to have started with HA 2024.5
e.g. https://community.home-assistant.io/t/psa-2024-7-recorder-problems/746428

Last night, I was only saved by your monitoring automations from https://springfall2008.github.io/batpred/output-data/#automated-monitoring-that-predbat-and-givtcp-are-running-ok
It looks like HA had stopped purging which would have explained increases in the db file. But here, I am well out of my depth.

It was looking as if I might have to setup HA from scratch, restoring from my Google backup.
And I would have been combing back through this thread .........

My backup files do not include the HA db file (just as well from the size) but Wavy Davy's backup seems to include it.

Rob

W
#156 Wavy Davy

Rbor Yes it does include it and backup is now at 8.3 Gb. I did think I may exclude it as its historical data and should eventually recreate itself if the backup is used, but still not sure what to do.

W
#157 Wavy Davy

Just tried a backup with database excluded. 291 Mb

G
#158 geoffreycoan

Wavy Davy You really do want to backup home_assistant_v2.db as that’s your core HA database and if you ever have to restore you’ll have lost all your sensor history and may well have to setup your configuration of predbat, etc. Some things in HA like automations and dashboards are held in YAML configuration files, but all the data is in that db file.

So question is why has it grown so humongous?

First thing I would look at is how much sensor history you are holding. In configuration.yaml:

recorder:
  purge_keep_days: 14

This is a bit of my own configuration, by default HA keeps 10 days of full sensor history, I have extended it to 14, but I am likely to be reducing this back to 8 as that’s all that Predbat needs to look back at.

So check whether you have increased this too much.

As well as the raw sensor history which keeps every single state change so if you have very “noisy” sensors can be a lot of data (see my forthcoming post on this and how to deal with it), HA keeps what’s called Long Term Statistics. This is data sampled every hour and contains just the max, min and average sensor value in that hour.

In recent HA releases you can now see the statistics in the HA graphs, so if you look at say import power over a month, the last week or so will appear as a solid line, the long term stats (LTS) will appear in a fainter line. The inclusion of the LTS in the history graphs is going to enable me to reduce the amount of history I keep as for most purposes the LTS is good enough.

So first thing I’d do @Wavy Davy is check what purge_keep_days is set to, and if you can, reduce it down to a more manageable figure. There’s a lot you can do to look at how much data is being retained per sensor and purge individual sensors down to retain less history, but first thing I’d do is check and decide whether you really need lots of raw detailed history. That’s probably why your database is increasing so much.

R
#159 Rbor

geoffreycoan Thanks as aways for your advice.
At some stage in the past, I had increased purge_keep_days to 30.

After my issues last night, I reduced back to the HA default of 10.
A scheduled backup came through 1 hour ago and my backup is now 1.1 Mb (it was 1.6 Mb).
I have just reduced down to 8 days and I will see if the size changes.

Strangely my home_assistant_v2.db file shows as 3.7 Gb but my backup is 1.1 Gb.

I found the HA forums on the db file somewhat scary – too many conflicting suggestions, including "Just delete the file".

I have been running predai. Do you know whether predai uses the HA db?
Predai does have a db. I assumed that predai and its db goes into any full backup together with HA db. But Predai isn't listed separately. Here are my options for partial backup:

I will investigate the statistics within developer tools. So much to discover in HA and Predbat.
I have found the 'Smart Home Junkie' videos excellent. Too many of these videos whizz through topic with mouse pointer flying all over the place. Junkie has recently taught my Automations, Helpers and Scripts, all really nicely paced.

Rob


G
#160 geoffreycoan

Rbor I have just reduced down to 8 days and I will see if the size changes.

Strangely my home_assistant_v2.db file shows as 3.7 Gb but my backup is 1.1 Gb.

Good news, glad you have found and reduced the storage requirement.

The reason why your db file has not reduced in size is that sqlite (which is the database software) doesn’t physically reclaim the space when records are deleted, it marks them as logically free. Every 2 weeks HA will do a housekeeping and will repack the database to reclaim the free space.

You can do a repack yourself at any time by Developer Tools / Actions / Recorder Purge
(nb: not purge entities, that’s a different action)

Tick the ‘repack’ option, don’t change anything else and click ‘perform action’

Rbor I have been running predai. Do you know whether predai uses the HA db?
Predai does have a db. I assumed that predai and its db goes into any full backup together with HA db. But Predai isn't listed separately. Here are my options for partial backup:

I am surprised that Predai doesn’t appear in the list of add-on’s as it is an add-on (whereas integrations such as solcast are all bundled with HA and backed up when you tick the ‘home assistant’ box at the top). Weird. Maybe it writes all its files in the /homeassistant directory 🤷‍♂️

I personally do a partial backup every day and backup HA, the folders (which are negligible) and GivTCP and that’s it. The rest of the addons I backup once a month when I do a full backup.

Yes the Smart Home Junkie videos are very good, I’ve learnt a lot from them. The YAML tutorials are good. I always watch his ‘what’s new in HA 2024.X’ videos as well

W
#161 Wavy Davy

Rbor Rob, the 3.7 refers to the expanded size of the database, the 1.1 is the compressed file size of all the files in the backup.

geoffreycoan Thanks Geoff your a genius, for some reason the purge_keep_days was set to 365, I've no idea why. I used the default template on GitHub although I cant now find it to check.
It still is saving at 8.3 Gb but I think it may need to be purged?

G
#162 geoffreycoan

Wavy Davy 365 days, wow, no wonder your database is so big. If you have a look at a sensor in the History view and scroll back you can see when the line turns from dark to faint, that’ll tell you how much history you currently have stored in your database. Wonder how big it will get before it gets to a full year of history ?

Home Assistant does the nightly database housekeeping at 4am, so even if you change the purge keep days in configuration.yaml and reboot HA, it won’t delete the extra data until 4am, and then only every 2 weeks does it repack the database.

But you can delete the extra data yourself. Use the Actions: Recorder Purge I covered above, don’t tick the repack option but instead tick the first option ‘days to keep’ and set this to how much history you want to retain.
I would suggest you do a series of deletes rather than trying to delete what could be months of data in one go.

So maybe delete down to 90 days history, 75, 60, 45, 30, etc. Wait 10 or 15 minutes between each command to let the data get deleted.

Cheers

R
#163 Rbor

geoffreycoan I followed your instructions in Developer Tools.
The purge_keep_days wasn't selected and the value shown was 183 days. I have set this in configuration.yaml but I wonder whether 183 days were being used.
I left purge_keep_days unselected and selected 'repack',, then 'Perform action'.

I then restarted HA which then froze (again). After about 20 minutes, I got the restart message and HA + Predbat leapt back into action.

I then checked size of the db file. It is 0.89 Mb, down from 3.7 Gb.
I ran another full backup which is now 1 Gb, down from 1.6 Gb at start of today.
In Google Backup, Predai is listed.
I wonder whether my total backup is made up of 0.11 Gb files and 0.89 Gb DB.

In File Editor, I can also now select the db file without this freezing HA.

It is easy to see how an SD card can have difficulties.

Rob

G
#164 geoffreycoan

Rbor When I repack my database I don’t restart HA, I just leave it running and it seems to manage the job of creating a new database file with less empty space in it and running HA as normal in parallel.

The purge days parameter to Recorder: Purge only has any effect if you have recently reduced your keep days in configuration.yaml and just reduces the data before the next nightly housekeeping job.

If you do a full backup then it backs up all of your addons. The Predbat addon backup for example is about 200Mb in size. Most of the rest are a lot smaller.

When to create a backup it zip’s all the files it is backing up so this reduces the size of the required storage considerably, and then appends them all together in a single tar file (history lesson: ‘tar’ stands for ‘tape archive’ and is the file format used in Unix operating systems to store file system directory backups on, you guessed it, a magnetic tape).

As you say, quite a lot of storage, even compressed

R
#165 Rbor

I have downloaded my recent full backup and here are the 'tarred' sizes with 1.08 GB for the full backup.

In homeassistant.tar.gz, the unzipped db file is 916.5 MB
In predai.tar.gz, the unzipped db file is 811 KB

Is the predai.db file obtaining data from home-assistant_V2.db?

I have also looked at history graphs and indeed there are bold lines for the history period which I now have set to 8 days.
The faint LMS lines go back for the whole of this year for any givtcp sensors.

My conclusion is that backup to generate tar files really scrunches up the file sizes.
... and that I could reduce the size by excluding some historical data entities.

I set up PV within Predbat at the start of June, when the faint lines stop.
If I then look for solcast, faint lines go further back in time but stop at start of June.

Really interesting stuff (for geeks)

Rob

W
#167 Wavy Davy

Phew. Latest backup 752 Gb. inc database. Thanks Geoff and Rob for help.

R
#168 Rbor

Well done.
I would have had a smoother experience if I hadn’t restarted HA but we got there.

We have learn some new tricks as well.

Big thanks to geoffreycoan 👏👏👏👏

Rob

G
#169 geoffreycoan

Rbor In homeassistant.tar.gz, the unzipped db file is 916.5 MB
In predai.tar.gz, the unzipped db file is 811 KB

predai is probably just the code for the add-on, so tiny. But the predbat addon tar file is very big, I don’t know why, but it seems to be way bigger than any other addon.

Is the predai.db file obtaining data from home-assistant_V2.db?

I believe it does, it uses your existing HA data to create its forecast

I have also looked at history graphs and indeed there are bold lines for the history period which I now have set to 8 days.
The faint LMS lines go back for the whole of this year for any givtcp sensors.

LTS (long term statistics), but yes, this is what I’d expect.

My conclusion is that backup to generate tar files really scrunches up the file sizes.

I think the backup is actually a ZIP archive of a series of GZIP’d TAR files. Each TAR contains multiple files (from a directory) and then it’s GZIP’d which is what compresses it. Finally they are all ZIP’d together to make a single backup file.

... and that I could reduce the size by excluding some historical data entities

You definitely can. Reducing overall history is a good first step, but you can go further (as I’ll share soon) to reduce the db storage. The Long Term Statistics are tiny so wouldn’t worry too much about them, but the sensor history is worth tackling.

If you want to be nerdy 🤓

I only started trying to reduce my own database size because I kept running out of room for backups on my google drive

R
#170 Rbor

geoffreycoan

Reducing overall history is a good first step, but you can go further (as I’ll share soon) to reduce the db storage.

I look forward to this.

Rob

W
#171 Wavy Davy

Just realised I wrote 752 Gb should have said 753 Mbs. Big difference. Doh!

D
#172 Daveb01

Good morning all.

I am officially in the Predbat club 👍🍾
Auto backup was at 08:00, turned off Read Only at 08:15.
Also saw in docs I can do a Predbat settings backup.


D
#173 Daveb01

Part two

I like the solar prediction Graph, but can not get the grey working in the top one, and can not get kWh on up scale. Any ideas please. I have the correct solcast sensors.

R
#174 Rbor

Daveb01 Well done for getting to this point.
It will be worth looking back through the threads you have contributed to and seen just how much you have learnt.

We all asked many of the same questions as we learnt the ropes of Predbat.

Rob

R
#175 Rbor

Daveb01 These are my yaml files, one for today, the other for several future days.
Look at the code and easy to adapt and can add/remove days.
I use the Predbat method for PV so my code doesn't have the solcast entities. But rest should be comparable.
I have added ``` either side of the code to keep the yaml formatting.

My future days chart shows 10%, 50% and 90% grey zones, today code, just 10% and 50%.
I found the code logical and could work my way around it to learnt more myself.

Today

type: custom:apexcharts-card
header:
  title: Solar forecast
  show: true
  show_states: true
  colorize_states: true
apex_config:
  chart:
    height: 300px
  tooltip:
    enabled: true
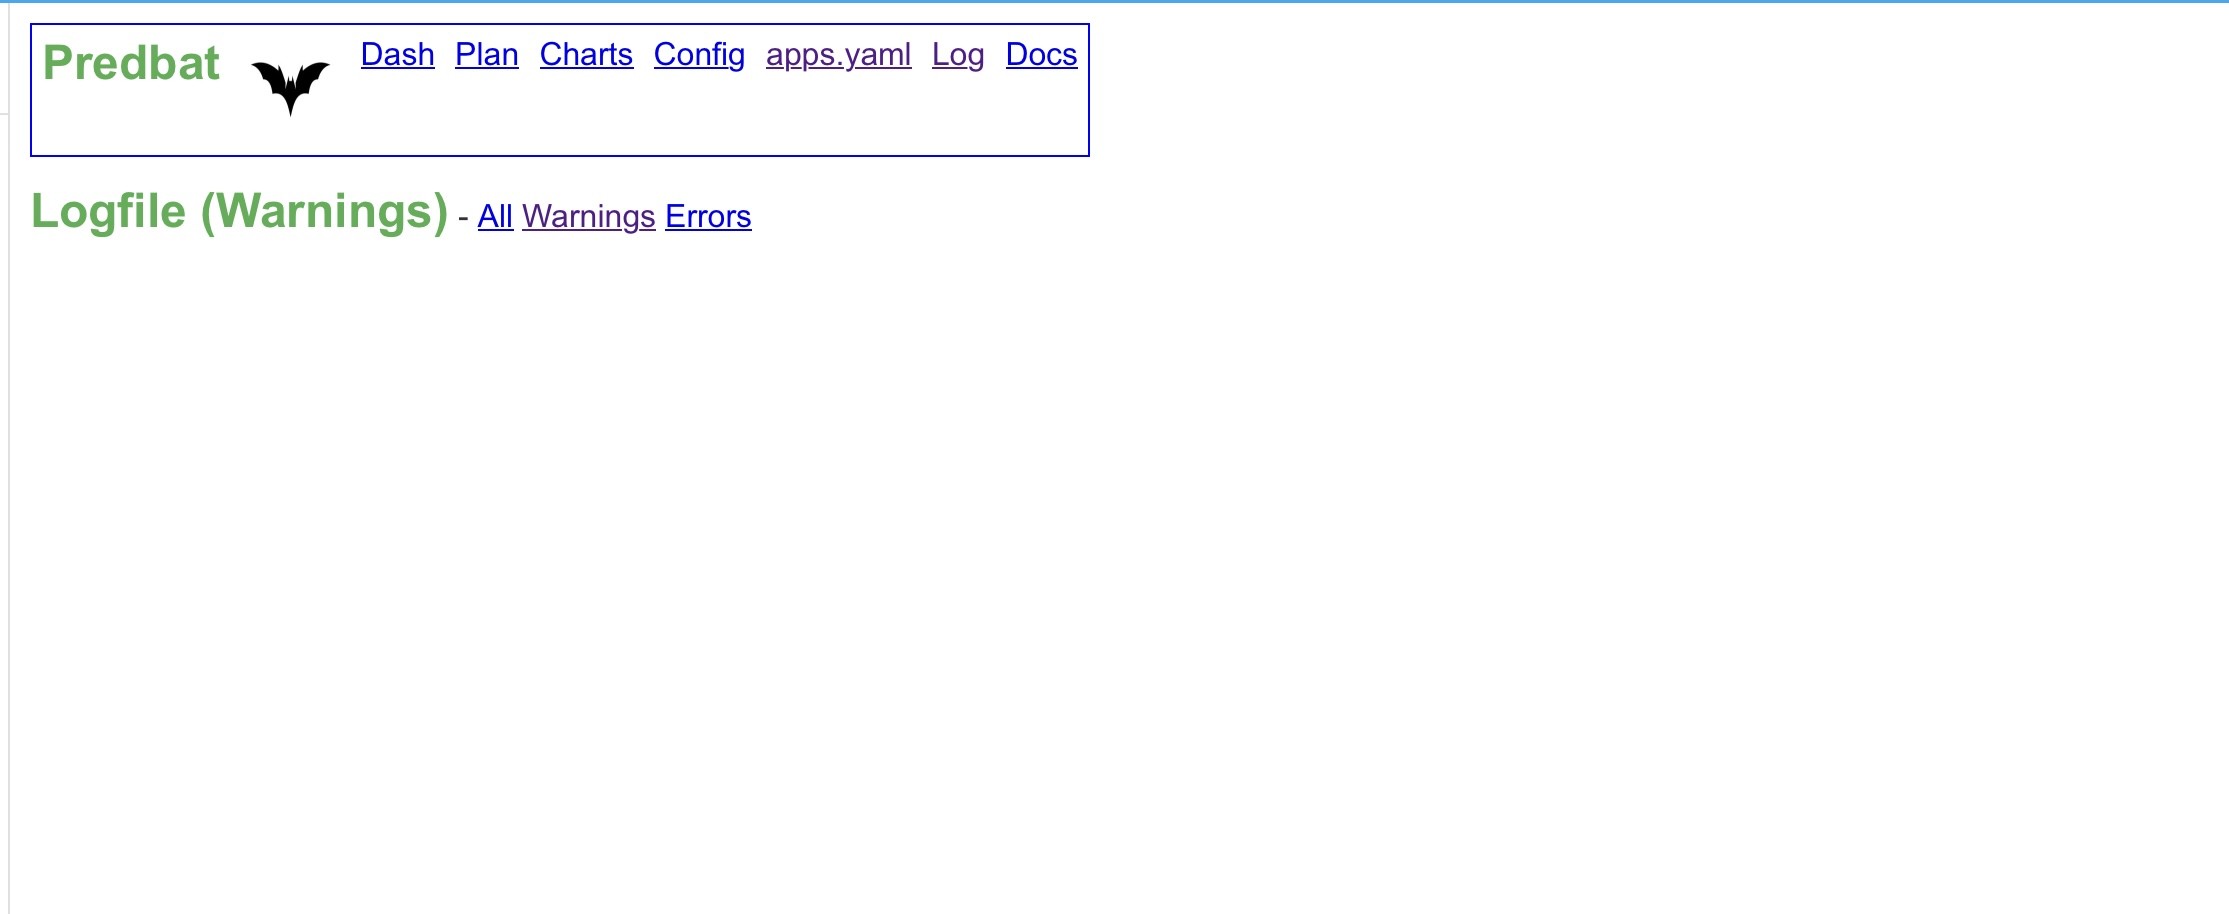
    shared: true
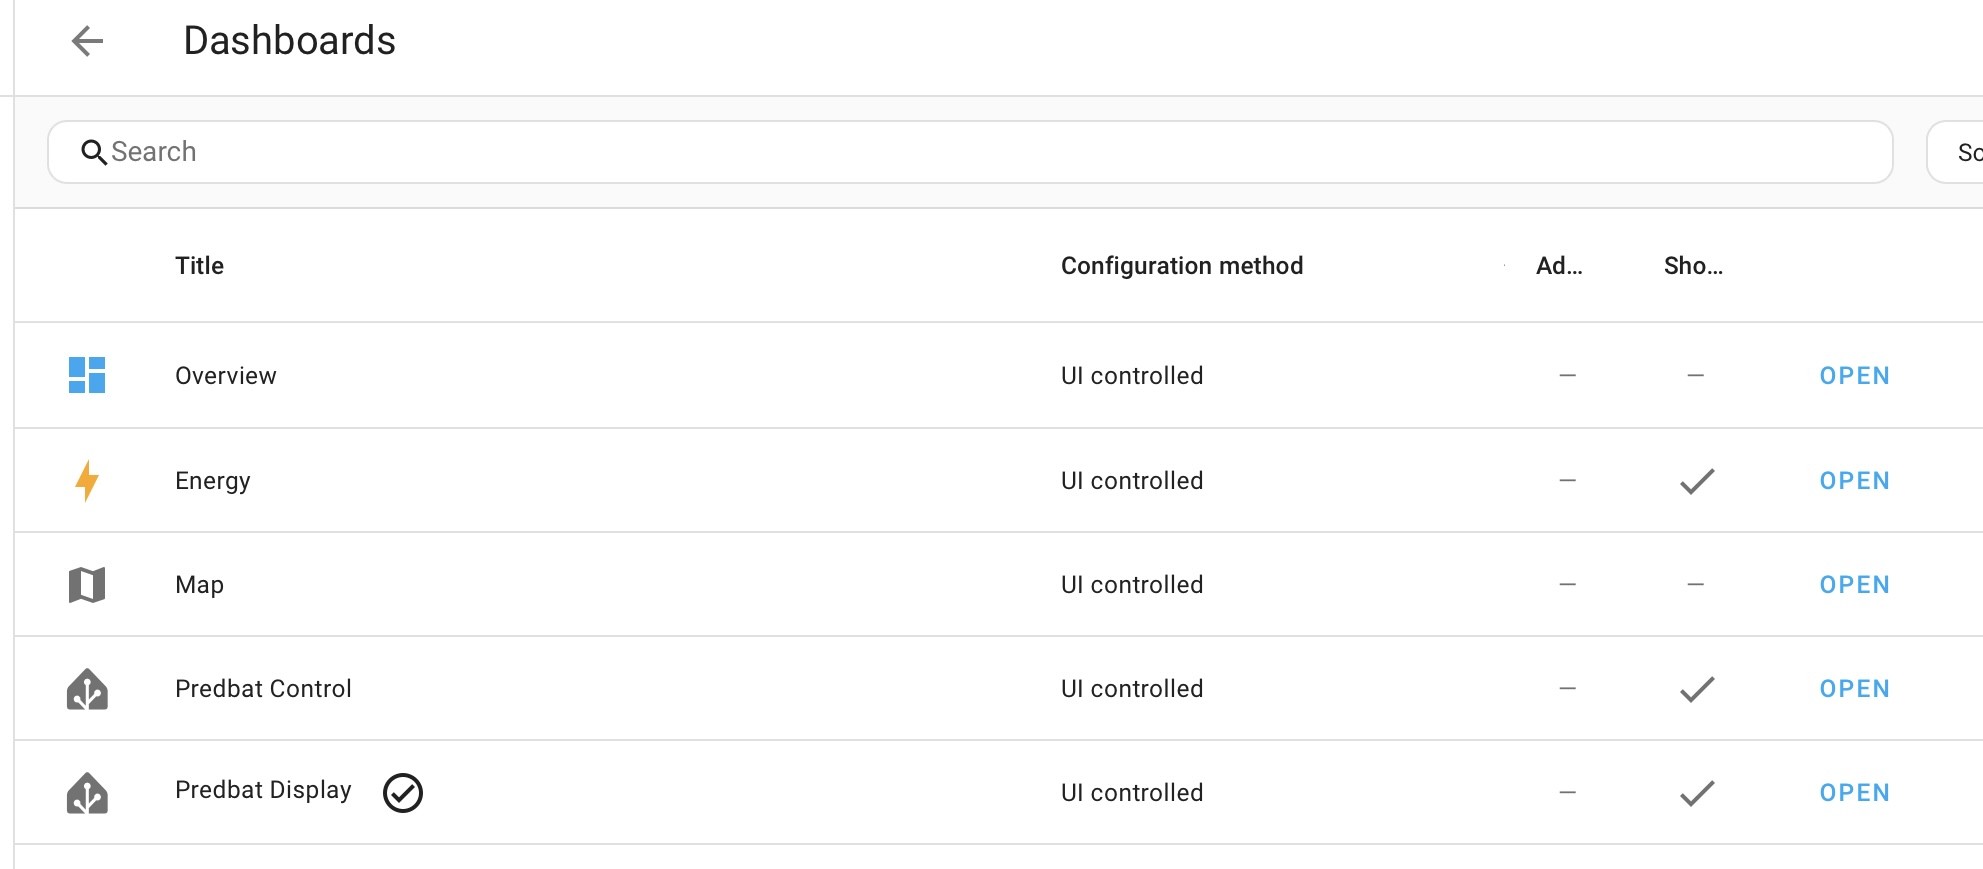
    followCursor: true
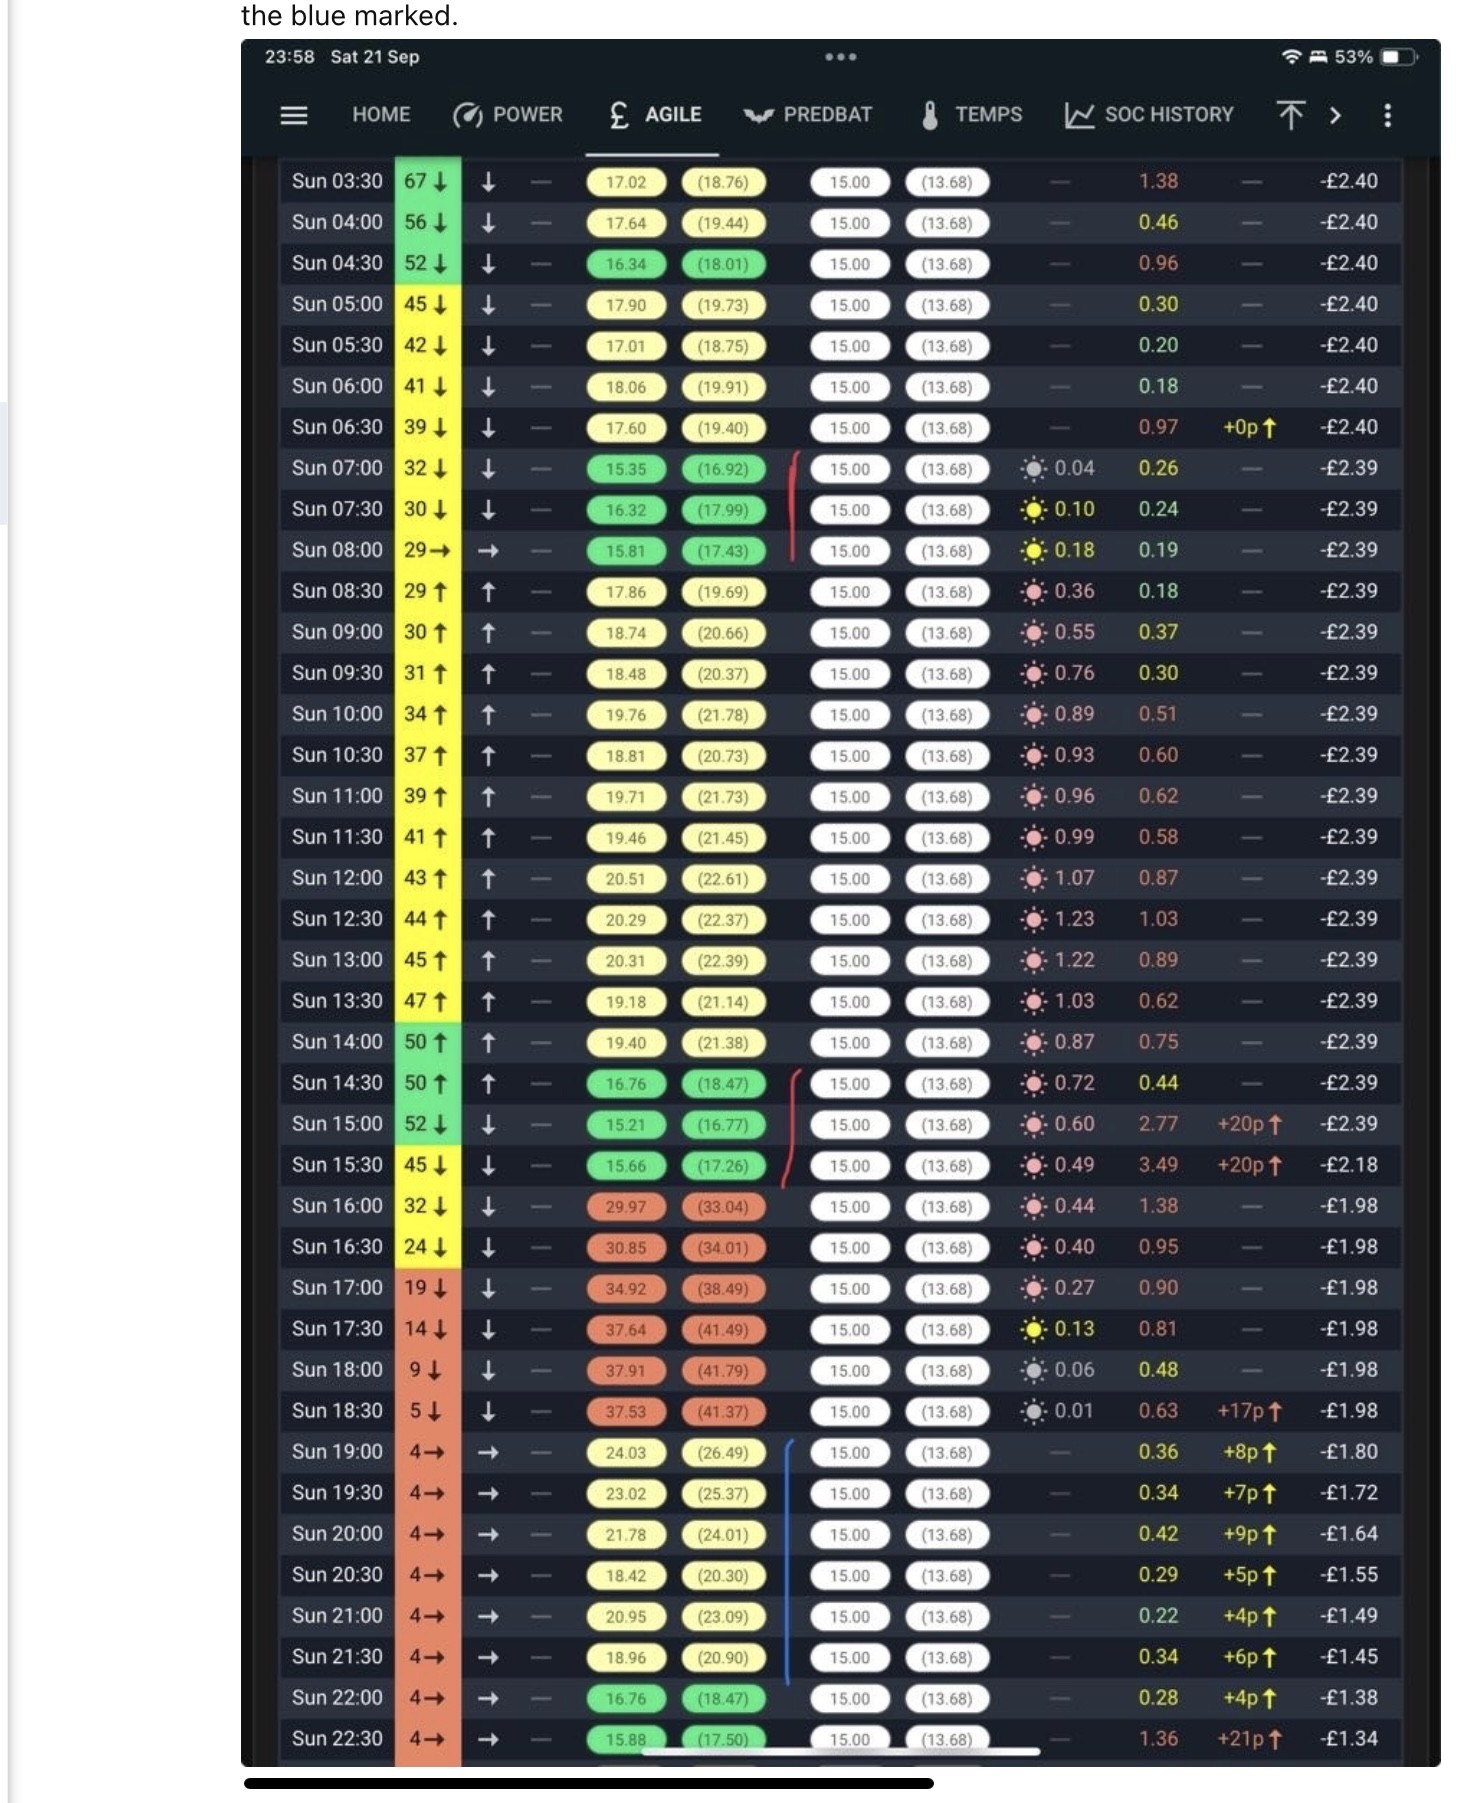
graph_span: 24h
span:
  start: day
yaxis:
  - id: capacity
    show: true
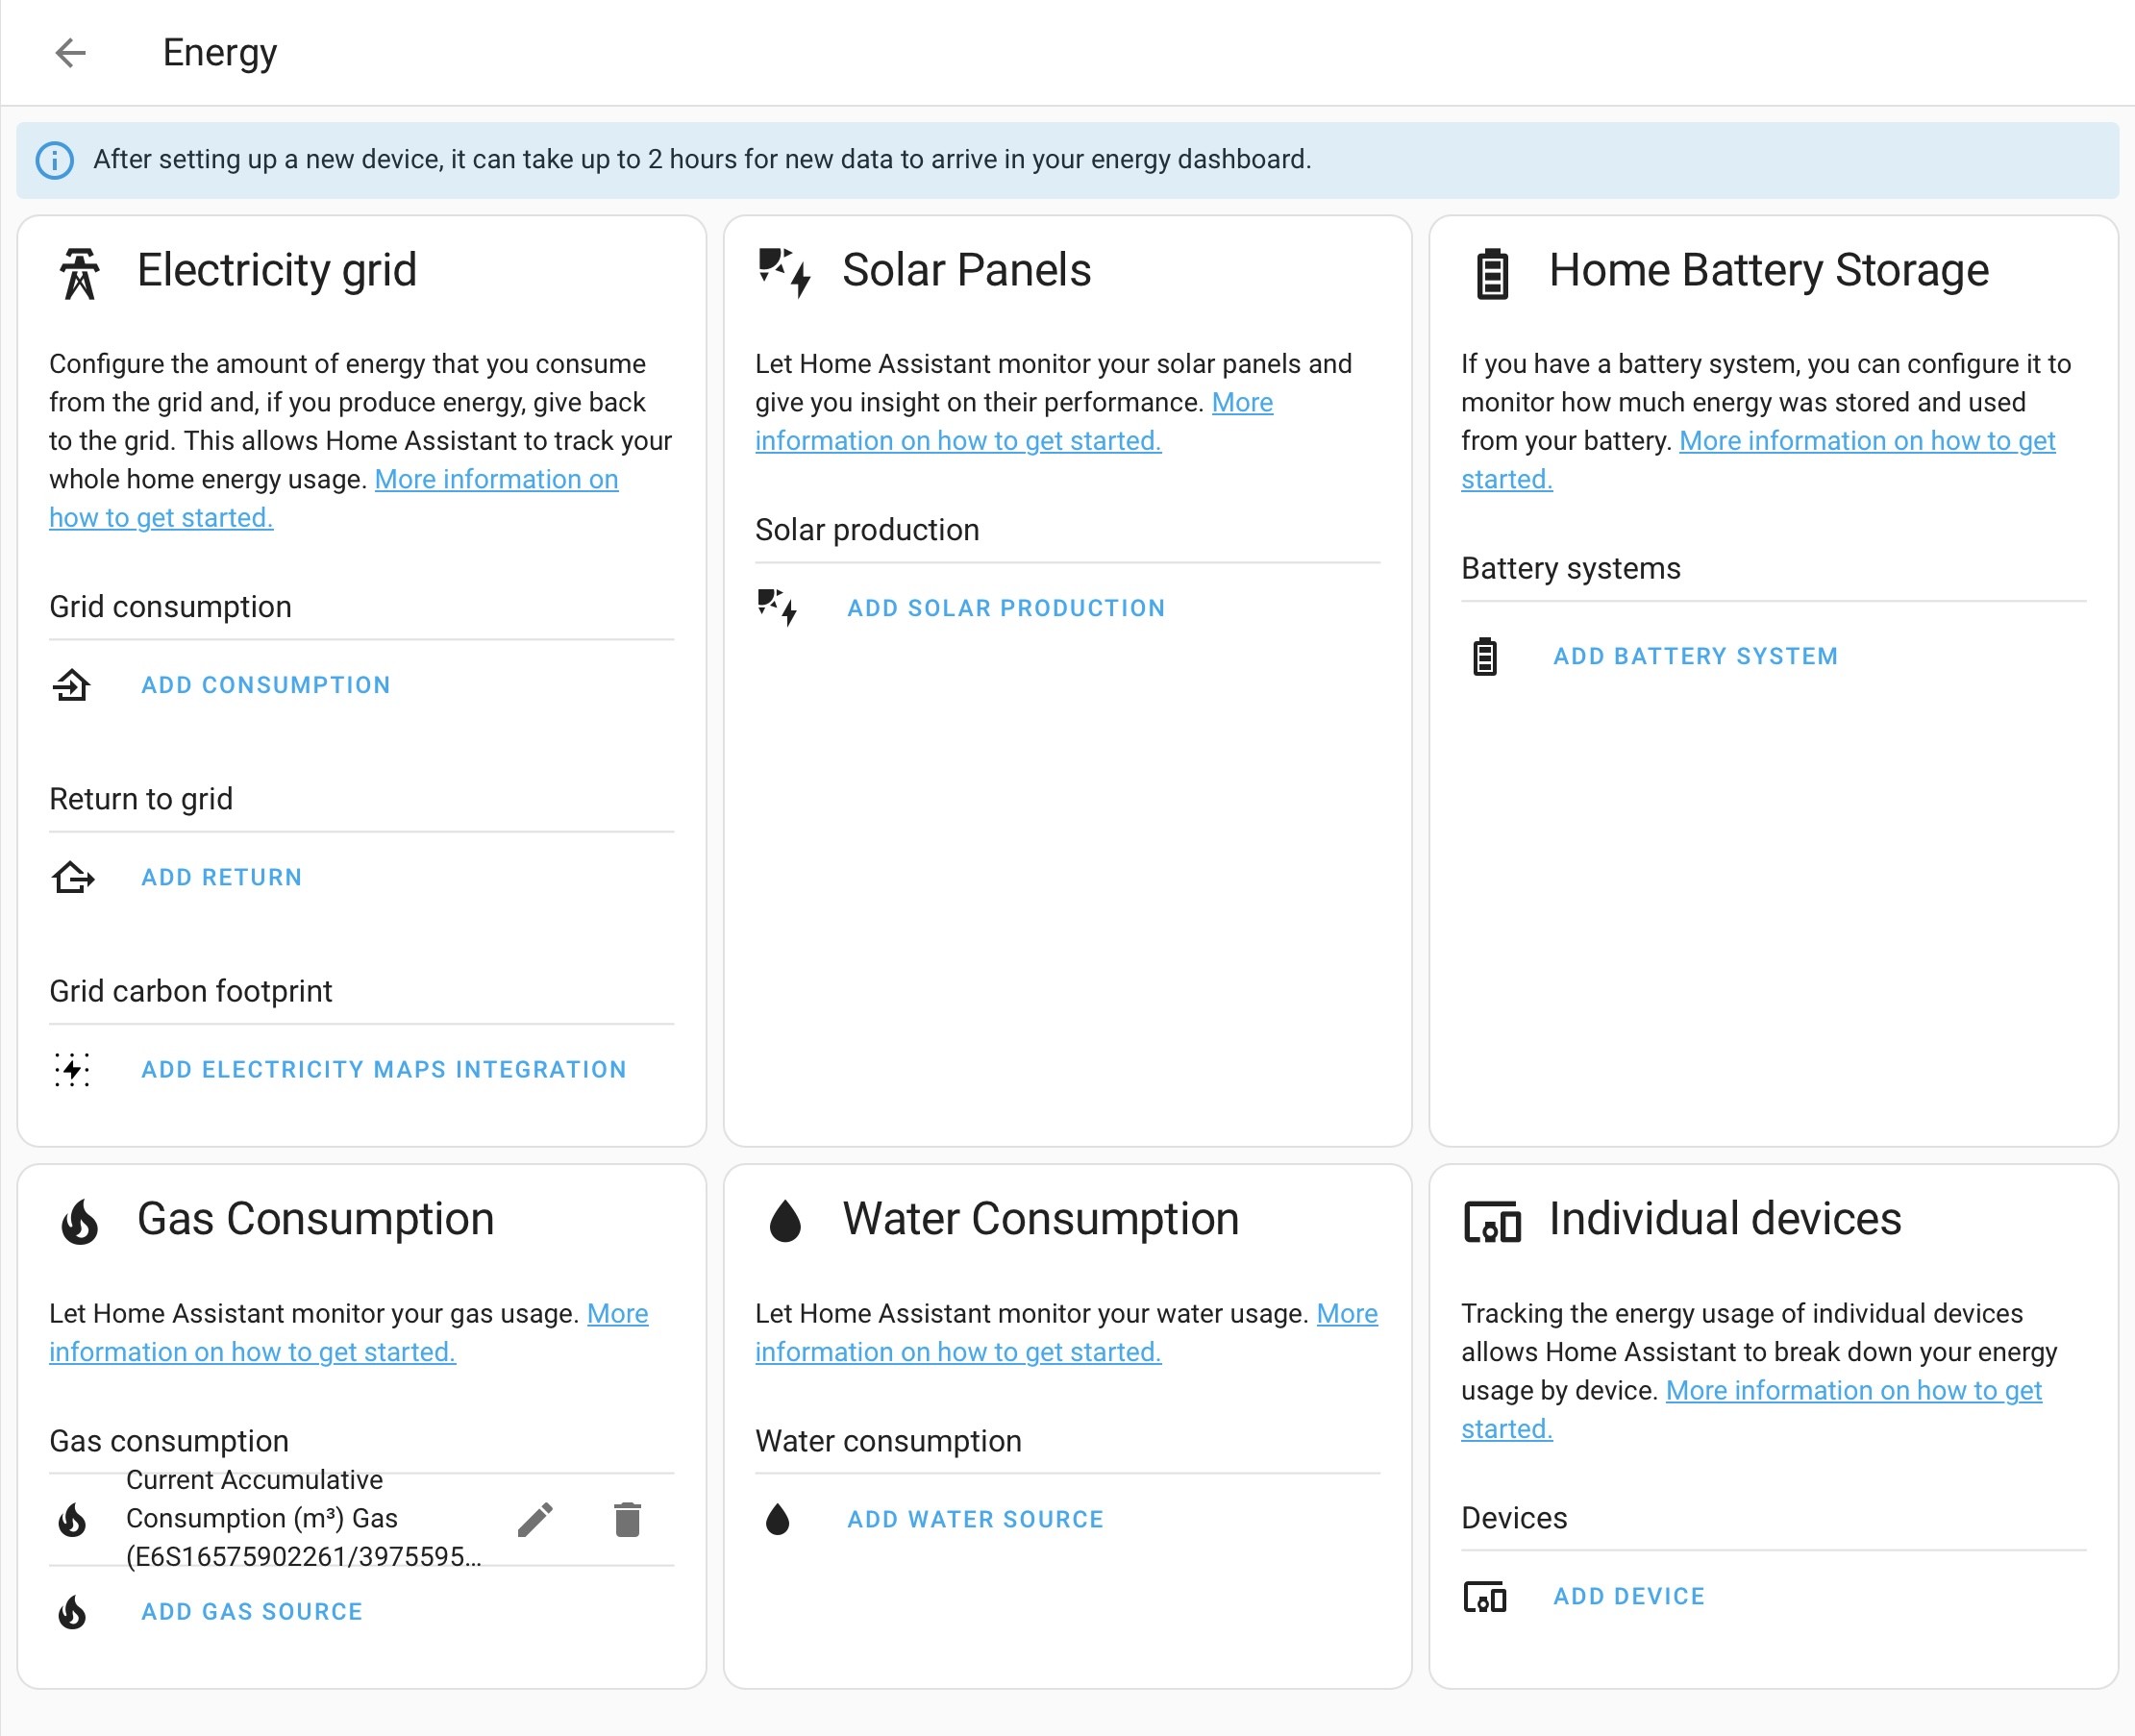
    opposite: true
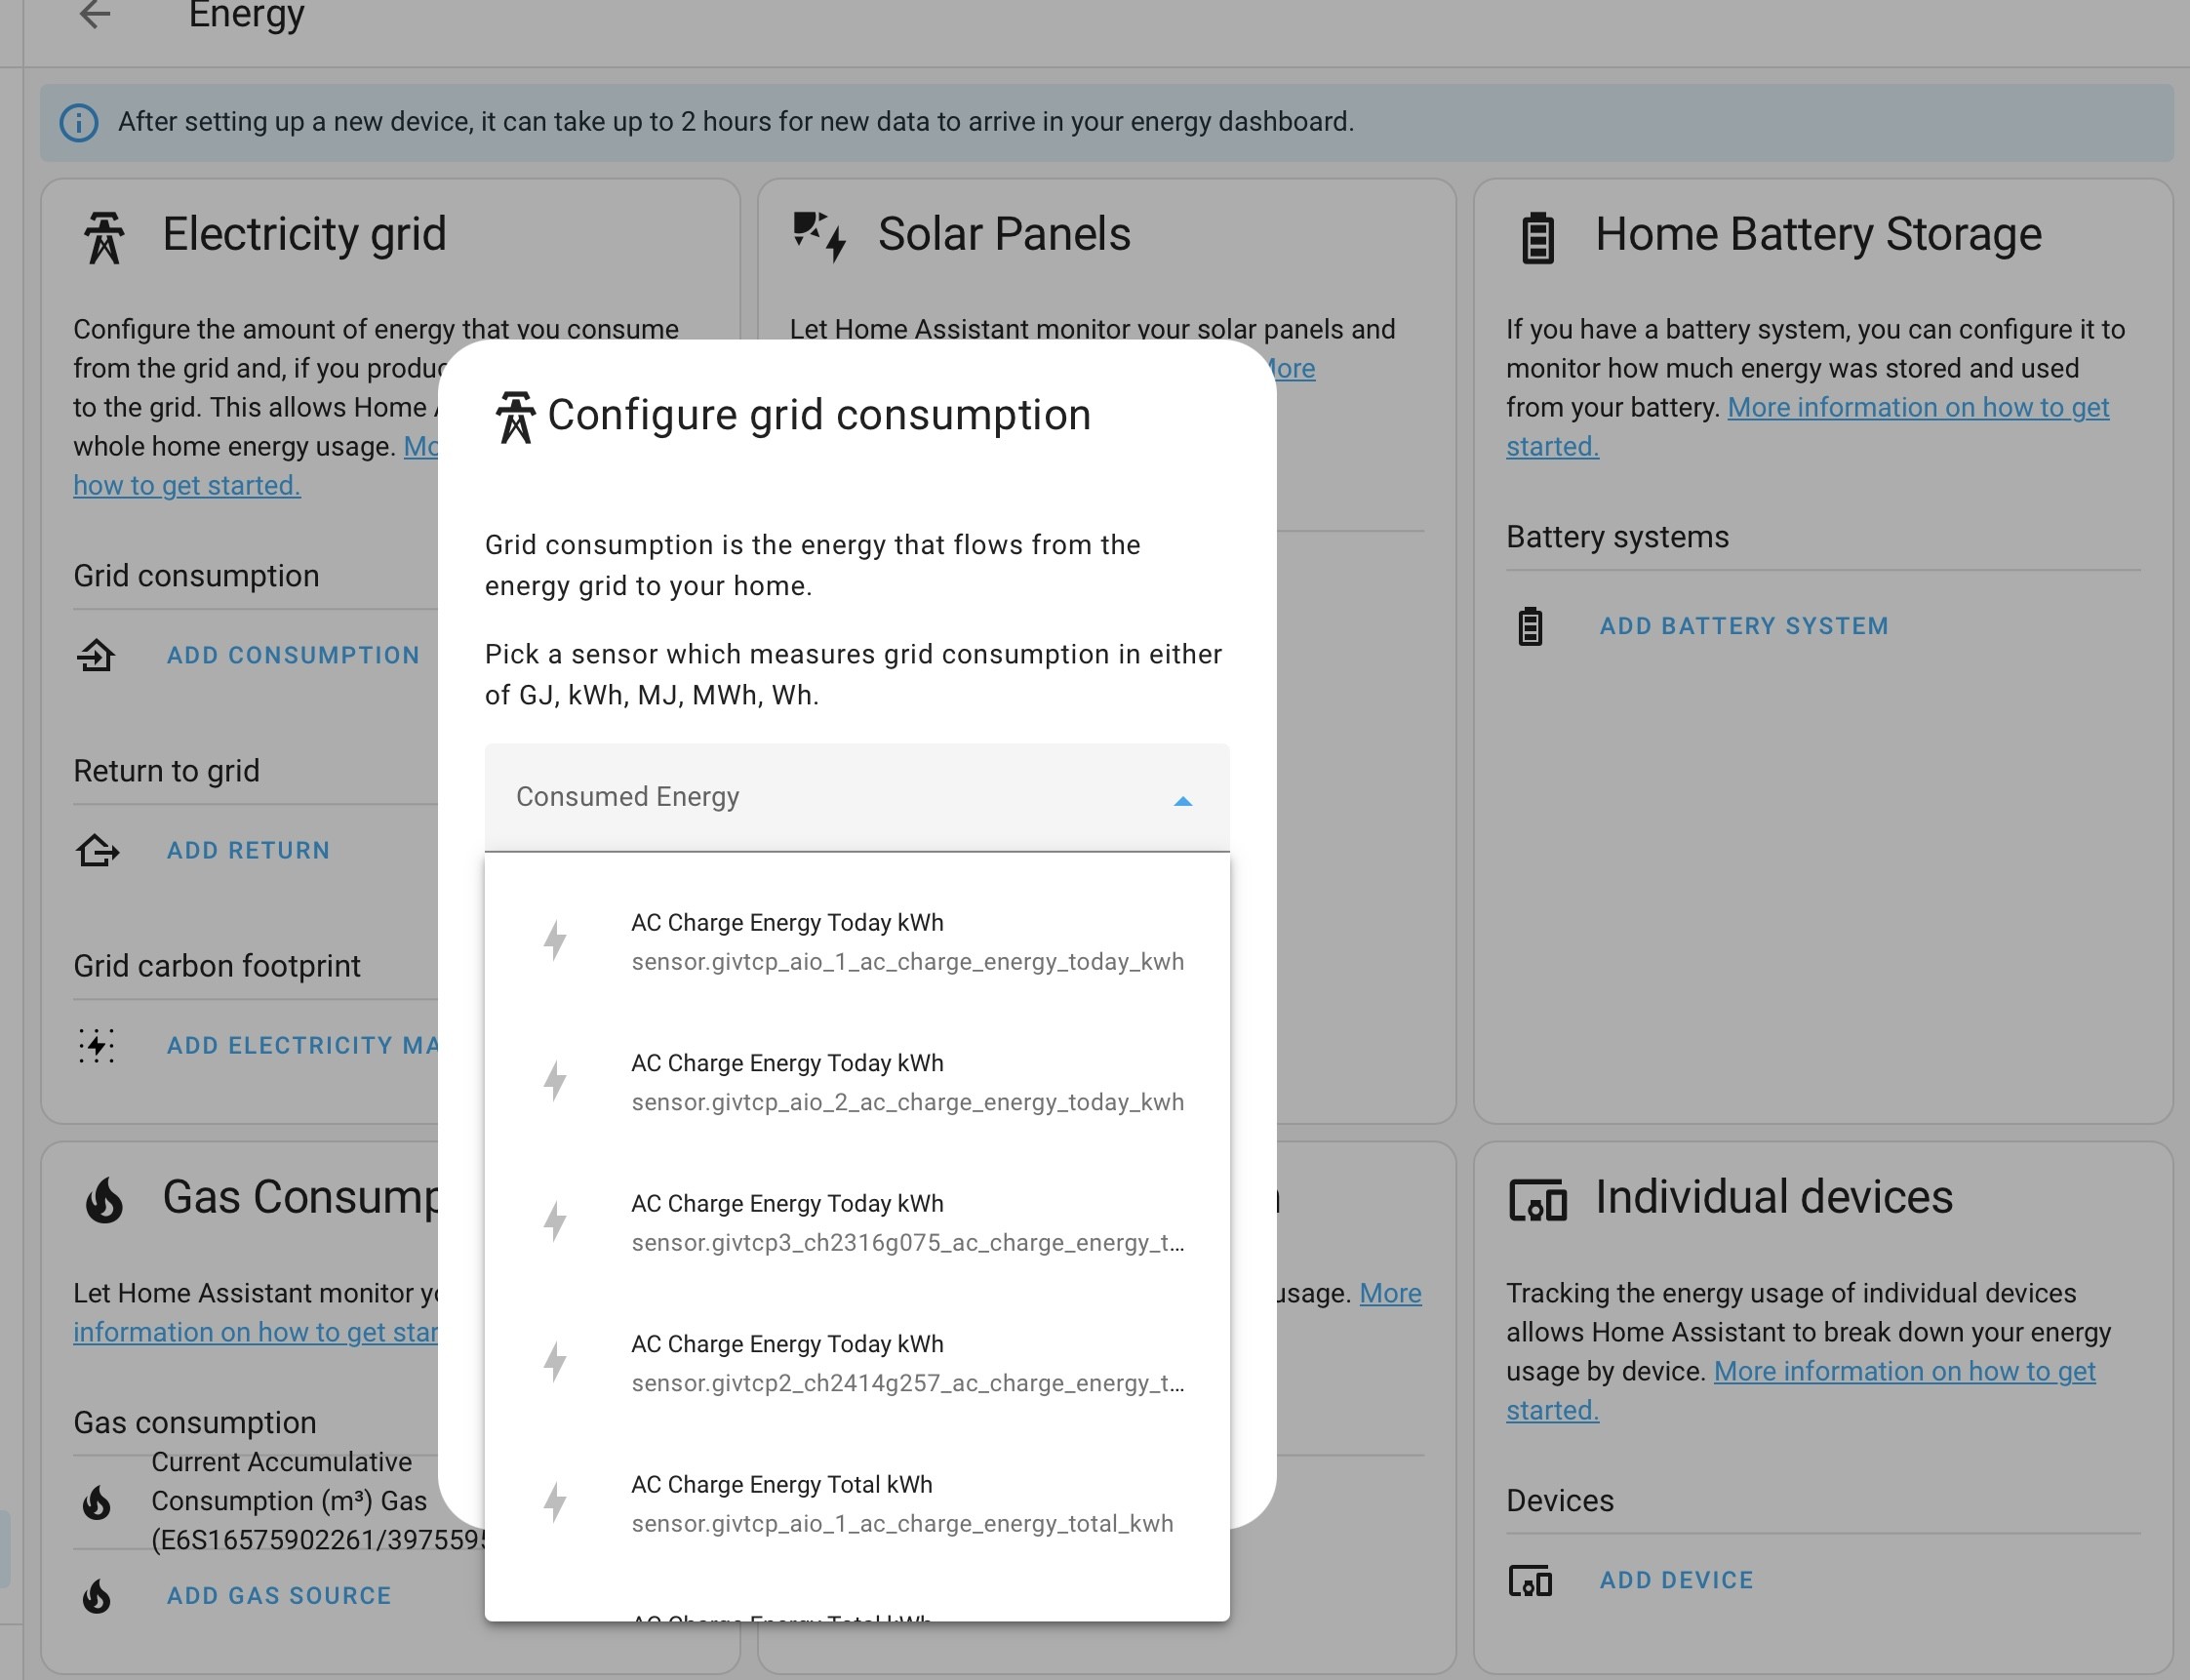
    decimals: 0
    max: 100
    min: 0
    apex_config:
      tickAmount: 10
  - id: kWh
    show: true
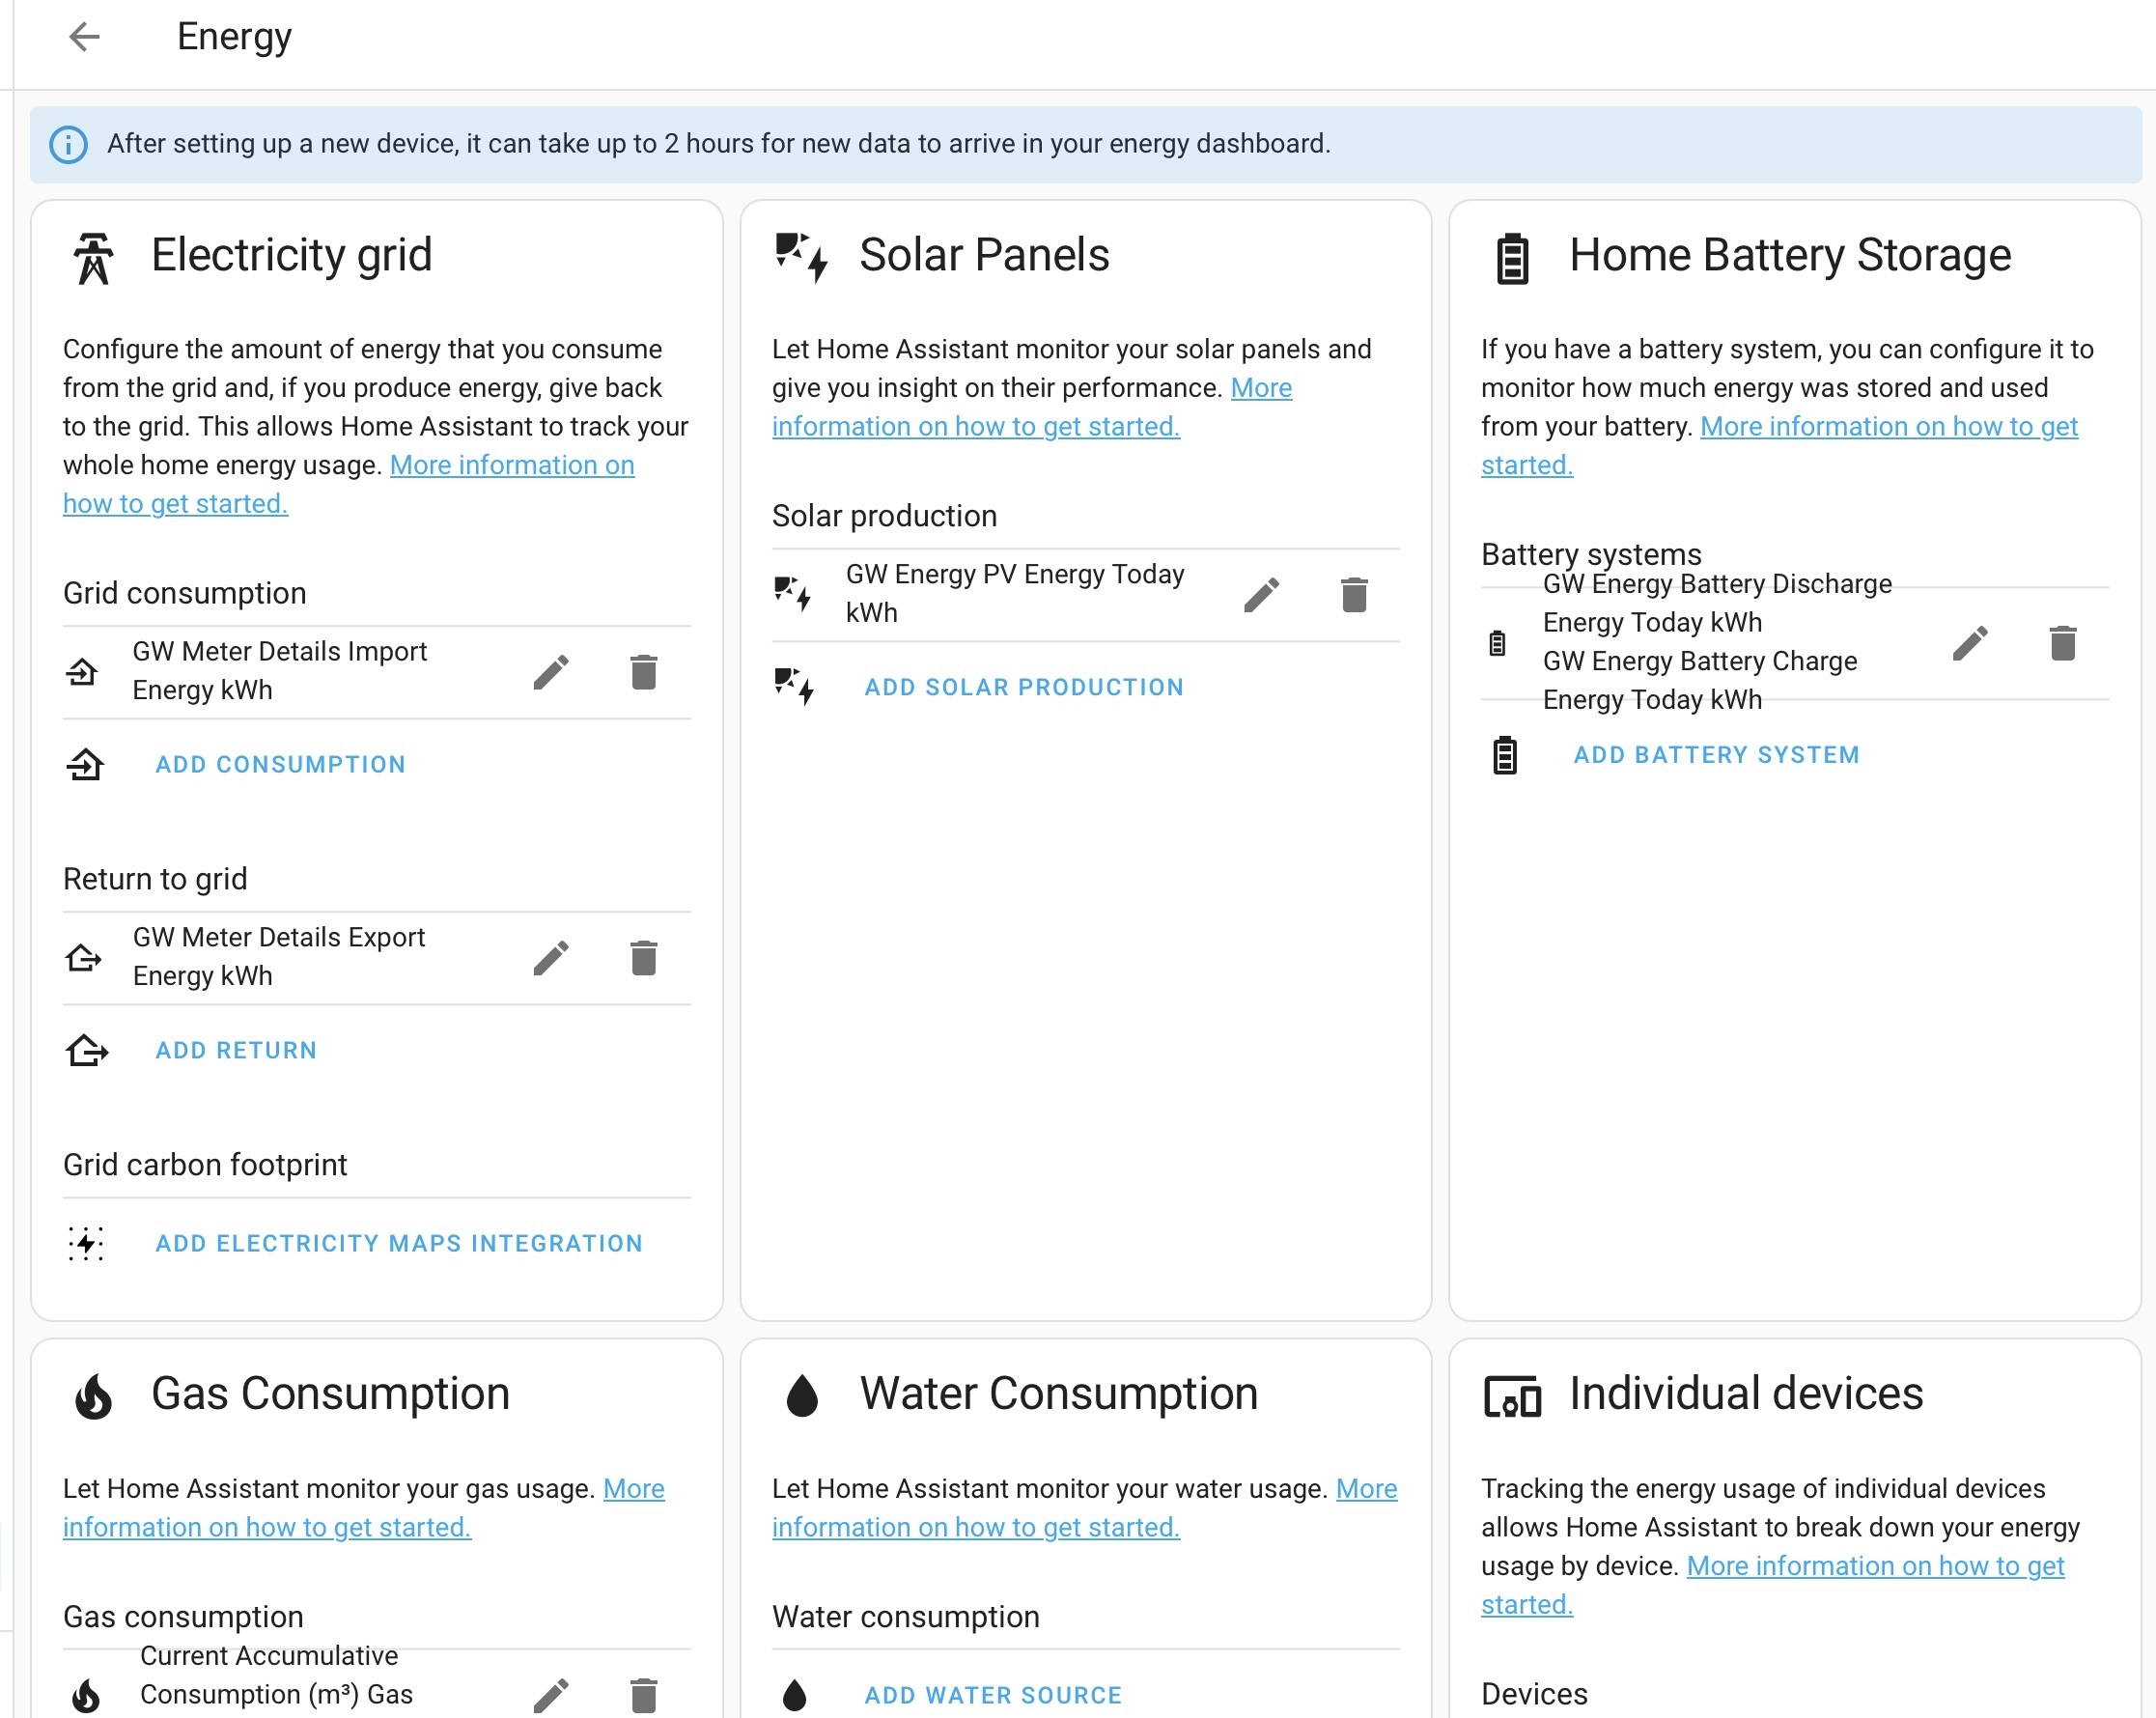
    min: 0
    apex_config:
      tickAmount: 10
  - id: header_only
    show: false
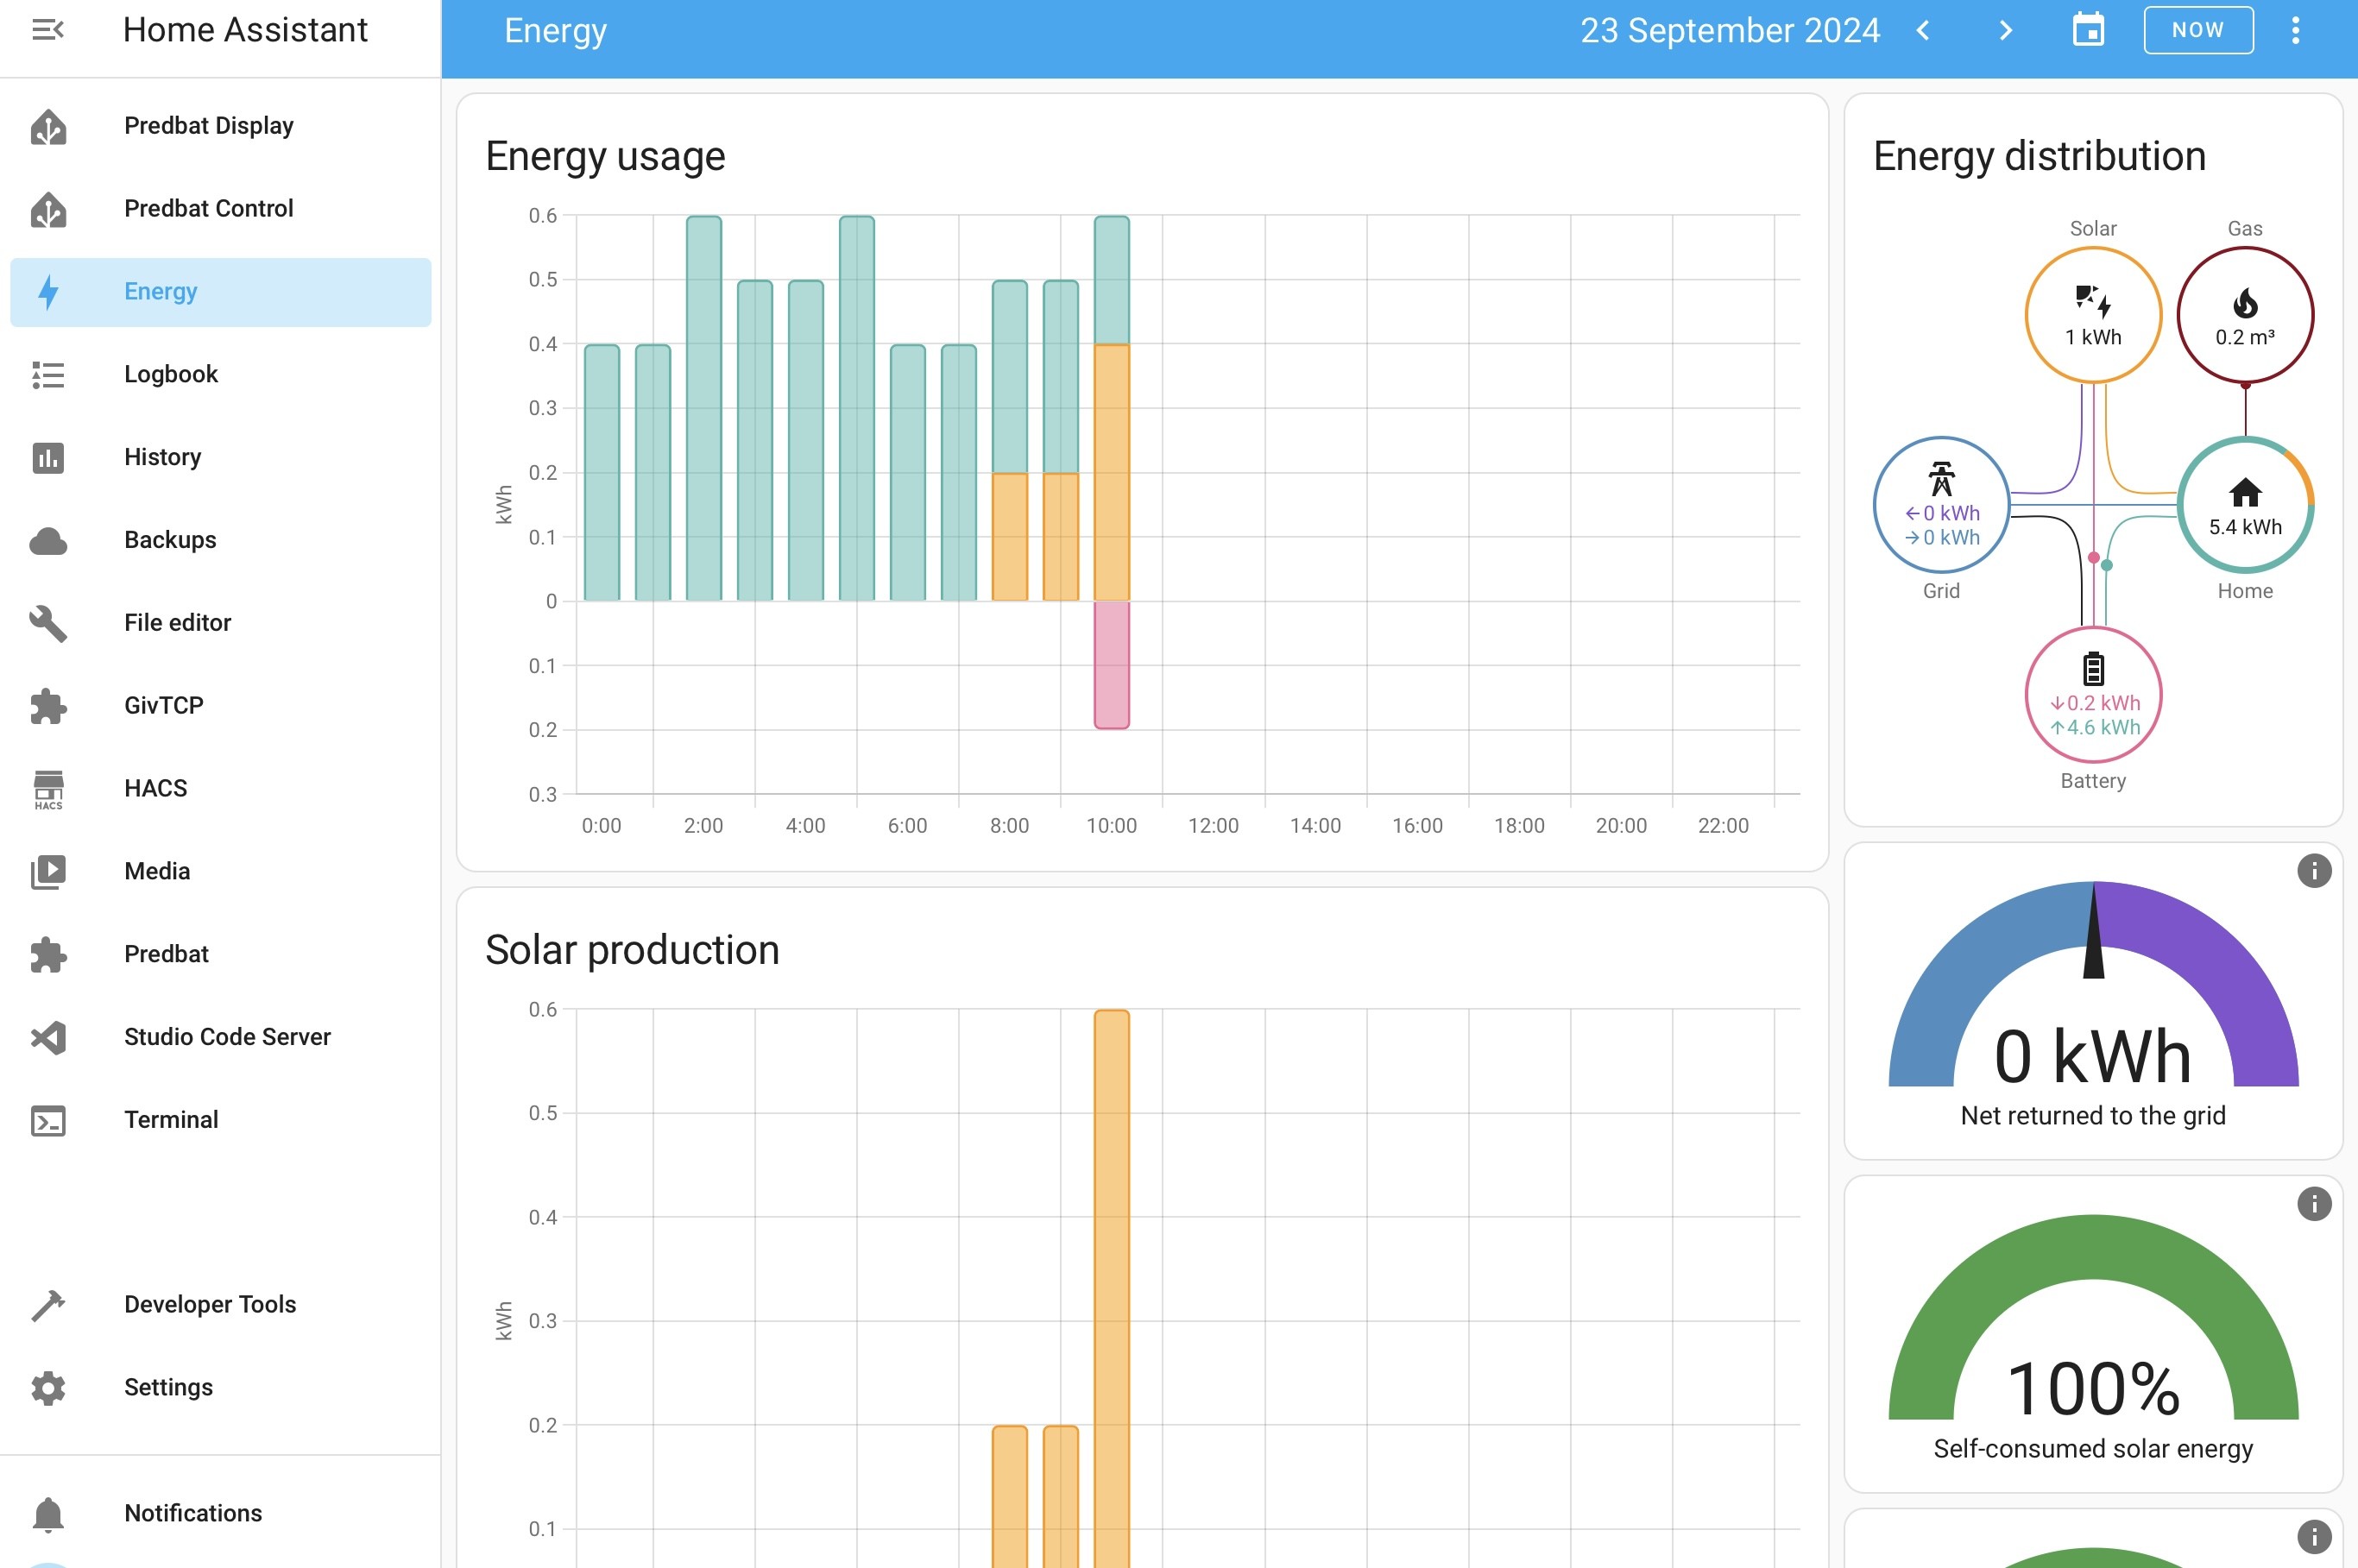
series:
  - entity: sensor.givtcp_ce2218g352_pv_power
    name: Solar Power
    type: line
    stroke_width: 2
    float_precision: 2
    color: Orange
    yaxis_id: kWh
    unit: kW
    transform: return x/1000;
    extend_to: now
    show:
      legend_value: true
      in_header: false
    group_by:
      func: avg
      duration: 5m
  - entity: sensor.predbat_pv_today
    name: Forecast
    color: grey
    opacity: 0.3
    stroke_width: 0
    type: area
    extend_to: false
    yaxis_id: kWh
    show:
      legend_value: false
      in_header: false
    data_generator: |
      return entity.attributes.detailedForecast.map((entry) => {
            return [new Date(entry.period_start), entry.pv_estimate];
          });
  - entity: sensor.predbat_pv_today
    name: Forecast 10%
    color: grey
    opacity: 0.3
    stroke_width: 0
    type: area
    extend_to: false
    yaxis_id: kWh
    show:
      legend_value: false
      in_header: false
    data_generator: |
      return entity.attributes.detailedForecast.map((entry) => {
            return [new Date(entry.period_start), entry.pv_estimate10];
          });
  - entity: sensor.solaredge_energy_today
    yaxis_id: header_only
    name: Today Actual
    stroke_width: 2
    color: Orange
    show:
      legend_value: true
      in_header: true
      in_chart: false
  - entity: sensor.predbat_pv_today
    yaxis_id: header_only
    name: Today Forecast
    color: Grey
    show:
      legend_value: true
      in_header: true
      in_chart: false
  - entity: sensor.predbat_pv_today
    yaxis_id: header_only
    attribute: remaining
    name: Remaining
    color: Grey
    show:
      legend_value: true
      in_header: true
      in_chart: false

Next few days

type: custom:apexcharts-card
apex_config:
  chart:
    height: 350px
all_series_config:
  unit: ' kWh'
header:
  title: Solar forecast
  show: true
  standard_format: true
  show_states: true
  colorize_states: true
graph_span: 4d
span:
  start: day
  offset: '-0h'
now:
  show: true
  label: Now
yaxis:
  - id: kwh
    min: 0
    apex_config:
      tickAmount: 5
  - id: header_only
    show: false
series:
  - entity: sensor.predbat_pv_today
    yaxis_id: kwh
    type: area
    name: Today
    color: grey
    opacity: 0.3
    data_generator: |
      var today = entity.attributes.detailedForecast.map((start, index) => {
        return [new Date(start["period_start"]).getTime(), entity.attributes.detailedForecast[index]["pv_estimate"]];
      });
      var data = today
      return data;
    show:
      legend_value: false
      in_header: false
    stroke_width: 0
    float_precision: 2
    extend_to: false
  - entity: sensor.predbat_pv_today
    yaxis_id: kwh
    type: area
    name: Today 10%
    color: grey
    opacity: 0.3
    data_generator: |
      var today = entity.attributes.detailedForecast.map((start, index) => {
        return [new Date(start["period_start"]).getTime(), entity.attributes.detailedForecast[index]["pv_estimate10"]];
      });
      var data = today
      return data;
    show:
      legend_value: false
      in_header: false
    stroke_width: 0
    float_precision: 2
    extend_to: false
  - entity: sensor.predbat_pv_today
    yaxis_id: kwh
    type: area
    name: Today 90%
    color: grey
    opacity: 0.3
    data_generator: |
      var today = entity.attributes.detailedForecast.map((start, index) => {
        return [new Date(start["period_start"]).getTime(), entity.attributes.detailedForecast[index]["pv_estimate90"]];
      });
      var data = today
      return data;
    show:
      legend_value: false
      in_header: false
    stroke_width: 0
    float_precision: 2
    extend_to: false
  - entity: sensor.predbat_pv_tomorrow
    yaxis_id: kwh
    type: area
    name: Tomorrow
    color: grey
    opacity: 0.3
    data_generator: |
      var today = entity.attributes.detailedForecast.map((start, index) => {
        return [new Date(start["period_start"]).getTime(), entity.attributes.detailedForecast[index]["pv_estimate"]];
      });
      var data = today
      return data;
    show:
      legend_value: false
      in_header: false
    stroke_width: 0
    float_precision: 2
    extend_to: false
  - entity: sensor.predbat_pv_tomorrow
    yaxis_id: kwh
    type: area
    name: Tomorrow 10%
    color: grey
    opacity: 0.3
    data_generator: |
      var today = entity.attributes.detailedForecast.map((start, index) => {
        return [new Date(start["period_start"]).getTime(), entity.attributes.detailedForecast[index]["pv_estimate10"]];
      });
      var data = today
      return data;
    show:
      legend_value: false
      in_header: false
    stroke_width: 0
    float_precision: 2
    extend_to: false
  - entity: sensor.predbat_pv_tomorrow
    yaxis_id: kwh
    type: area
    name: Tomorrow 90%
    color: grey
    opacity: 0.3
    data_generator: |
      var today = entity.attributes.detailedForecast.map((start, index) => {
        return [new Date(start["period_start"]).getTime(), entity.attributes.detailedForecast[index]["pv_estimate90"]];
      });
      var data = today
      return data;
    show:
      legend_value: false
      in_header: false
    stroke_width: 0
    float_precision: 2
    extend_to: false
  - entity: sensor.predbat_pv_d2
    yaxis_id: kwh
    type: area
    name: Day 2
    color: grey
    opacity: 0.3
    data_generator: |
      var today = entity.attributes.detailedForecast.map((start, index) => {
        return [new Date(start["period_start"]).getTime(), entity.attributes.detailedForecast[index]["pv_estimate"]];
      });
      var data = today
      return data;
    show:
      legend_value: false
      in_header: false
    stroke_width: 0
    float_precision: 2
    extend_to: false
  - entity: sensor.predbat_pv_d2
    yaxis_id: kwh
    type: area
    name: Day 2 10%
    color: grey
    opacity: 0.3
    data_generator: |
      var today = entity.attributes.detailedForecast.map((start, index) => {
        return [new Date(start["period_start"]).getTime(), entity.attributes.detailedForecast[index]["pv_estimate10"]];
      });
      var data = today
      return data;
    show:
      legend_value: false
      in_header: false
    stroke_width: 0
    float_precision: 2
    extend_to: false
  - entity: sensor.predbat_pv_d2
    yaxis_id: kwh
    type: area
    name: Day 2 90%
    color: grey
    opacity: 0.3
    data_generator: |
      var today = entity.attributes.detailedForecast.map((start, index) => {
        return [new Date(start["period_start"]).getTime(), entity.attributes.detailedForecast[index]["pv_estimate90"]];
      });
      var data = today
      return data;
    show:
      legend_value: false
      in_header: false
    stroke_width: 0
    float_precision: 2
    extend_to: false
  - entity: sensor.predbat_pv_d3
    yaxis_id: kwh
    type: area
    name: Day 3
    color: grey
    opacity: 0.3
    data_generator: |
      var today = entity.attributes.detailedForecast.map((start, index) => {
        return [new Date(start["period_start"]).getTime(), entity.attributes.detailedForecast[index]["pv_estimate"]];
      });
      var data = today
      return data;
    show:
      legend_value: false
      in_header: false
    stroke_width: 0
    float_precision: 2
    extend_to: false
  - entity: sensor.predbat_pv_d3
    yaxis_id: kwh
    type: area
    name: Day 3 10%
    color: grey
    opacity: 0.3
    data_generator: |
      var today = entity.attributes.detailedForecast.map((start, index) => {
        return [new Date(start["period_start"]).getTime(), entity.attributes.detailedForecast[index]["pv_estimate10"]];
      });
      var data = today
      return data;
    show:
      legend_value: false
      in_header: false
    stroke_width: 0
    float_precision: 2
    extend_to: false
  - entity: sensor.predbat_pv_d3
    yaxis_id: kwh
    type: area
    name: Day 3 90%
    color: grey
    opacity: 0.3
    data_generator: |
      var today = entity.attributes.detailedForecast.map((start, index) => {
        return [new Date(start["period_start"]).getTime(), entity.attributes.detailedForecast[index]["pv_estimate90"]];
      });
      var data = today
      return data;
    show:
      legend_value: false
      in_header: false
    stroke_width: 0
    float_precision: 2
    extend_to: false
  - entity: sensor.predbat_pv_today
    yaxis_id: header_only
    name: Today
    color: orange
    show:
      legend_value: true
      in_header: true
      in_chart: false
  - entity: sensor.predbat_pv_tomorrow
    yaxis_id: header_only
    name: Tomorrow
    color: grey
    show:
      legend_value: true
      in_header: true
      in_chart: false
  - entity: sensor.predbat_pv_d2
    yaxis_id: header_only
    name: Day 2
    color: blue
    show:
      legend_value: true
      in_header: true
      in_chart: false
  - entity: sensor.predbat_pv_d3
    yaxis_id: header_only
    name: Day 3
    color: blue
    show:
      legend_value: true
      in_header: true
      in_chart: false
G
#176 geoffreycoan

Daveb01 I am officially in the Predbat club 👍🍾

Congratulations, hope you have many years of happy Predbat plans.

Daveb01 I like the solar prediction Graph, but can not get the grey working in the top one, and can not get kWh on up scale

Now you are running Predbat you’re not allowed to ask questions any more, that service is only available for newbies 😂

(check the unit of measurement of your solar forecast today sensor)

G
#177 geoffreycoan

Rbor I use the Predbat method for PV so my code doesn't have the solcast entities. But rest should be comparable.

Actually your graphs work fine regardless of whether you are using Solcast or Predbat to get the solcast forecast as Predbat populates its predbat_pv_ entities regardless of where it got the solar forecast from.

You can swap to using the solcast entities as I prefer to do, but note that they are numbered differently (today, tomorrow, d3, d4, etc).

Your second graph shows today, tomorrow etc onwards. If you want to change it to be a true ‘future’ forecast (i.e. exclude today which is already in the other chart) you need to change graph_span and offset:


graph_span: 3d
span:
  start: day
  offset: +1day

But then to get the header values to show (and not have an ‘offset’ label), have to add an offset and offset_in_name to each of the header entities:

    yaxis_id: header_only
    name: Tomorrow Forecast
    color: Grey
    offset: '-1day'
    show:
      legend_value: true
      in_header: true
      in_chart: false
      offset_in_name: false

You wouldn’t believe how long it took me to work this out

I have added ``` either side of the code to keep the yaml formatting.

⭐️

R
#178 Rbor

Here are my charts to go along with the yaml code above:

Rob

D
#179 Daveb01

geoffreycoan

Reading between the lines now I am officially not a newbie and can not ask questions 😀. Does that mean I can really ask questions but the beer charge has now doubled 🍺🍺 ?

I have been out with the dog for an hour or so to let Predbat do its thing. @Rbor your right it’s impossible not to look 😎.

D
#180 Daveb01

Thank you all for your advice on the graphs, I will have a look, I have now got it sussed in adding code, add a test chart card to dashboard, copy yaml, if it works move to to correct card if not I can mess about with it so I don’t mess up my card that is working 😀

Will keep you posted.

R
#181 Rbor

Daveb01 This is how you learn. I adapted existing code to generate my chart.
Once you get the hang of it, it is easy to add more days or take days away, depending on the number of future days with entities.

Rob

D
#182 Daveb01

Rbor

Added your code and get this directly. However I think the solar Today Actual needs a tweak (unless there is a solar flare event)

I have now got to work out what Geoffrey has now commented 0n your yaml, and see if I can do those. 🥴

D
#183 Daveb01

geoffreycoan

So this is where I am at, at the moment. Whatever I try I can not get the grey to com back on my graph.

Hhhmm I was going to add my code but do not know how to do that? I have paste and it does not look like how you guys do it. Do I have to use one of the icons below, to the right of post reply?

R
#184 Rbor

Daveb01 You have a lot of values in W rather than kW
I have a Solaredge PV inverter and for my Actual heading, I have used my solar edge entity in my yaml.
- entity: sensor.solaredge_energy_today
The GE value is measured from CT clamps and I find it typically 1–2 kWh lower.
I haven't bothered for the orange line in the graph though which is:

  - entity: sensor.givtcp_ce2218g352_pv_power

The equivalent GE PV entity for the heading is:

  - entity: sensor.givtcp_ce2218g352_pv_energy_today_kwh

You have used 'power' rather than 'energy' (power is for the orange line in the graph)

And the section (lines 80-88 in my yaml):

  - entity: sensor.givtcp_ce2218g352_pv_energy_today_kwh
    yaxis_id: header_only
    name: Today Actual
    stroke_width: 2
    color: Orange
    show:
      legend_value: true
      in_header: true
      in_chart: false

You may do find it easier to use my code, change my inverter code to yours, and use the solcast respective entities for Predbat's.
You can find these via devices & services/entities and searching for pv.
You could experiment using my yaml code with a fresh apex chart.

Rob

G
#185 geoffreycoan

Daveb01 So this is where I am at, at the moment. Whatever I try I can not get the grey to com back on my graph.

The problem is (as I nudged you towards before and Rbor mentioned), you have mixed units you’re trying to display on your graph.

The scale up the left hand side must be in watts given the size of it, and the Solcast forecast is in kW. It doesn’t matter which you use as long as you are consistent. By default I think GivTCP creates its entities in Watts but personally I have changed all my sensors to read in kW as its just easier to read that way.

Go to Devices & Services / Entities, search for the entity you want to change, click it to bring up the detail, then the cog symbol and you can change the unit of measurement between W and kW.

Rbor You have used 'power' rather than 'energy' (power is for the orange line in the graph)

@"Daveb01" its worth you understanding the difference between power and energy. Power is an instantaneous reading in Watts or Kilowatts, e.g. your panels are generating 2.1kW at the moment. In a few seconds this will change. The orange line is showing how the power produced. by your panels have changed over time (using the inverter sensor history, or a CT clamp, or whatever)

Energy is a measure of power over a time period. So if your inverter generates that 2.1kW of power at a constant level for a whole hour then you will have generated 2.1kWh of energy (not power). The readings across the top and the solcast forecast are all in kWh as they are measuring power generated over a time period.

D
#186 Daveb01

geoffreycoan
@Rbor
@JasonF

Thank you all so much, I am very pleased it’s working how you guys said it should.
I have no errors or warnings.


I have got the graphs how I want to see them at the moment.

I trying as hard as I can to leave it alone (well for a few days) and let it all settle down.
Geoffrey - I have put all your charts in one place and will now go through them to see what I would like to see and keep etc.

I have one question to look at but know hurry. In GE Cloud it says who is doing what “External Change Detected”
Is there a way to change this to Home Assistant (preferable), GivTCP or Predbat?

G
#187 geoffreycoan

Daveb01 I have got the graphs how I want to see them at the moment.

I’ve been tweaking my solar charts again today, I have removed the ‘tomorrow’ chart, replacing it with Rob’s ‘next 3 days’ chart, from which I removed the ‘today’ graph. So I now have a today and a tomorrow/d3/d4 chart

I trying as hard as I can to leave it alone (well for a few days) and let it all settle down.

Ha!

Geoffrey - I have put all your charts in one place and will now go through them to see what I would like to see and keep etc.

They are not actually all my charts, the simple line graphs of key sensors are, all the Apex charts are from Trefor.
Most of them I never look at TBH, but do have a look at Trefor’s video on the charts where he explains what they contain and do. The calibration one is one I ought to get to grips with as it can help fine tune your Predbat settings to match your actual load and inverter/battery losses.

Daveb01 I have one question to look at but know hurry. In GE Cloud it says who is doing what “External Change Detected”
Is there a way to change this to Home Assistant (preferable), GivTCP or Predbat?

Have a look at this thread https://community.givenergy.cloud/d/5067-settings-alignment/ it appears that this is new, its the GE Cloud detecting that the inverter settings have been changed remotely and synchronising them into the portal which is a good idea, closes a hole in the portal being out of date, but with Predbat running it logs lots and lots of changes.
No way to change the label on the source of the change AFAIK

R
#188 Rbor

geoffreycoan Daveb01
I have never used GE cloud, preferring to use local which doesn't have a delay. So I have never looked at this. I know that Trefor has a video which I will rewatch.

But perhaps GE does have a 'solution':

Have a look at this thread https://community.givenergy.cloud/d/5067-settings-alignment/ it appears that this is new, its the GE Cloud detecting that the inverter settings have been changed remotely and synchronising them into the portal which is a good idea, closes a hole in the portal being out of date, but with Predbat running it logs lots and lots of changes.

...... but with 'lots of changes' would reading locally be more efficient?
Is there any justification for me to start using it?

Rob

D
#189 Daveb01

Rbor

I use the cloud to check things:-

Firmware updates

Settings have been changed by HA etc in the logs. (I am glad I did check as the free EVC was changing the import/export back to 12000 kW every minute. I had to change the configuration on the EVC, if I had never spotted this I would have been asking you guys why my battery was discharging at 12000 instead of the 9600 set.

Sync time on all inverters

Check api’s

D
#190 Daveb01

geoffreycoan

So last card to look at and sort. Info on HA would be good, I don’t have Studio Server (yet), don’t need those sections. I did not want to install Mushroom card, so was thinking just an entity card for CPU, Memory and Storage. However there are no Entities for HA on my system at the moment. Any ideas please?

R
#191 Rbor

Daveb01 I have mini-graph card but don't think I am using it at all.
But it looks as if Geoffrey has it somewhere. No harm in installing it.

The mushroom card/collection has a lot of potential. I have been experimenting with mushroom light card.
It wouldn't do any harm to install it – I bet you grow into it.

Rob

G
#192 geoffreycoan

Daveb01 However there are no Entities for HA on my system at the moment. Any ideas please?

You need to go to Integrations and Add the ‘System Monitor’ integration if it’s not already installed. If it is, go to the integration and enable the specific entities you want to look at.

TBH I now hardly look at this, it was to give insight to a problem whereby my HA kept hanging randomly, and turns out it was running out of CPU capacity. The particular problem child was Studio Code Server that can suffer from memory leaks and gobble up all the CPU when it does.

I have cludged a way round this with an automation that fires if my CPU % is too high, it goes through a series of rules to work out what is causing the problem, but most of the time its studio code server and so the automation restarts the add-on which cures the memory leaks and excessive CPU utilisation.
Still, it is useful to see what is happening to your HA server and checking that it is not running out of memory, CPU or disk space.

Mini graph card is in HACS. There are other ways of graphing of course available, just a simple history card would do.

D
#193 Daveb01

New Home Dashboard (it’s a start)

D
#194 Daveb01

So guys, do I call it a day on this post and move to “First Night on Predbat”?

Do we just use this post to answer questions on getting started, up until newbies turn off “Read only” mode.

Or do we carry on with both?

R
#195 Rbor

Daveb01 This thread has been very useful for doing what it says on the can: 'Predbat from scratch'
'First night' is more general and posts don't tend to dominate one area. You can get an idea of the difference between 'from scratch' and 'first night' by looking at the content of each thread.

If one topic is starting to dominate 'First night', it really needs a thread of its own (like 'from scratch').

First night has more different contributors but a scattering of 'old friends' who tour related sites. The goal is that we all help each other to use Predbat.

I like to think that you would be able to help someone getting into 'From scratch' from your experience.

Use your experience to improve your understanding and you will naturally find that you ask fewer questions, and be able to help others.

Rob

G
#196 geoffreycoan

Daveb01 I'd suggest we carry on with 'first night' and leave this one for other newbies as a reference point.

@Rbor I am back reading the backlog on first night again, only 101 to go ....

W
#197 Wavy Davy

PianSom Can I ask how you get the givenergy Graph

on your dashboard?

#198 PianSom

Wavy Davy
Enjoy! (Orig version from The_Dragon - hat tip)

type: custom:apexcharts-card
experimental:
  color_threshold: true
header:
  show: false
  floating: false
  title: Last 24h
graph_span: 24h
show:
  last_updated: true
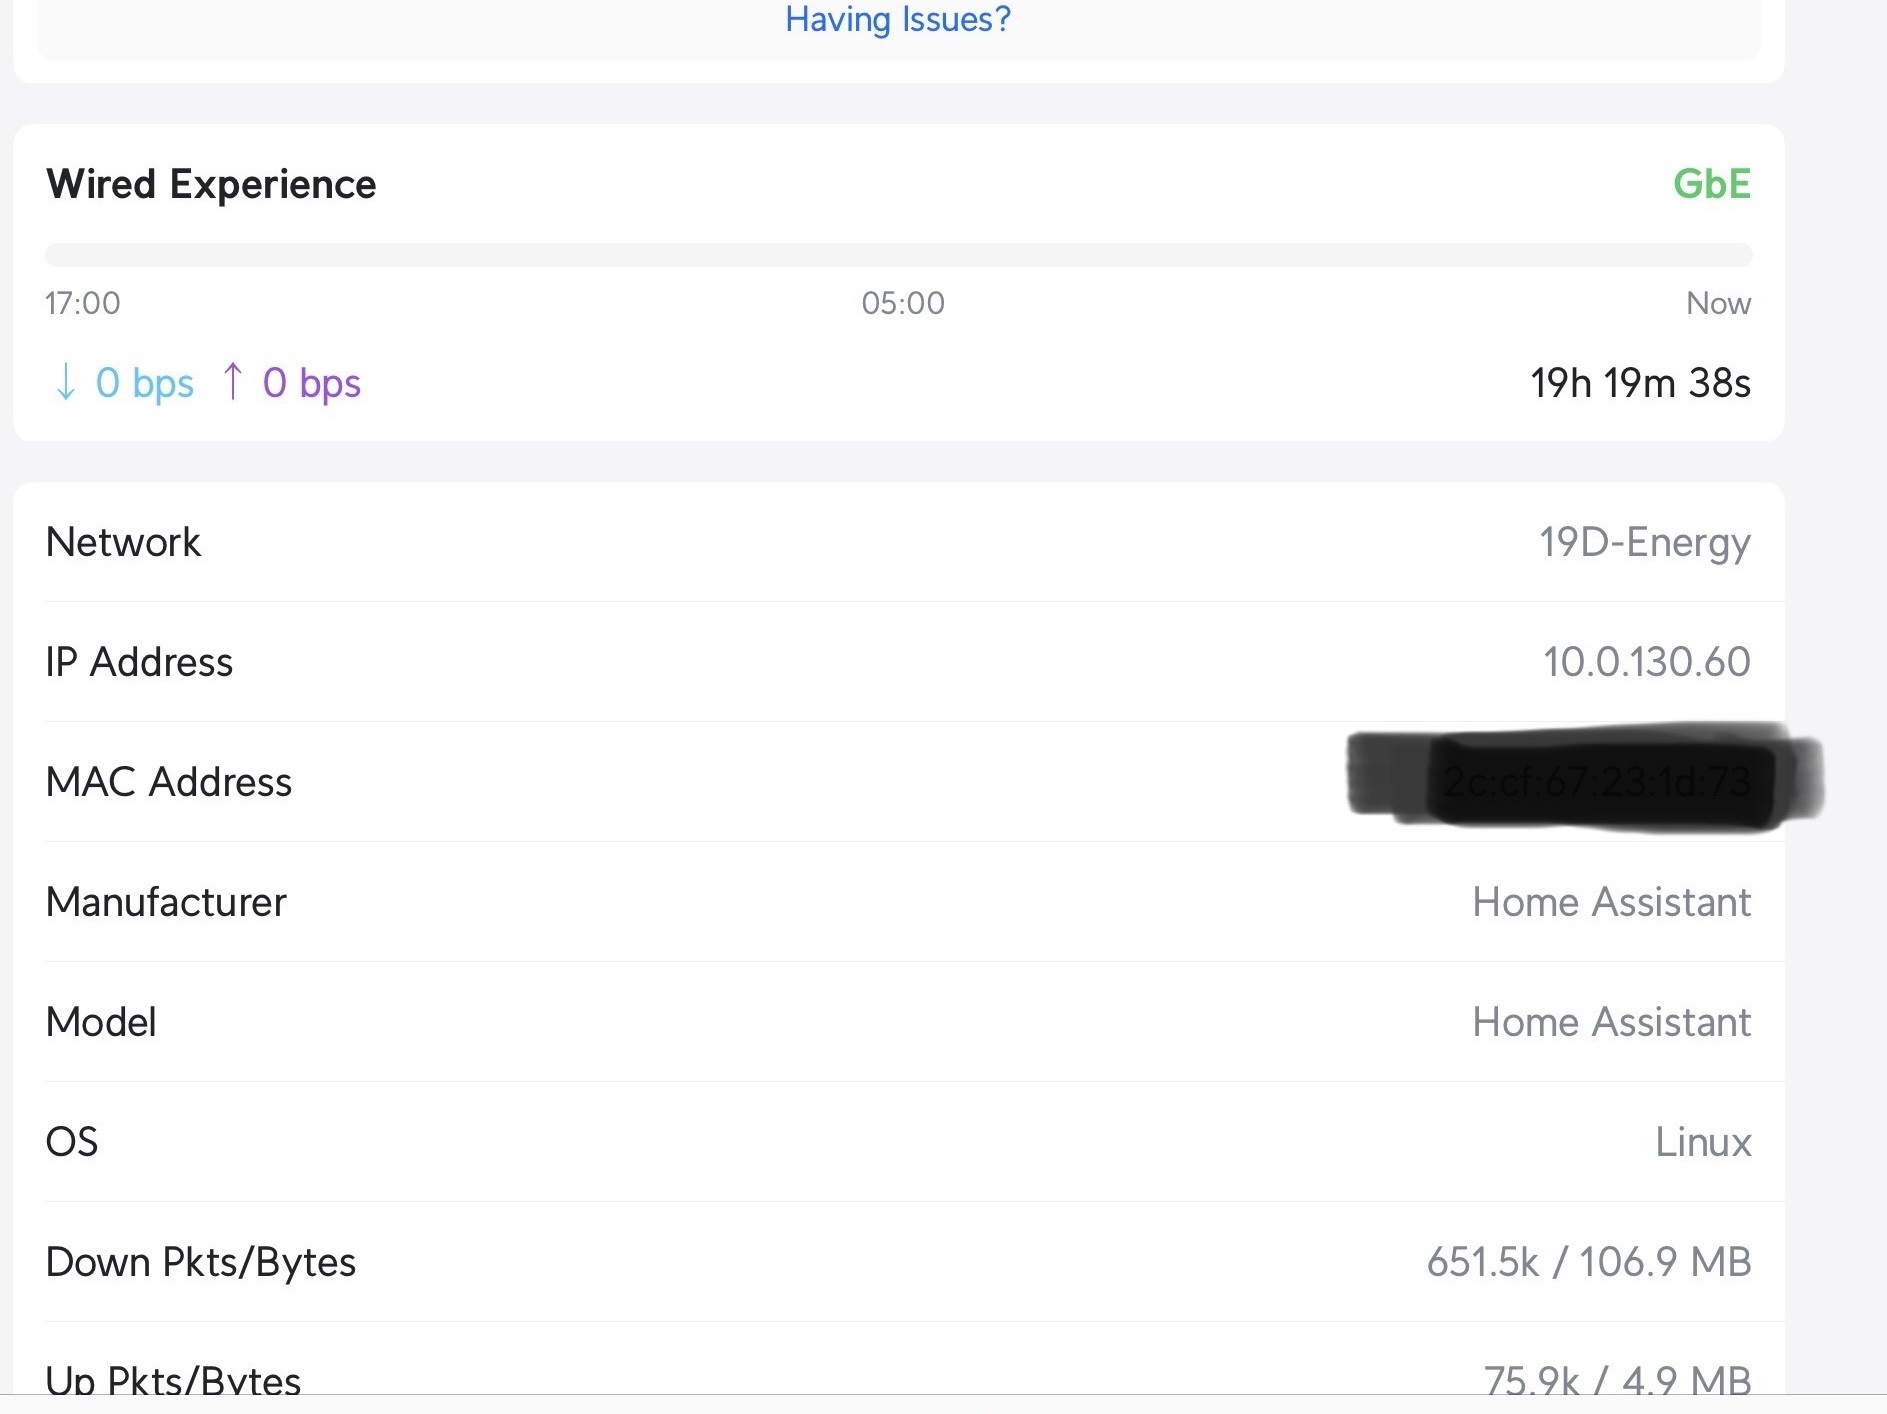
  loading: true
apex_config:
  chart:
    zoom:
      type: x
      enabled: true
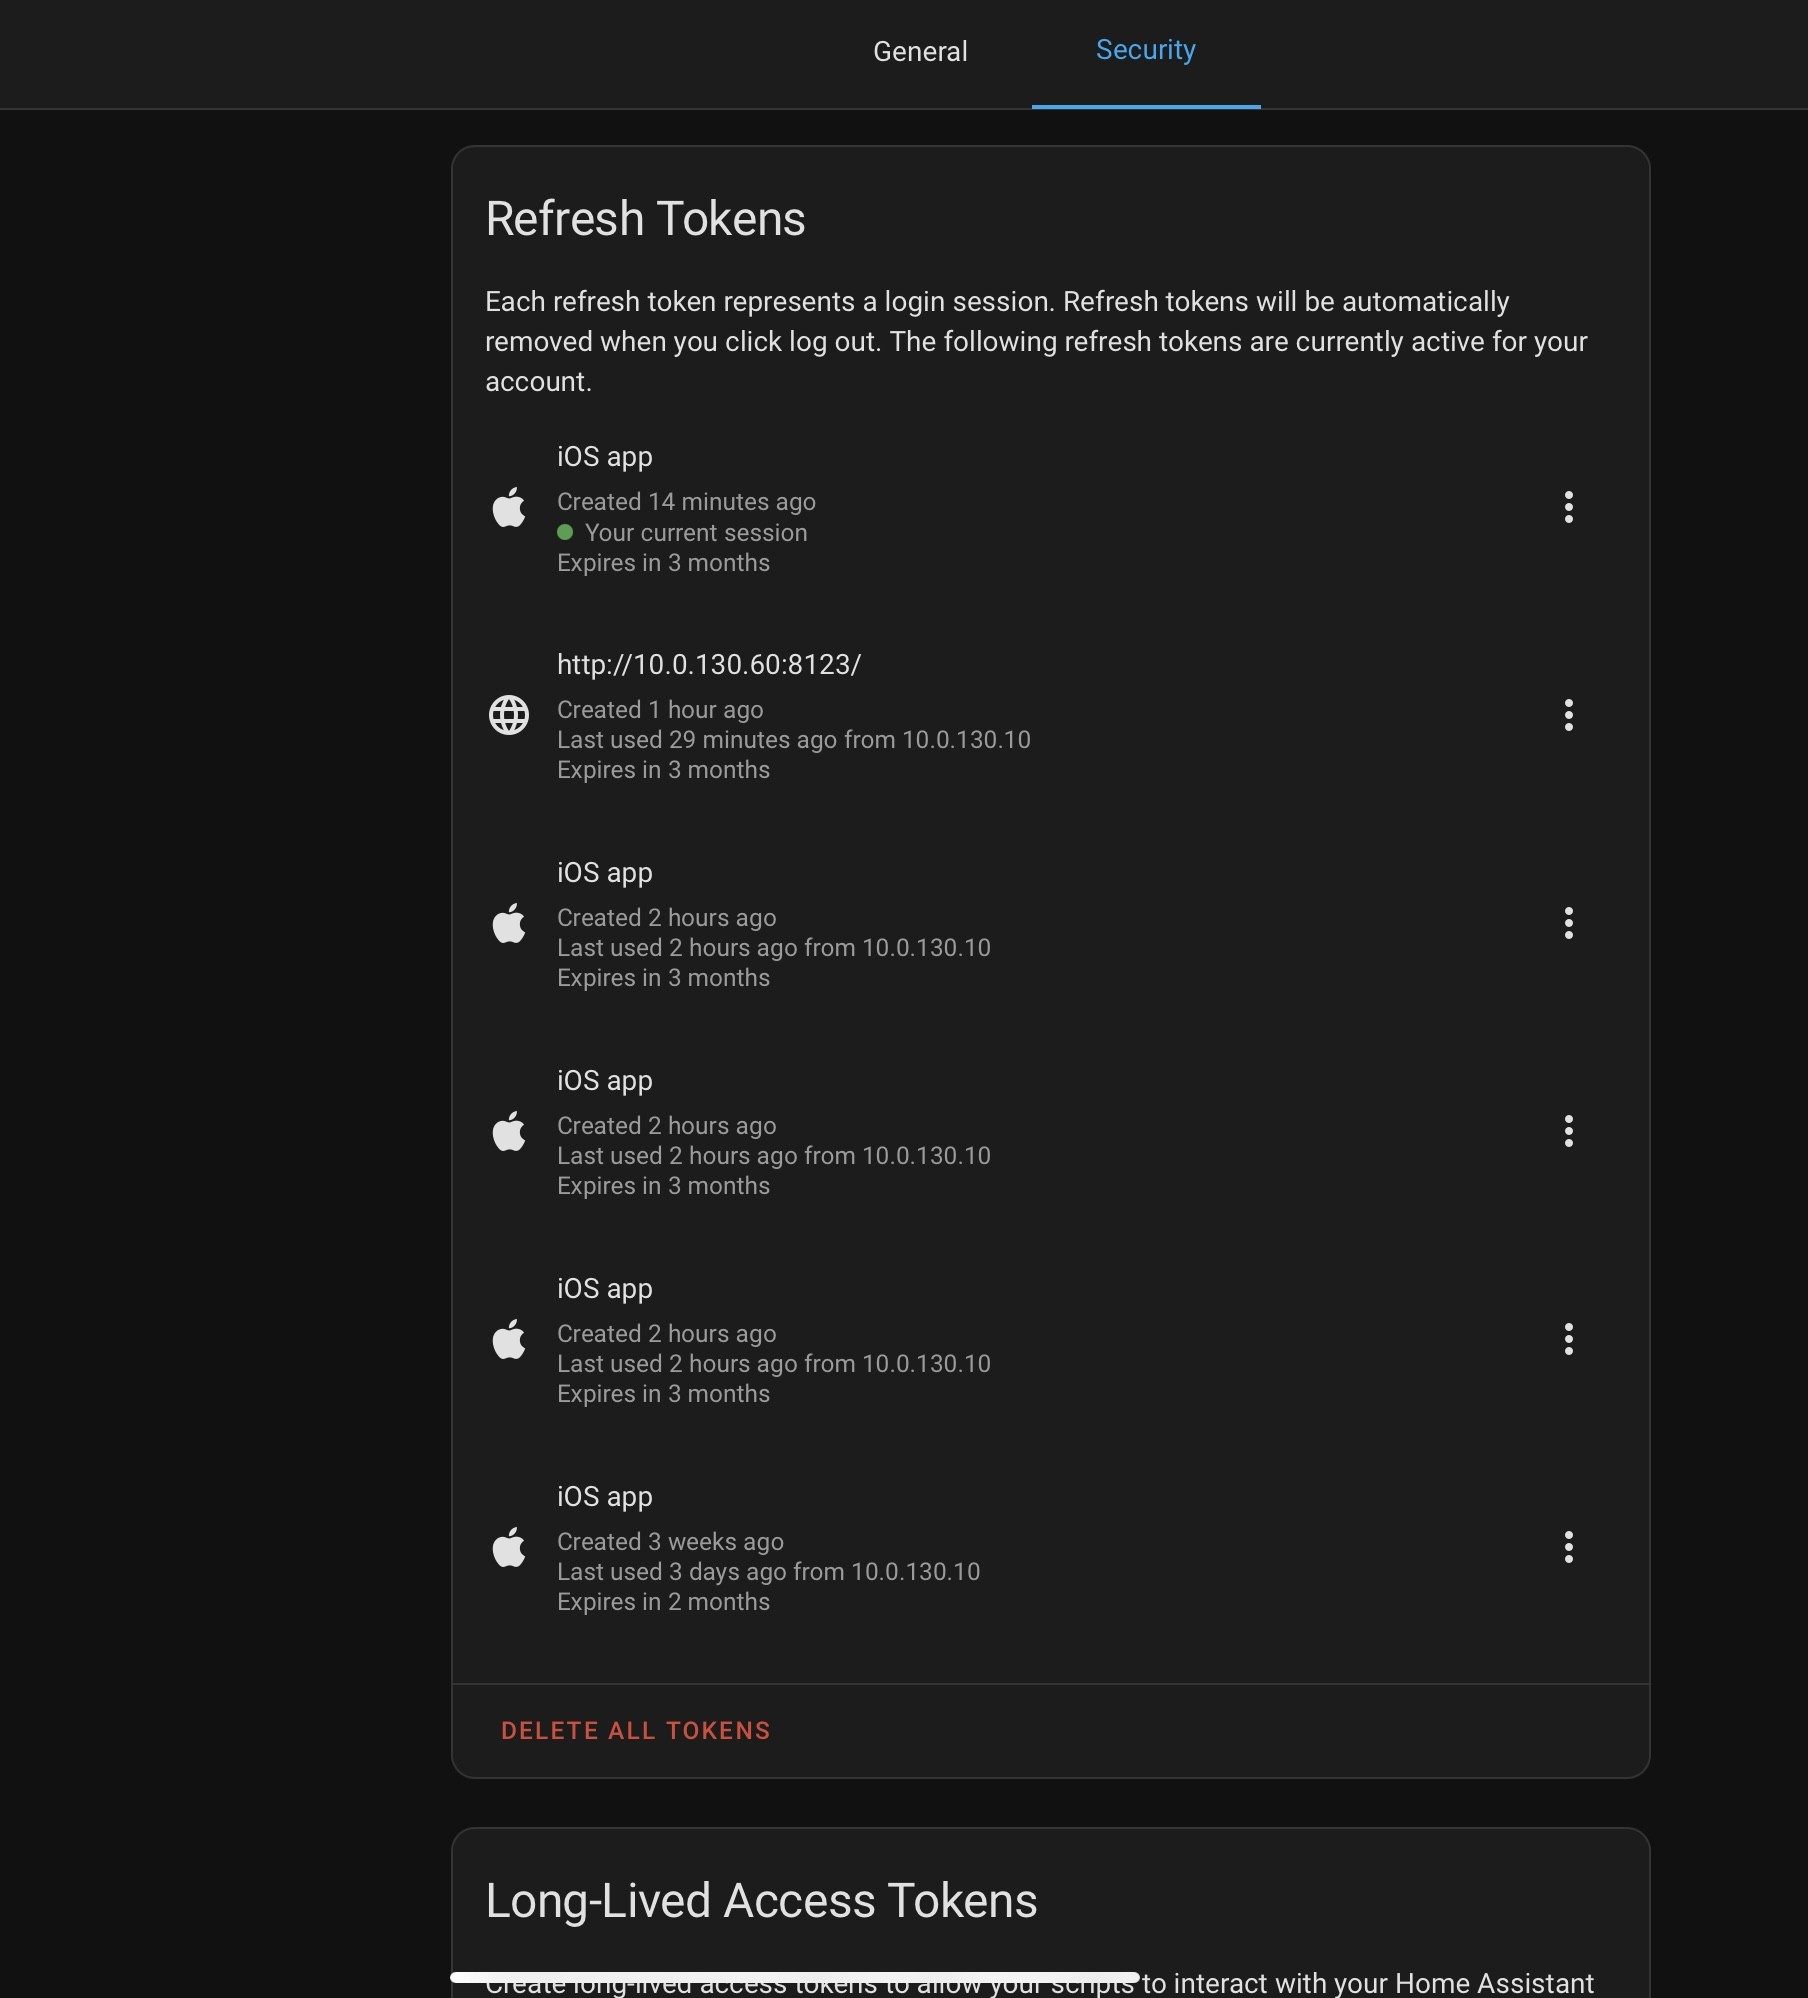
      autoScaleYaxis: false
    toolbar:
      show: true
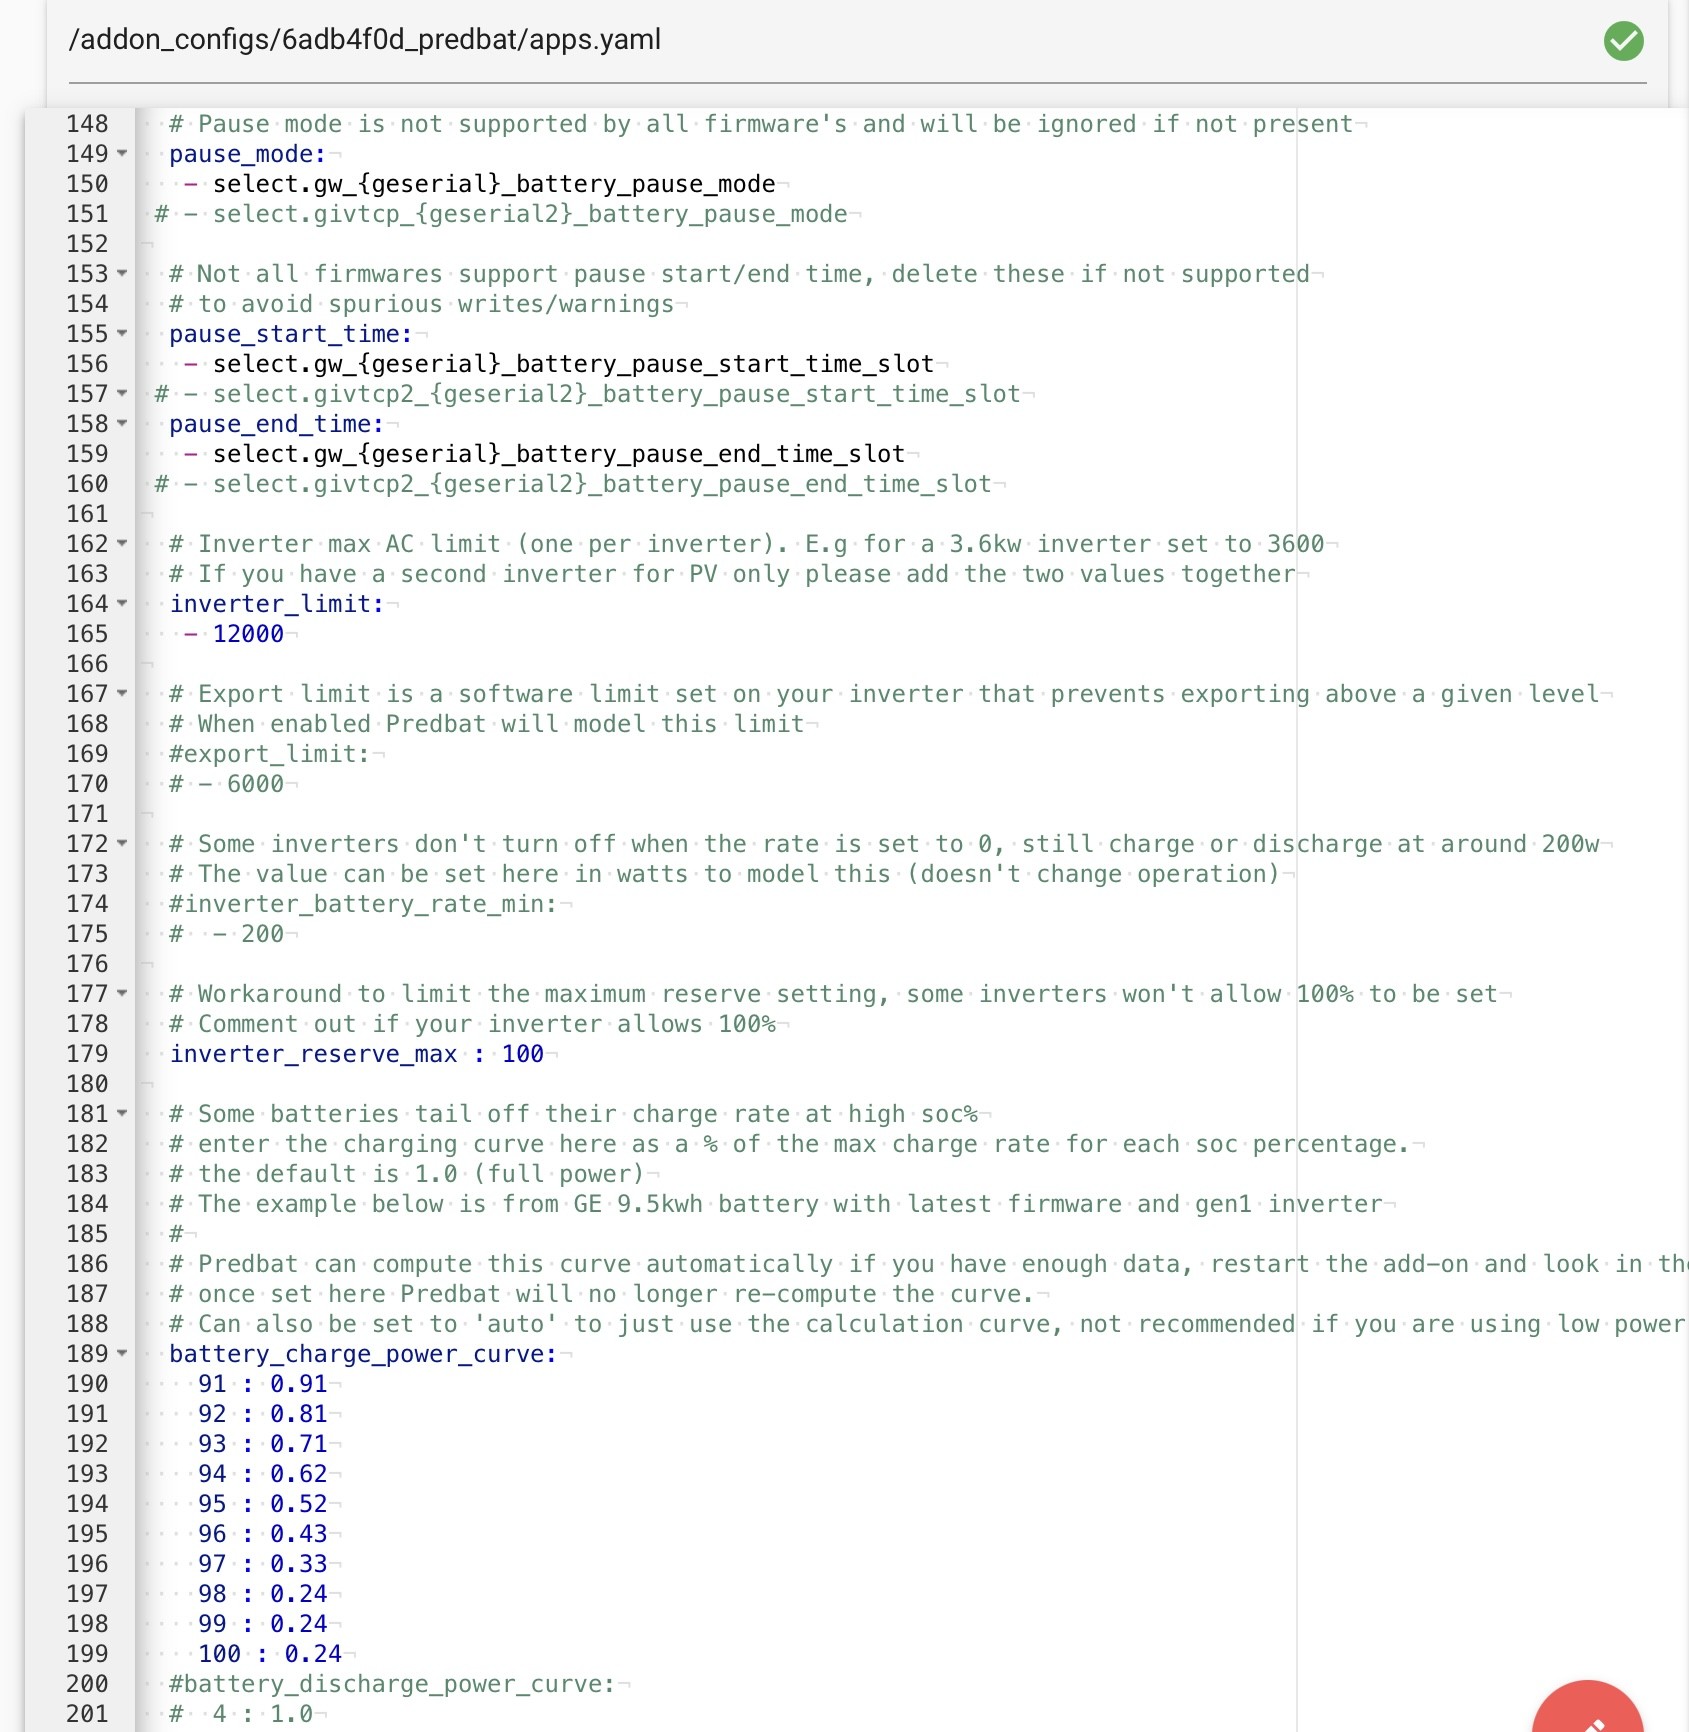
      autoSelected: zoom
    xaxis.type: datetime
series:
  - entity: sensor.givtcp_xxxxxxxxxx_grid_power
    type: area
    name: Grid
    yaxis_id: power
    color: EA3546
    group_by:
      func: last
      duration: 5m
    stroke_width: 2
    extend_to: now
    show:
      extremas: false
      header_color_threshold: true
  - entity: sensor.givtcp_xxxxxxxxxx_battery_power
    type: area
    name: Battery
    yaxis_id: power
    color: darkblue
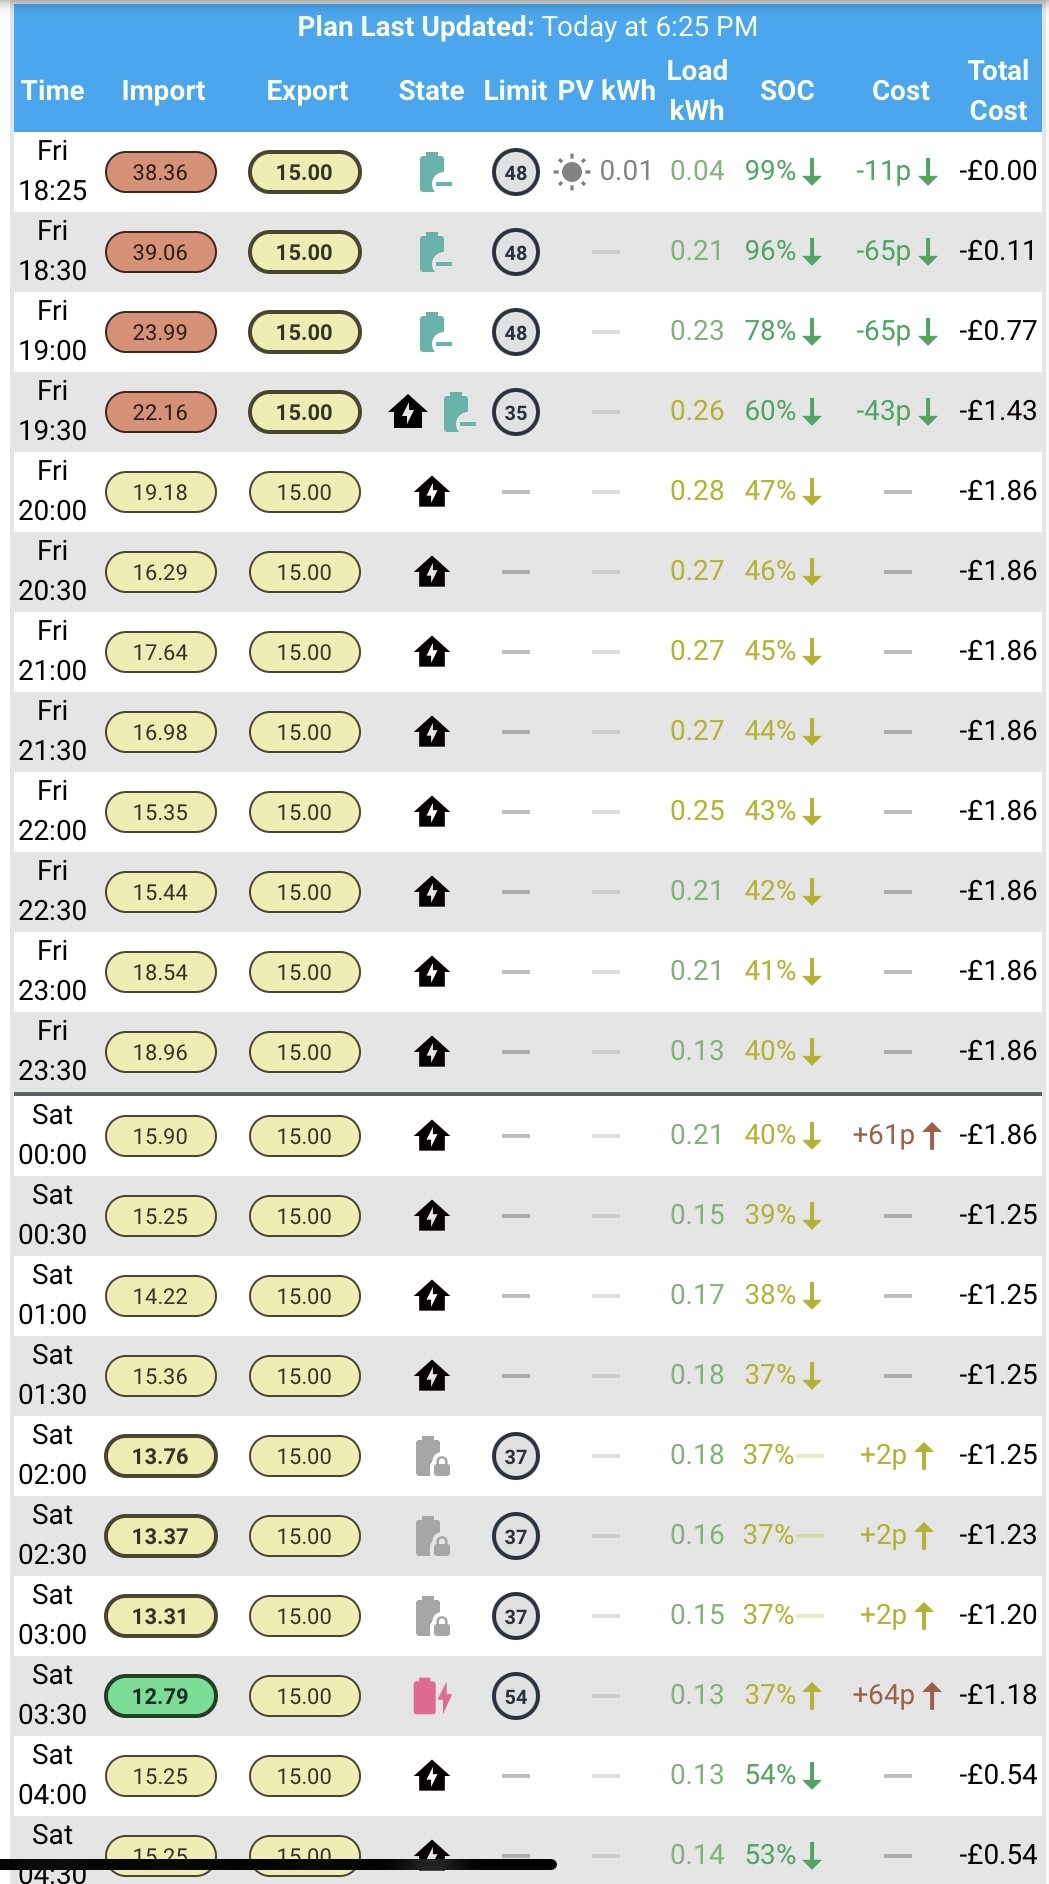
    group_by:
      func: last
      duration: 5m
    stroke_width: 2
    extend_to: now
    show:
      extremas: false
      header_color_threshold: true
  - entity: sensor.givtcp_xxxxxxxxxx_pv_power
    type: area
    name: PV
    yaxis_id: power
    group_by:
      func: last
      duration: 5m
    color: f9ce1d
    stroke_width: 2
    extend_to: now
  - entity: sensor.givtcp_xxxxxxxxxx_load_power
    type: area
    name: Load
    yaxis_id: power
    group_by:
      func: last
      duration: 5m
    color: 1B998B
    stroke_width: 2
    extend_to: now
  - entity: sensor.givtcp_xxxxxxxxxx_soc
    type: line
    name: SoC
    yaxis_id: soc
    color: 3f51b5
    group_by:
      func: last
      duration: 5m
    stroke_width: 1
    extend_to: now
    show:
      extremas: false
      header_color_threshold: true
yaxis:
  - id: power
    align_to: 500
    min: ~-7500
    max: ~7500
    apex_config:
      tickAmount: 6
  - id: soc
    min: 0
    max: 100
    opposite: true
    apex_config:
      tickAmount: 4
R
#199 Rbor

PianSom Thanks for this.
Not got all the colours, header and footer but here's my 1st stab against the actual poster flow from GE site:

Rob

#200 PianSom

Rbor
Glad to see I'm not the only one suffering from the middle of the night "ooh, I know, let's try a 5 minute reversal of charge/discharge and see what happens" effect

R
#201 Rbor

PianSom Yes, it helps to copy all of the code, rather than just what can be seen on the window onscreen.
This is take 2. A neat chart.
Aren't these apex charts brilliant?

Rob

W
#202 Wavy Davy

PianSom thanks very much for this, just got to figure out why my Grid power and load power are 0.

#203 PianSom

Wavy Davy
Odd. Are those two sensors both zero in GivTCP? I have not come across a failure like that.

W
#204 Wavy Davy

No they both look normal.looking at the chart instant readings grid varies down to 2.7Kw and load to 0.3 but both show as flat lines. odd

W
#205 Wavy Davy

W
#206 Wavy Davy

Looking on HA they look normal, but on the chart although the instant value show as varying the chart is a flat line

#207 PianSom

Wavy Davy
Looks to me like you have a units issue. My load and grid sensors are both W (not kW). Same as the axis.

Have you changed them?

You can set to W by going to the sensor in Settings / Entities, selecting the sensor and then hitting the little gear-like icon top right and putting the unit to W. This may have unforeseen consequences, so check carefully afterwards to make sure your system is working as you expect it to.

R
#208 Rbor

Just checked mine, with correct values (not 0 W) in the footers.
See the settings in W, rather than kW under the gears for
sensor.givtcp_ce2218g352_grid_power
sensor.givtcp_ce2218g352_load_power
You can change these if in kW

Rob

G
#209 geoffreycoan

I personally have my home consumption, givtcp and solcast sensors all set to kW, just because it’s easier to read than a watts figure; and the Predbat output data entities tend to be in kW/kWh as well. Some people get caught out by this on the Predbat charts where they have data elements in mixed units of measurement.

Whilst you can change the unit of measurement for a sensor at any time it doesn’t change the sensor history (x1000 or /1000) so the graphs can look weird until the new data has washed through.

Personal choice

W
#210 Wavy Davy

I did have the units as Kw. I changed them to w and no different until midnight.I checked them this morning and all good. Would have preferred to keep them as Kw but never mind.
Might have a look to see about how to create a derived/custom sensor.
Thanks all.

#211 PianSom

Wavy Davy
You can, of course, move back to kW and just change the axis from 5000 to 5 (and the align_to size divide by 1000 also).

W
#212 Wavy Davy

PianSom That would be easier, will give it a try.

W
#213 Wavy Davy

PianSom Thanks for the tip, got it looking how I want except trying to shrink it a little as it is a bit taller than I want and cant see all of it without scrolling. I'm using Grid layout. Does anyone know how to do that?

D
#214 Daveb01

geoffreycoan

I think I have changed all mine to kW now as well, however I have tried all the suggestions you guys have commented on but the graph (vertical) still shows W. I am hoping it will be OK by tomorrow as you say the history needs to pass.
One weird thing is when I click save it shows 1-6 down the side, but goes back to 1000-6000after it’s saved.

If it does not I may need some help please?

R
#215 Rbor

Daveb01
I have copied my chart with everything in W.
I have then played around with the final lines in the yaml code, dividing by 1000 and removing the ~.
Just 2 lines changed with 6000 to 6. See charts and yaml lines.
If you have entities in kW, you probably don't need to remove the ~.
You will probably have to do something with precision within the entities.
I haven't changed my entity units from W to kW as I would have 6 to change and then 6 to change back afterwards!

i.e. W based values

yaxis:
  - id: power
    align_to: 500
    min: ~-6000
    max: ~6000
    apex_config:
      tickAmount: 6
  - id: soc
    min: 0
    max: 100
    opposite: true
    apex_config:
      tickAmount: 4

With /1000 for kW based values:

yaxis:
  - id: power
    align_to: 500
    min: -6
    max: 6
    apex_config:
      tickAmount: 6
  - id: soc
    min: 0
    max: 100
    opposite: true
    apex_config:
      tickAmount: 4

I think this should work.
I haven't changed the entity units from W to kW so they are all off the scale with the changes to the y axis.
There is probably a better solution but play around with the values once you have changed your entity units to kW.
The footer units should adjust to fit with entity units.

Hope that helps to get you towards a solution.

Rob

H
#216 Henry3rd

I have just read this discussion and the other one about setting up Predbat and have found these to be an immense help in answering many of my queries and questions. Well done to everyone involved. You all have immense perseverance and patience 🙂

I was kindly signposted to these pages after posting on the 'first night live on predbat' discussion. I had already installed the system on my pi4 following Trefor's excellent videos so was retrospectively learning.

My biggest takeaway was the need to quickly move to SSD before it crashes. The second was the discovery of bespoke dashboard cards, many of which are not on the predbat template list.

Thanks for all the fish.

PS. I now need to read the 3080 'first night live' posts

H
#218 Henry3rd

I have a question for all you learned people.
My SSD has arrived as specified by 'the Geek'. I plan to install HA as per his instruction, remove the SD card, plug in the new SSD and reboot my pi4. Is it simply then a matter of installing HACS, google drive backup and restoring from the back-up that I will take beforehand?

S
#219 SteveCook

Henry3rd
Henry(?)
I think that is exactly what I did, but TBH I cant remember because it went so smoothly and easily.
I do know that i DID NOT have to do any of my configs or dashboards - again!
Please dont hold me to that though

G
#220 geoffreycoan

Henry3rd you might be able to do it simpler by moving the storage data disk in HA after you have rebooted with the new SSD plugged in

See ‘using external data disk’ https://www.home-assistant.io/common-tasks/os/

But I have no experience of this.

R
#221 Rbor

Henry3rd I can't remember. I did this a long time ago. I think I followed Geek's instructions. If I had to install a fresh copy of HA, I would have used 'restore' from backup.
Either way, make sure that take a full backup and make sure that you have a cloud backup making use of the google backup addon:
'Home Assistant Google Drive Backup'

Rob

H
#222 Henry3rd

That's my task for tomorrow, I'm a natural pessimist so I shall leave a clear day.

S
#223 SteveCook

geoffreycoan
Geoffrey thanks for reminding me.
Henry. This is what I did and it worked.

H
#224 Henry3rd

geoffreycoan This has not worked, I'm afraid. 'Cannot use TS120GMTS820S-I858900005 as data disk as it is smaller then the current one (new: 120032591872, current: 127134580224)'. It looks like plan B.

G
#225 geoffreycoan

Henry3rd Ah well, a backup/restore via Google drive works fine. You won’t need to install HACS, just add the custom add-on repository and you can install the add-on directly

S
#226 SteveCook

Henry3rd
Henry I used a 1TB SSD. It was not much more cost than 250 or 500 GB.

H
#227 Henry3rd

Thanks Steve, I should have considered a larger SSD.
Anyway, my plan B failed: I loaded HA onto the SSD and plugged it in and removed the SD card. The Pi wouldn't start without the SD card so I put it in as well. It then got confused as there were two HA installations plugged in. I had a choice of choosing the new storage, but that just returned error messages when I clicked it.

So onto plan C! I installed HA on. a smaller SD card, plugged it in and removed the SSD, which I reformatted.
Once I placed that back in to the Pi, I could carry out plan A which moved the data source as originally intended. Phew! 🙂

S
#228 SteveCook

Henry3rd
Excellent news

G
#229 geoffreycoan

Henry3rd It sounds like the Pi is booting off the SD card. I don’t know whether there is any BIOS or similar you can change to enable it to boot off the SSD like you can with a WIndows PC, but anyway, all sorted now it sounds like.

Probably worth you taking a backup of the SD card onto another card then at least you have another boot card if the SD card does ever fail. Would be less likely to do so now you are not writing all the HA data constantly to the card, but it could still go.

Cheers

H
#230 Henry3rd

geoffreycoan I have kept the smaller card in the pi and shall keep the larger one as an emergency back-up as you suggest.

R
#231 Rbor

Henry3rd Well done.
From experience, I know just how much of a relief it is to 'win'.

Rob

R
#232 Rbor

Henry3rd As long has you have setup the correct boot order in 'raspi-config, you should be fine.
Once I had transferred HA from my old SD card onto an SSD (500 Gb, far larger than needed), I removed the SD card. My pi4 has run this way now for over a year.

You will be amazed at the difference in speed.

Rob

R
#233 Rbor

Not wishing to be 'out of the loop' on upgrading HA , this morning I finally installed my HA set up onto a pi5 that I purchased about 6 months ago for this purpose. I have instead used the pi5 as my experimental pi.

HA runs very fast on the pi5 on an NVMe 500 Gb SSD.
I installed by 'restoring from backup', taken just before the set up.

  1. I first completely stopped my HA installation on the pi4 and turned off the pi4. I didn't want to have any potential conflicts from the 2 installations. I can login separately as the pi4 and pi5 have different IP addresses.

  2. I then set up the pi5 and reviewed what I could see. Everything looked good although I had lost some history from charts. Some charts were starting from the time I got onto predbat from the pi5. I would have thought that all the history would have been carried over in the 'restore from backup'.

Having succeeded, I then closed down my new installation on the pi5 and switched back to the pi4. Everything appeared, including all history in the charts.

  1. Now a question:
    I clearly didn't want to be logging into HA and predbat using the same credentials at the same time.

Could I continue to run HA and predbat on the pi4 (as normal) but run predbat on the pi5 in monitor mode? If I ran it like this, would this allow history to catch up? Or is it just the charts that have been messed up?

In monitor mode, I presume that no instructions would be sent to the inverter.

In the meantime, I have proved to myself that I can do this and may continue to use the pi5 as my 'experimental' setup.

Thanks

Rob

G
#234 geoffreycoan

Rbor A restore from backup should include all data. Was it a full backup or a partial?

You should be OK to run the pi4 and pi5 alongside each other, I would drop the givtcp poll frequency of the pi5 down to reduce the load on your inverter, and set predbat to read only as well as monitor mode to be doubly sure, but it should be OK. Be aware that you will consume your Solcast poll limit twice as quickly so you may need to adjust the poll frequency, maybe poll once a day on the pi5 and reduce the pi4 frequency to match.

Be interested to hear whether the pi5 is worth it over the pi4, it looks to be about £15 more expensive

R
#235 Rbor

geoffreycoan If I was choosing now, I would go for the pi5 but the pi4 is a good machine.
The pi5 is able to install HA from network so you don't have to mess around with loading HA on an SD card first. If I need to access directly, I use 'Terminal' on the mac and ssh in. But of course HA accesses everything via web app. So truly 'headless'

There is an interesting and entertaining video here, outlining the process.
The presenter has a wonderfully dry sense of humour.
https://www.youtube.com/watch?v=Ll9Tmp3tppU

I hesitate though about running 2 versions of HA and predbat (and givTCP, etc) at the same time. I am not over-worried about Solcast. I got my account several years ago with 50 calls per day. Currently I poll every 6 hours, so daily 4 for me.

You are right about pressure on inverter of two concurrent processes (twice the daily register writes?)
Since register writes blew up as a potential issue, I am averaging 50 per day, ranging from 20 to about 100.

Rob

G
#236 geoffreycoan

Rbor You are right about pressure on inverter of two concurrent processes (twice the daily register writes?)

There shouldn’t be any issue with inverter writes from the pi5 running alongside the pi4 as you won’t be updating the inverter from both instances, only the active one.

The concern I raised was about just overloading the inverter with too many concurrent requests. If you set the poll frequency too low in givtcp then the inverter can stop responding to portal commands and running 2x givtcp could cause this behaviour. But if you set the second one to poll less frequently it should be OK. I ran givtcp 2 with a 20 second poll frequency for ages and only changed to 30 seconds when I started with testing givtcp 3 as that was the recommended frequency

Moving my HA to a Pi is a planned job for next year, not least to save the 1kWh a day incurred from running a PC 24x7.
Thanks for the advice on the pi5

R
#237 Rbor

geoffreycoan The pi4 uses less energy than pi5 but we are talking about very few watts here.
I have my pi4 is a metal fanless case which acts as a heat sink and appeals to me.

I have an SDD plugged into USB3 on pi4.
I have wondered about simply plugging this into the pi5. Easy to try. Another experiment for me.
I did get an NVMe with 'HAT' for pi5 but I don't know if I would do that again. Installing the kit was OK but fiddly, especially connecting the ribbon cable. It is certainly quick but it is far easier simply plugging in an SSD. I have a 500 GB Samsung T7 that I didn't need any more so no expenditure there. The SSD also didn't need a separate power supply. Do get an official Raspberry pi power unit though. The cheapest power units can be iffy.

When you do get to changing, it is worth looking at Pimoroni: https://shop.pimoroni.com
Informative website, excellent service and support.

H
#238 Henry3rd

Rbor I have now changed the boot order, but the pi is still refusing to boot from the USB. I have left the SD card in place for now, as I assume once booted up, the SSD drive will be handling all the data changes.

V
#239 Vestas

Rbor It needs a new kernel build for the Pi5 (assuming you're using HAOS) which I'm not sure you'd get automatically when running on a Pi4. If you try it then make sure its backed up first.

Trying to run HAOS on a Pi5 in Dec 23 was pretty much a pain in terms of trying things in config files/etc. There was a lot of broken stuff (device drivers amongst others) which you had to mess about with and even then it was pretty unstable. I eventually said "life's too short for this" and went back to the Pi3 for a month or two until a stable(ish) version emerged.

R
#240 Rbor

Vestas Thanks. Although my intension was to run predbat on the pi5, my setup has worked smoothly booting from an ssd on a pi4 that I think I will leave it that way.

The pi5 will become my experimental device.

Rob